
Abstract
Abstract
Although they create considerable economic benefits, industrial parks emit tremendous amounts of pollution and consume significant environmental resources. This investigation examines problems associated with managing an industrial park. It begins by defining an industrial park system and its sustainability. Next, using systems thinking, managing for results, driving-force-pressure-state-impact-response, and system dynamics, we develop a management framework and an indicator system. A framework with triple decision layers is established to link the management of an industrial park with its manufactories. Based on this framework, proposed indicators and their driving force–pressure–state–impact–response relationships are integrated into an optimization model to maximize sustainability, so that sustainability of an industrial park is assessed as total quantity management is performed. A prototype of a total quantity and sustainability management strategy for industrial parks is developed, based on a geographic information system, Visual Basic, and Microsoft Excel. Effectiveness of the proposed methodology and system is demonstrated in a case study of Jhongli Industrial Park in Taiwan. Analytical results demonstrate that management strategies for Jhongli Industrial Park as a whole and for its manufactories can be implemented simultaneously. Furthermore, the critical factor for trading environmental, social, and economic influences to optimize sustainability can be obtained by performing a sensitivity analysis. Analytical results indicate that the proposed methodology and total quantity sustainability management system can assist administrative organizations in developing practical strategies for managing total quantities of pollution discharge and resource use of an industrial park.
Introduction
Many studies have developed methodologies or proposed concepts to achieve sustainable development (Striebig et al., 2006; Gagnon et al., 2009; Chen et al., 2010; Huang et al., 2010), and various indicators have been developed to assess the status of industrial parks in terms of sustainable development (Zhu et al., 2010; Sendra et al., 2007; Jia et al., 2006). In fact, many manufactories publish corporate sustainability reports describing their environmental, social, and economic performance with various indicators. Using these reports, Hu et al. (2011) have developed an evaluation framework for scoring the reports. Once the status of an industrial park has been assessed, strategies for managing pollution discharge and resource use are generated (Liu and Ma, 2010; Geng and Zhao, 2009; Park et al., 2008; Lambert and Boons, 2002).
Another approach, used by some studies, analyzes the park's allowable quantity of pollution discharge and resource use. Often a geographic information system (GIS) is used to do this (Elbir et al., 2010; Zhang et al., 2010; Fisher et al., 2006; Nobel and Allen, 2000). The total quantity of pollution discharge or resource use is then allocated to the manufactories (Reniers et al., 2010; Geng et al., 2007; Heeres et al., 2004). Because sustainability is influenced by the quantity of pollution discharge and the quantity of resource use, it is extremely difficult to maximize the sustainability when the assessment of sustainability is separated from the total quantity management of pollution discharge and resource use. Furthermore, because managing total pollution discharge and total resource use of an industrial park are complicated, these items of an industrial park and its manufactories are usually managed at different stages. The goal of this study is to develop a methodology and information system to manage the total quantities of pollution discharge and resource use simultaneously to enhance its sustainability.
Methodology
Total quantity and sustainability management framework
Systems thinking, managing for results (MFR), system dynamics, and the driving–force–pressure–state–impact–response (DPSIR) framework (Chen et al., 2005, 2006a, 2006b, 2007, 2009, 2011; Chen and Chiou, 2008; Maryland Department of Budget and Management, 1997) are used here to develop a new methodology. As shown in Fig. 1, an industrial park system can be conceptualized in terms of the operating relationships among its components, the natural environmental mechanisms in which pollutants and resources are involved, and the management framework that involves the authorities and the industrial park.
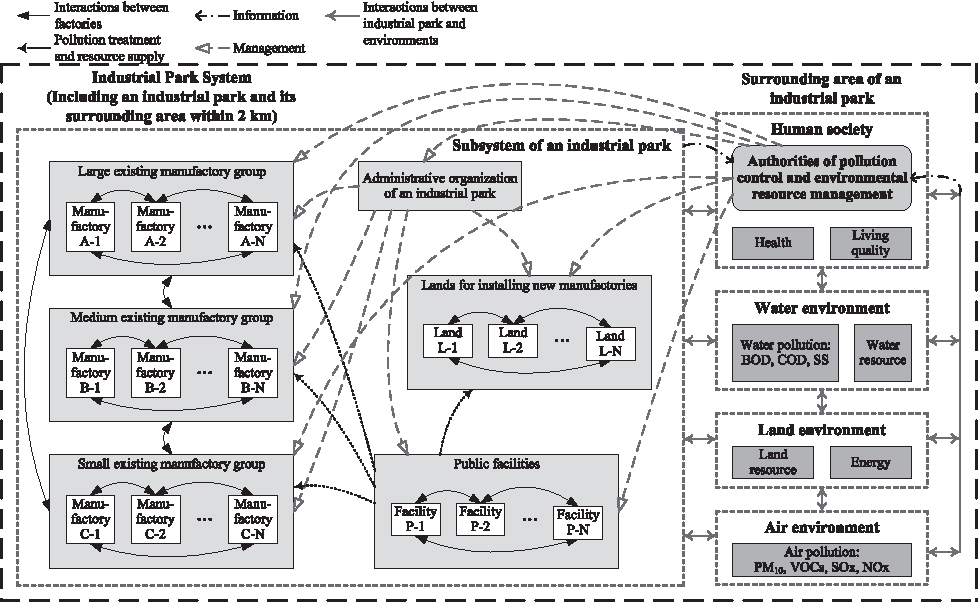
Conceptual system of an industrial park and its surrounding area. BOD, biological oxygen demand; COD, chemical oxygen demand; SS, suspended solids; PM10, particulate matter; VOC, volatile organic compound; SOx, sulfur oxides; NOx, nitrogen oxides.
This study identifies an industrial park as a subsystem of an industrial park system, which is made up of the park itself and its surrounding area. The surrounding area is made up of air, water, land, and human society. The park discharges pollutants into the surrounding area and utilizes resources from the surrounding area. Pollution discharge and resource use affect the environmental, social, and economic aspects of the surrounding area. The components of the environmental, social, and economic aspects in the system (see Fig. 1) are used to develop the sustainability indicators. For this study, the area within 2 km of the industrial park is identified as the surrounding area, because it is directly influenced by the industrial park. The interactions among the subsystems are also identified. This work defines the sustainability of an industrial park system as: The comprehensive capability of pursuing the sustainable development of an industrial park system by managing the total quantities of pollution discharge and resource use in environmental, social, and economic aspects.
This study develops a framework to manage the pollution discharge and resource use of industrial parks effectively in order to enhance their sustainability (Fig. 2). Planning, implementation, and control steps are identified, as are all managerial relationships, because the framework includes the manufactories, the administrative organization of the industrial park, and the pollution control and resource management authorities.
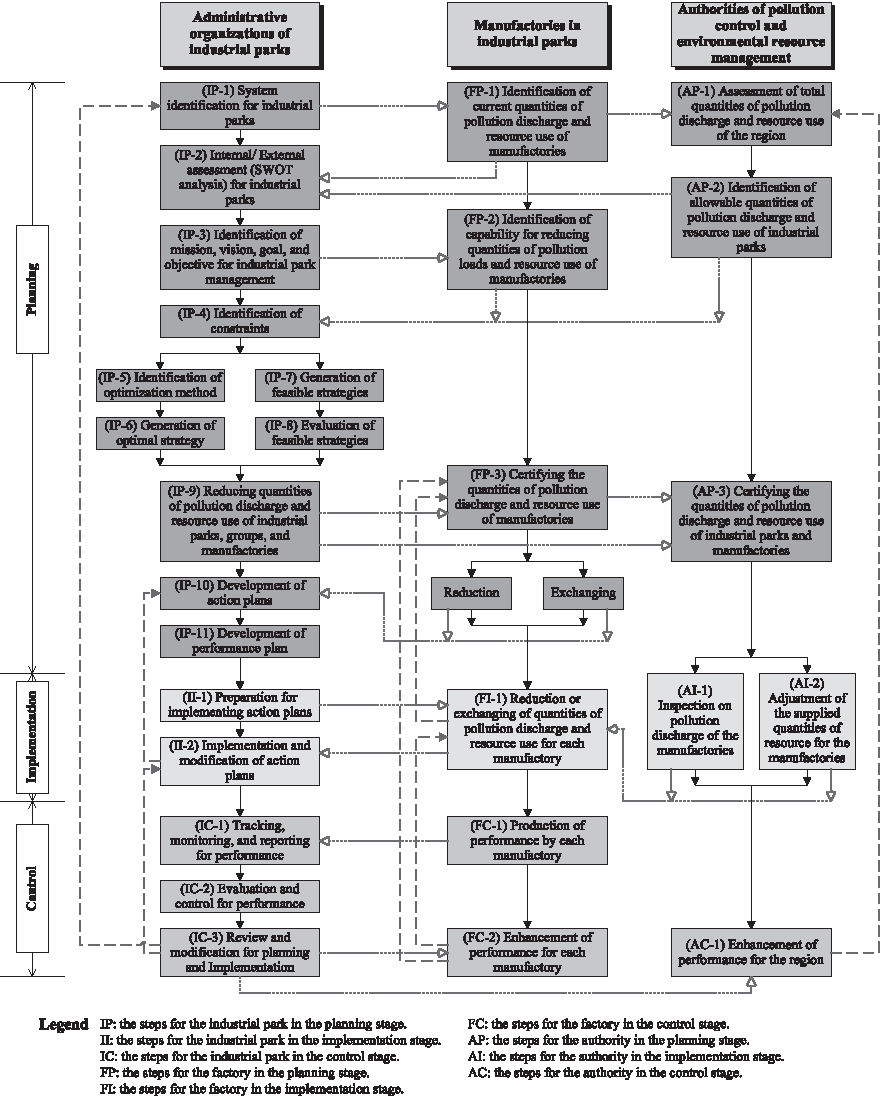
Total quantity and sustainability management framework for industrial parks and related organizations.
Sustainability indicator for an industrial park system
To capture how pollution discharge and resource use positively and negatively influence the environmental, social, and economic aspects of the industrial park system, this work develops an indicator system (Fig. 3). Indices of environmental, social, and economic aspects are considered. The environmental aspect is assessed in terms of air, water, and solid waste pollution and resource use. Air pollutants include particulate matter (PM10), volatile organic compounds (VOCs), sulfur oxides (SOx), and nitrogen oxides (NOx). Water pollutants include biochemical oxygen demand (BOD), chemical oxygen demand (COD), and suspended solids (SS). The three major resources considered are water, land, and energy. The social aspect is assessed in terms of health and living quality, while the economic aspect is assessed in terms of economic benefit and employment. The health indicator is measured by the quantities of air pollutants, water pollutants, and waste discharged by the manufactories into the surrounding area. The larger the quantities of pollutants, the more the health of people is harmed. The number of manufactories and traffic generated by them are used to assess the quality of life. The larger the number of manufactories and the greater the traffic, the more the quality of life is decreased.
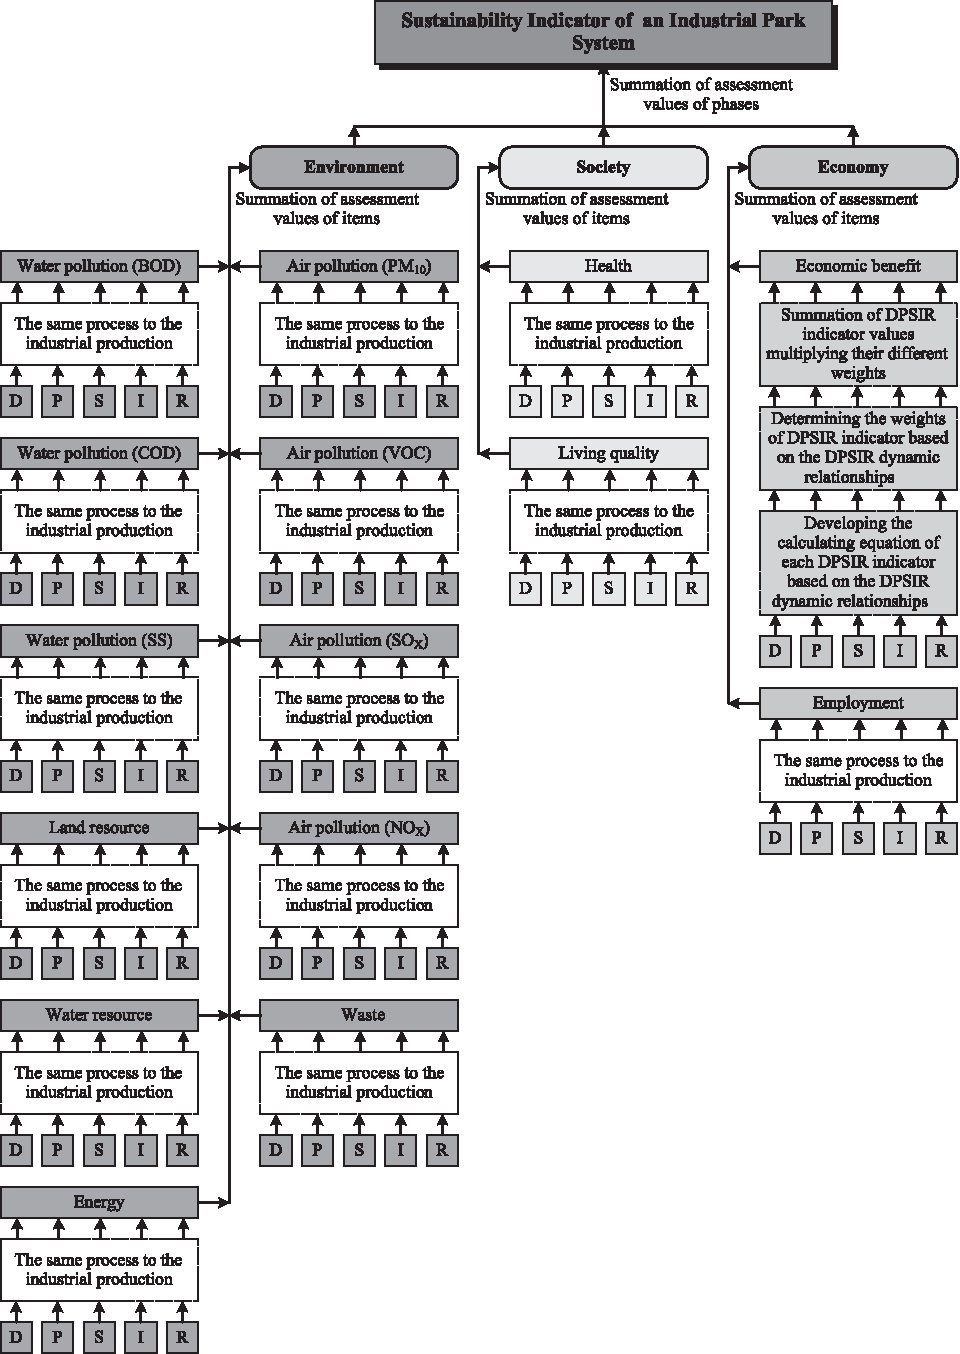
Sustainability indicator of an industrial park system. DPSIR, driving force–pressure–state–impact–response.
Each item in the indices is associated with five indicators, which are identified using the DPSIR framework. For instance, Fig. 4 illustrates the DPSIR dynamic relationships of a manufactory's BOD pollution. Because the concepts and units of these indicators are different based on concepts proposed in a previous study (Chen et al., 2011), this study develops equations for normalizing the DPSIR indicator. A positive indicator value suggests that the positive effects can lead an industrial park system toward sustainable development; a negative indicator value implies that the negative effects can lead an industrial park system away from sustainable development.
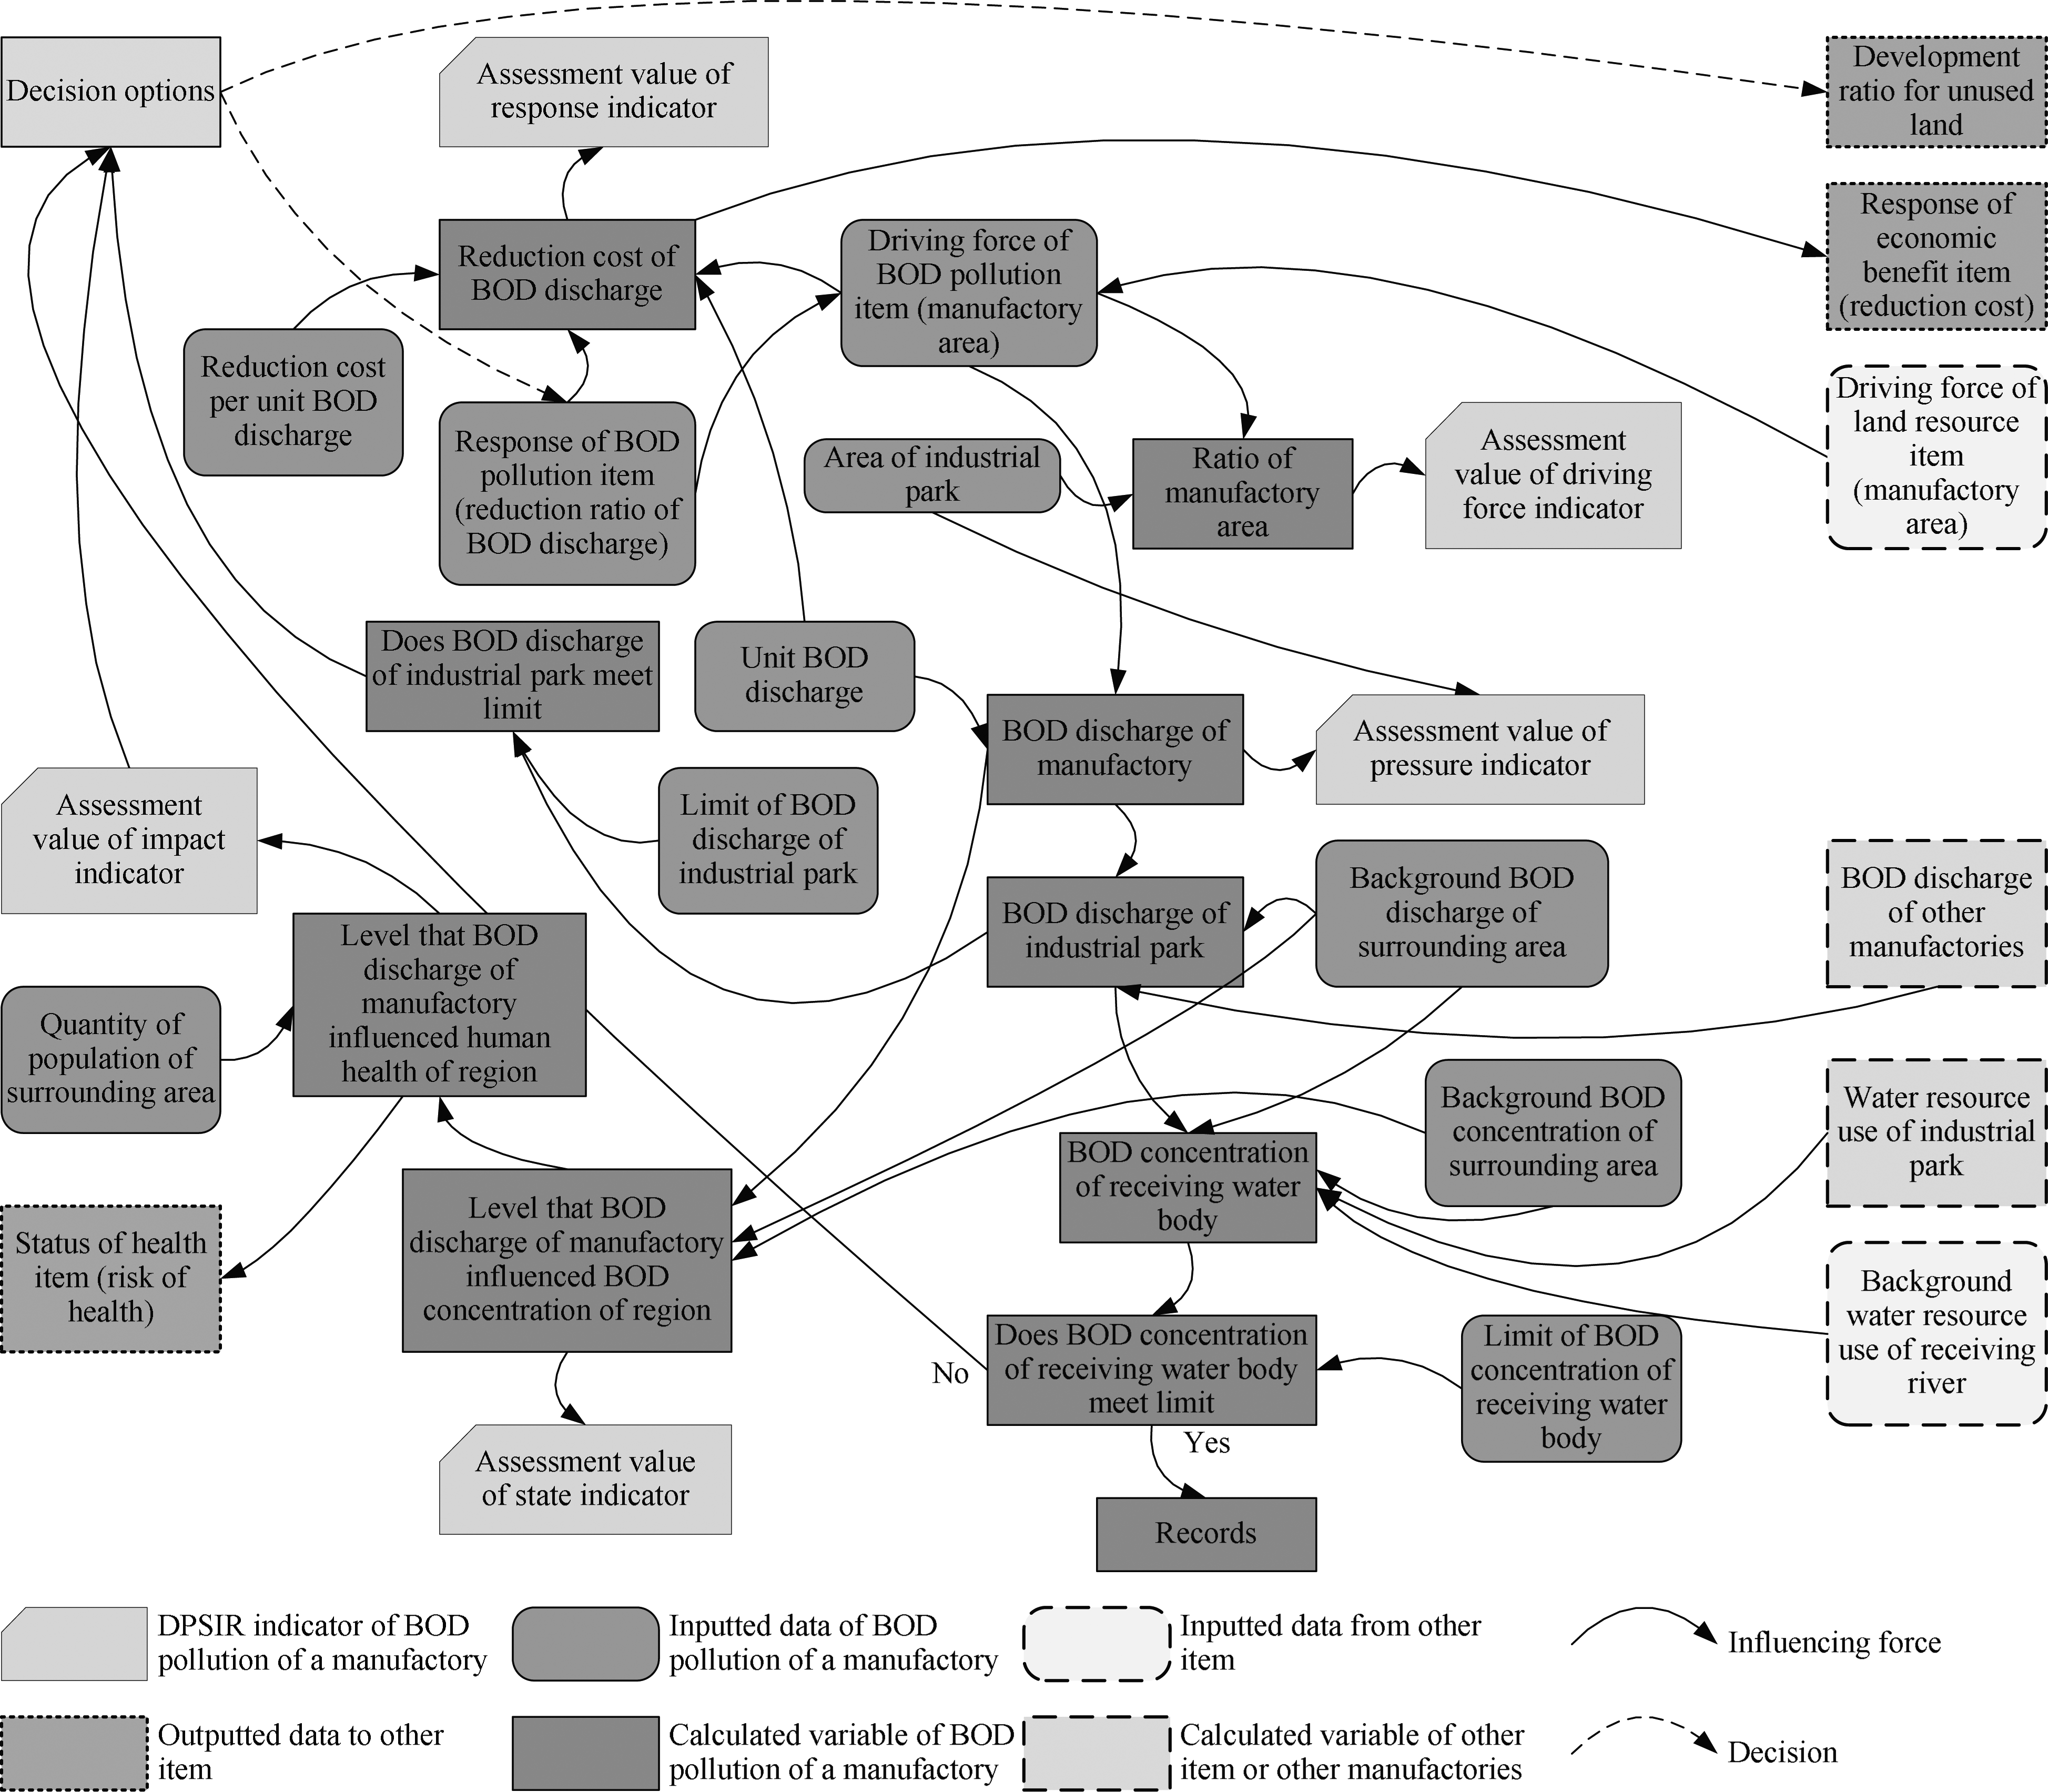
DPSIR dynamic relationships of the assessment item of a manufactory's BOD pollution.
This study weights the environmental, social, and economic aspects as 0.5, 0.25, and 0.25, respectively. The weight of each aspect is distributed among the assessment items that belong to the particular aspect based on the importance of the assessment item to the industrial park. In addition, because the interactive influences among indicators are different, this study determines the weight of each indicator by DPSIR dynamic relationships.
The indicators are used to assess the sustainable development of the industrial park and are then integrated into an optimization model to maximize the sustainability of the park.
Optimization model
This study identifies a framework with triple decision layers (Fig. 5). In the first layer, the park's total quantity of pollution discharge and resource use is managed. The second layer identifies five groups in the park: three groups of existing manufactories (large, medium, small); a group of new manufactories; and a group of public facilities. In the second layer, the total quantity of pollution discharge and resource use for each group is managed. In the third layer, the total quantity of pollution discharge and resource use allowed to each manufactory is managed. Because each manufactory can control its pollution discharge and resource use, the possible total amounts of pollution discharge and resource use of the groups and the park are very complicated. The environmental, social, and economic effects of these quantities are also very complex. Hence, the management of an industrial park and the management of its manufactories are usually considered in different layers. This study links the decision layers by hierarchical relationships. Each group within the park is considered a stage, and each group involves many manufactories. In this study, all manufactories in a group have the same responsibility to reduce their resource use and pollution discharge. If some manufactories fail to meet the reduction ratio of the group, then other manufactories in the same group must further reduce their pollution discharge or resource use. The reduction ratios of quantities of resource use and pollution discharge are determined in the group. Each assessment item for pollution discharge and resource use can be regarded as a substage in a group. The reduction ratios for each assessment item are considered to be options.
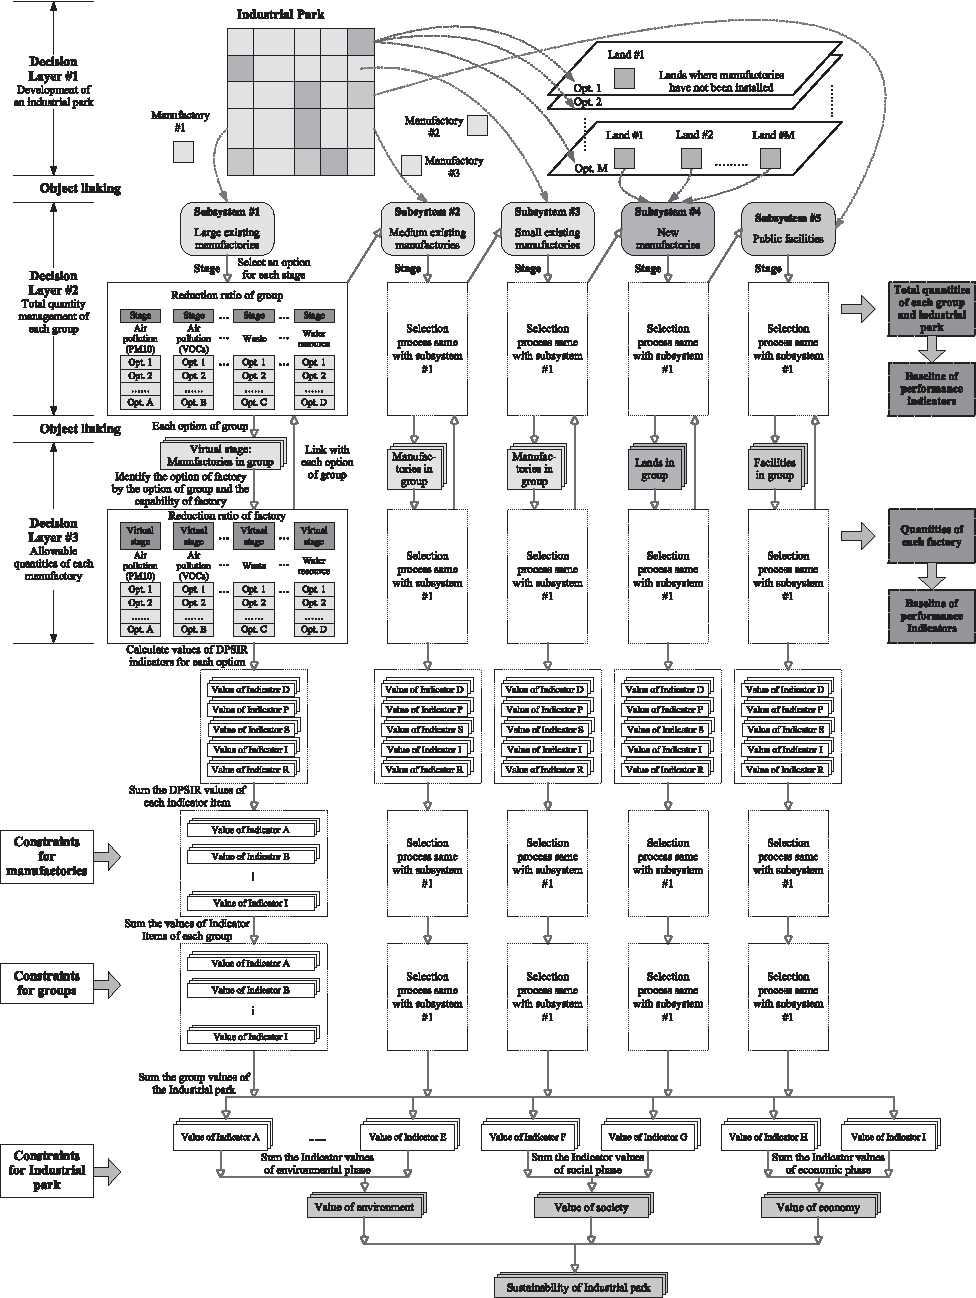
Conceptual framework of a multistage option optimization model with triple decision layers.
Because there are multiple stages and multiple options, this work develops a 0–1 mixed integer programming model to maximize sustainability. Related constraints are that the total quantities of pollution discharge and resource use of the industrial park must meet the limits identified by pollution control and resource management authorities. The park's total quantities of pollution discharge and resource use must satisfy the limits set by pollution control and resource management authorities. A modified enumeration of multiple bounds for the objectives and constraints (MEMBOC) is developed to derive the optimal solution.
Based on Figs. 3–5, this study first identifies a set of reduction ratios for resource use and for pollution discharge as options. The DPSIR indicator value for each option of the environmental aspect's 11 assessment items for a manufactory is calculated. Furthermore, the environmental, social, and economic influences generated by the manufactory are also calculated by the DPSIR relationships between indicators, which are then checked against constraints. During the search for the optimal solution, the value of each DPSIR indicator of each assessment item is multiplied by its weight. The sum of the values of all assessment items is the sustainability value of the manufactory. The sum of the sustainability values of all manufactories or facilities in a group is the sustainability value of the group.
For a combination of options, the sustainability values of all groups are summed to yield the sustainability value of the industrial park. The MEMBOC process is used to systematically and efficiently compare the sustainability values for various combinations, and the smaller value is then eliminated. The environmental, social, and economic influences are summed and whether they meet the relevant constraints is checked. Finally, the maximal sustainability value that meets all of the constraints is the optimal sustainability of an industrial park. The optimal total quantities of both pollution discharge and resource use for the industrial park can be determined when the sustainability is maximal.
Since the summations of the sustainability values for environmental, social, and economic aspects are compared with each other during the optimization process, conflicts among these aspects are considered implicitly. Therefore, environmental, social, and economic effects can be traded automatically. In the Jhongli Industrial Park case study that follows, the number of possible combinations were reduced from 104000 to 1094.The MEMBOC method that is used can derive the optimal solution efficiently and in five minutes, using a personal computer with a 3.0 GHz Dual-Core CPU.
Prototype system
This study develops a total quantity and sustainability management system (TQSMS) using Visual Basic, ArcView, and MS Excel software. Figure 6 shows the conceptual framework for the system. Input data for the TQSMS are obtained from the integrated GIS database that includes the required spatial and attribute data for the other subsystems. Users can easily modify the options and constraints to obtain various strategies that are illustrated in the GIS interface. Users can identify a set of options for pollution discharge and resource use reduction ratios for an industrial park, each group of manufactories in the park, and each individual manufactory. For generating the optimal strategy, sustainability assessment and total quantity management of pollution discharge and resource use are performed simultaneously.
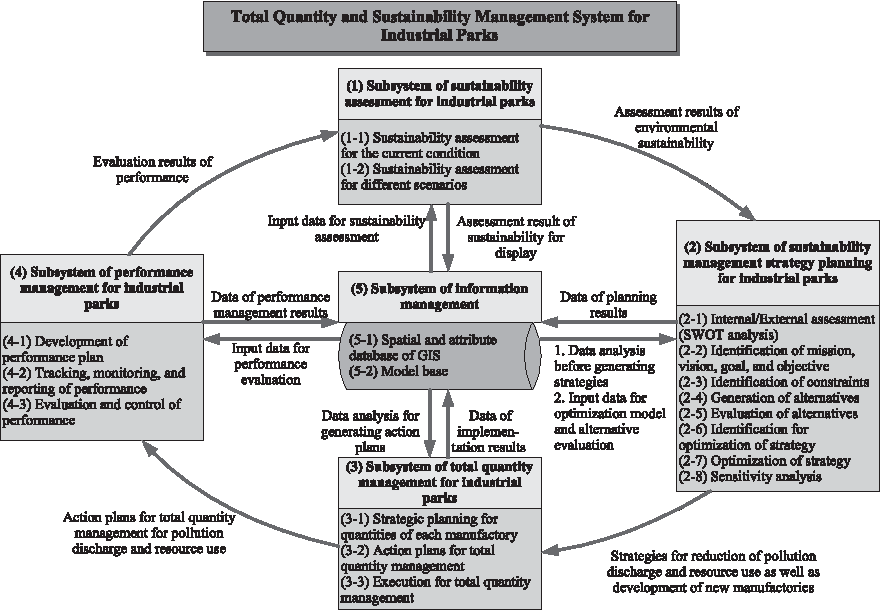
Conceptual framework of a total quantity and sustainability management system for industrial parks.
The TQSMS can derive a set of optimal strategies, including the optimal sustainability of an industrial park system; the optimal total quantities of pollution discharge and resource use of a park; the quantities of pollution discharge and resource use of each manufactory; the list of manufactories that should exchange quantities of pollution discharge and resource use; the list of manufactories that can provide additional quantities of pollution discharge and resource use; and the area of undeveloped land available for new manufactories. Furthermore, the TQSMS can assist the administrative organization in generating action plans and performance management plans for an industrial park.
Results and Discussion
Problem understanding, analysis, and identification of mission, vision, goal, and objective
Jhongli Industrial Park, located in Taoyuan County in northern Taiwan, was developed as a comprehensive industrial park in 1976. In this study, data concerning the park from 2005 to 2009 were collected. Table 1 lists the original quantities of pollution discharge and resource use. The results of the internal and external analysis of strengths, weaknesses/limitations, opportunities, and threats (SWOT analysis) are summarized in Table 2. The internal and external factors that are advantageous to the sustainable development of the park are identified as strengths and opportunities, respectively. The internal and external factors that are disadvantageous to sustainable development are identified as weaknesses and threats, respectively. This study identifies the mission, vision, goal, and objective for Jhongli Industrial Park according to the SWOT analysis. The results of the analysis reveal that the quantities of pollution discharge and resource use are enormous. To improve the internal and external factors that are weaknesses and threats to sustainable development, the total quantities of pollution discharge and resource use should be controlled to maintain acceptable environmental qualities and to ensure that available resource quantities suffice. A set of constraints should be set on total quantities for pollution discharge and resource use.
PM10, particulate matter; VOC, volatile organic compound; SOx, sulfur oxides; NOx, nitrogen oxides; BOD, biological oxygen demand; COD, chemical oxygen demand; SS, suspended solids.
Total optimal quantities of pollution discharge and resource use for Jhongli Industrial Park
The TQSMS was used to obtain the optimal quantities of pollution discharge and resource use for the park and each group of manufactories. The quantities and the ratios of optimal to original quantities of pollution discharge and resource use are listed in Table 3. The optimal strategy involves the allowable quantities and the reduction ratios of pollution discharge and resource use for each manufactory.
Table 4 lists the sustainability of both the original status and the optimal strategy obtained by the TQSMS. The sustainability of the original status is −12.1. There is a significantly negative value for the environmental aspect (−73.8), a positive value for the social aspect (22.3), and a positive value for the economic aspect (39.4). The assessment value of the environmental aspect is negative because, as noted previously, the quantities of pollution discharge and resource use are tremendous. The optimization process with automatic trade-offs yields an optimal sustainability of 14.2. Analytical results indicate that the economic aspect value decreases from 39.4 to 28.3 under the optimal strategy, while the environmental and social aspect values increase from −73.8 to −41.2 and from 22.3 to 27.1, respectively. To maximize sustainability, the park's quantities of pollution discharge and resource use are decreased to adequate values rather than least values.
Using the optimal strategy, the allowable ratio of undeveloped land area for new manufactories is 40%. To determine this ratio, the spatial analysis functions of GIS are used to analyze the distances between the undeveloped lands and the existing manufactories. For each piece of undeveloped land, the pollution quantity values for existing manufactories are divided by the distance, and the results are then added. A lower sum corresponds to a higher priority for the installation of new manufactories. Because the land with a higher priority is distant from large existing manufactories, the quantity of pollution discharge will not be concentrated around it. Figure 7 shows the undeveloped land in priority locations.
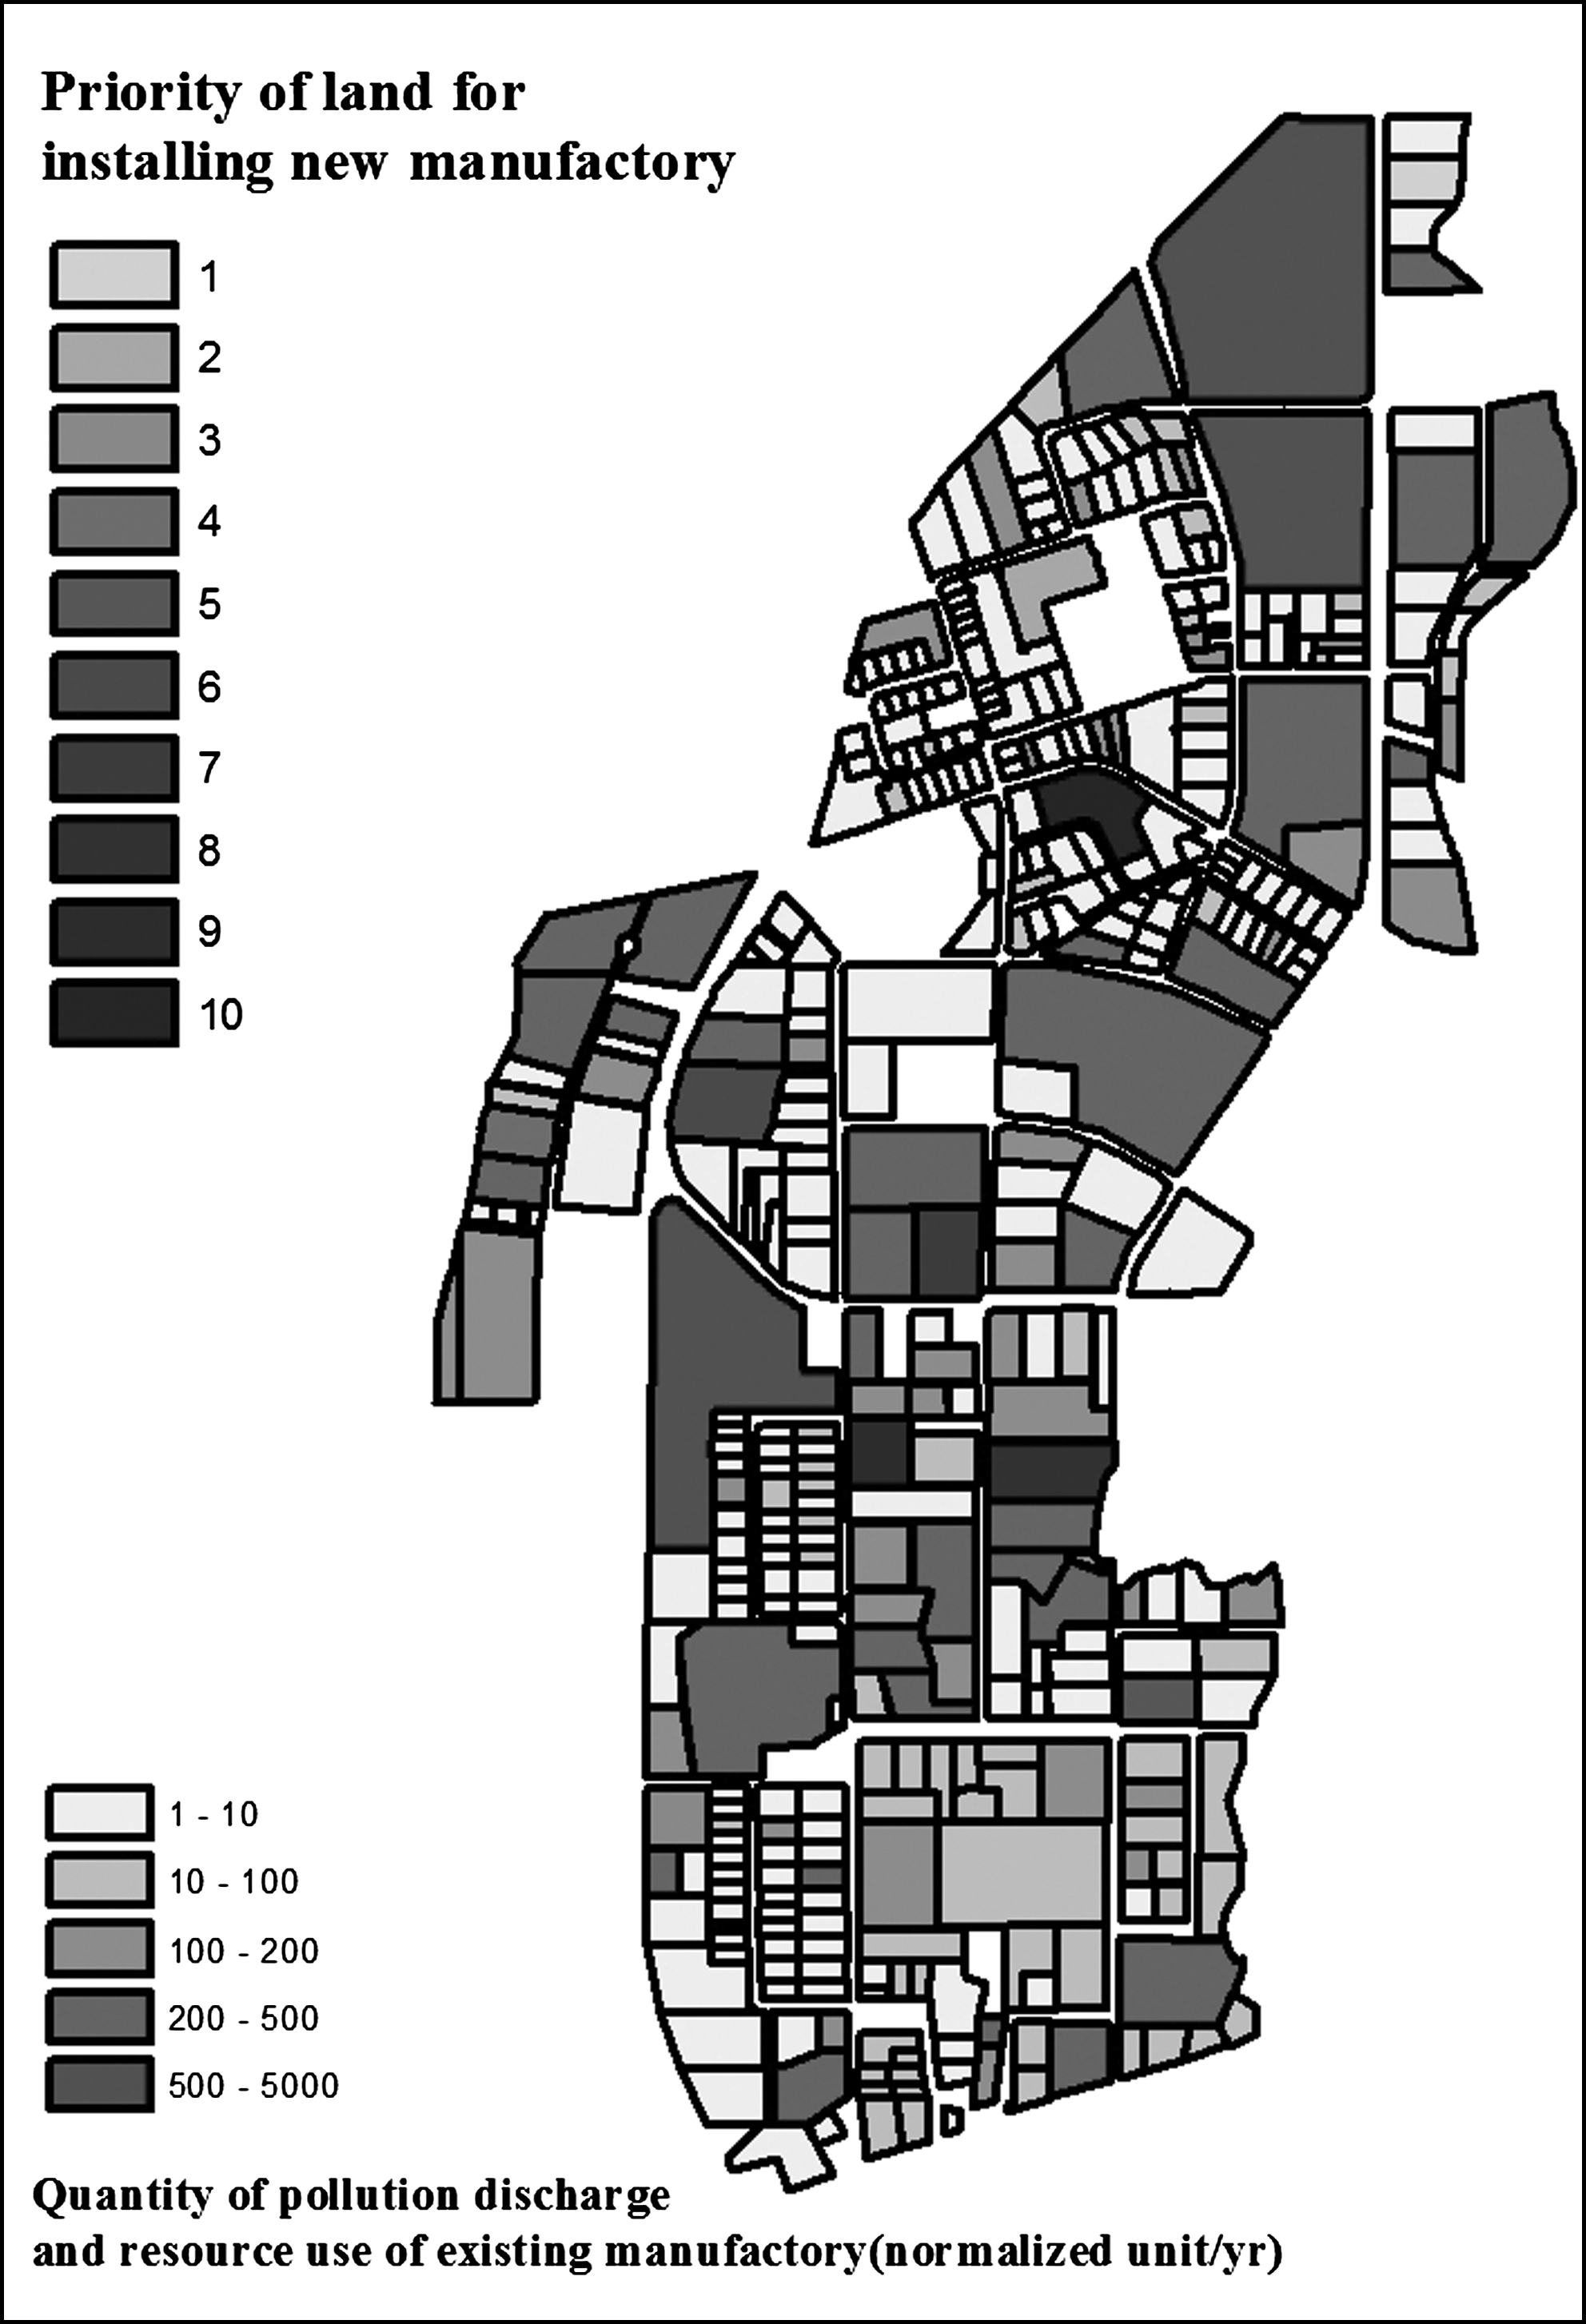
Jhongli Industrial Park undeveloped lands in priority locations for new manufactories.
Exchanging the quantities of pollution discharge and resource use among the manufactories
If a manufactory cannot meet the reduction ratio of the group to which it belongs, others in the same group should further reduce their resource use and pollution discharge to comply with the group's allowable quantities.When the optimal strategy for the park was produced, the TQSMS also produced a list of manufactories that potentially have large quantities of pollution discharge and resource use that can be traded to a manufactory that needs to decrease its discharge and resource use. Table 5 lists, for example, the surplus quantities of PM10 discharge for the manufactories under the optimal strategy.
The TQSMS also identifies the priority of existing manufactories to reduce the quantities of resource use and pollution discharge, for example VOCs, per unit area. Fig. 8 shows the priorities of the existing manufactories that can then be chosen to reduce their quantities of VOC discharge. Using this strategy, the discharge of VOCs is not concentrated around the existing high priority manufactories.
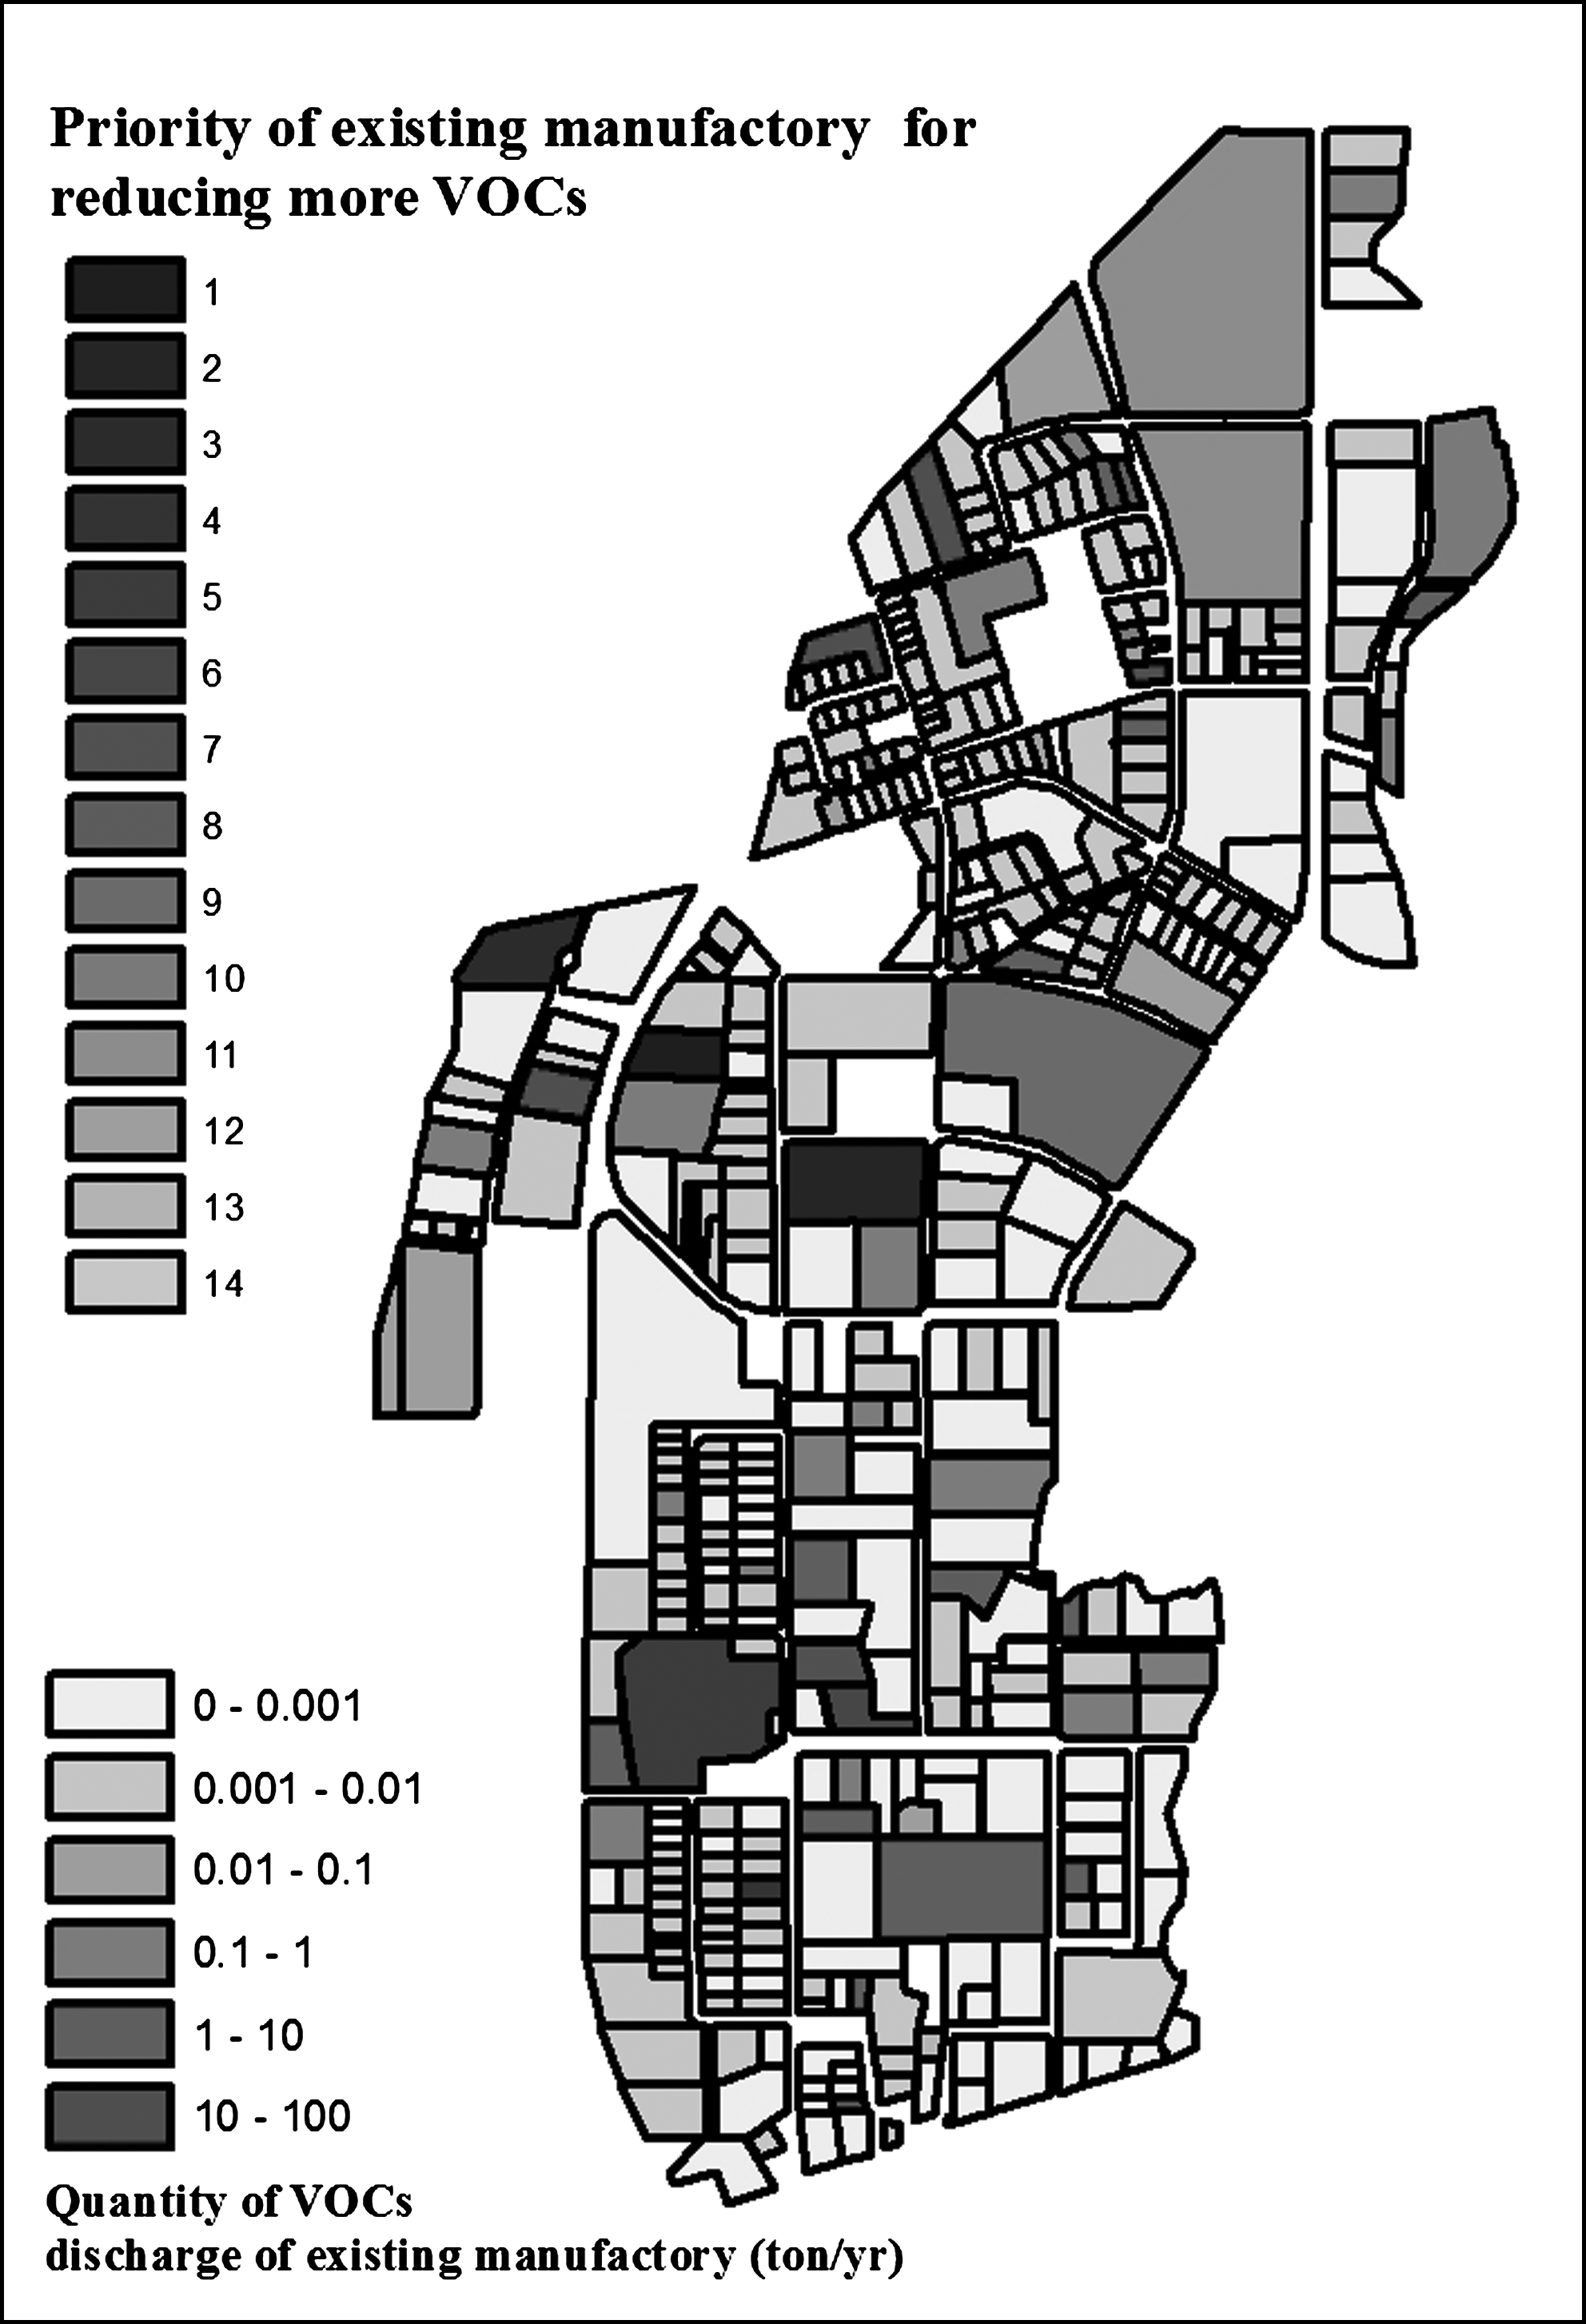
In priority order, existing manufactories that can be chosen to reduce the quantity of VOC discharge per unit area.
Model validation and sensitivity analysis
To determine the validity of the optimization model, data for the years of 2005–2009 were collected from the relevant governmental authorities and the administrative organization of the park. The data included the quantities of pollution discharge and resource use of each manufactory in the park, the monitoring data of the environmental quality around the park, and the supply and demand quantities of resources, as well as environmental factors and related social-economic factors. Next, the total quantities of pollution discharge were estimated, and the environmental qualities around the park were simulated. The data on environmental qualities around the park from 2005 to 2008 were compared with each other. The constants and coefficients of the DPSIR indicators of the quantities of pollution discharge were gradually verified until the simulation results were acceptable. Then, the confirmed constants, coefficients, and the quantities of pollution discharge were used to simulate the environmental quality around park. The 2009 data on environmental quality around the park were used to validate the model. The prediction errors were between −20% and 20%. This study used the mean absolute percentage error (MAPE) to evaluate the performance of model. A MAPE of 10% is considered very good, and a MAPE of 20% is considered good (Tsai et al., 2005; Lewis, 1982). The MAPE values for various assessment items of the Jhongli Industrial Park were less than 20%. Hence, the model's prediction error is acceptable. The results of the verification and validation for the proposed model are shown in Fig. 9.
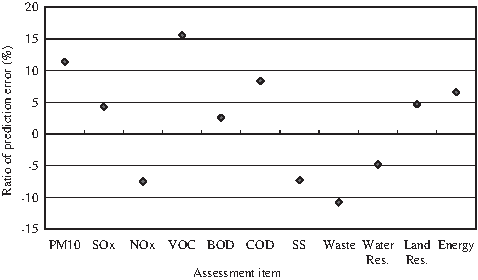
Verification and validation results for the proposed optimization model.
To understand the various influences on the sustainability values of the environmental, social, and economic aspects of the park, a sensitivity analysis was performed. In a sensitivity analysis, one constraint value is varied while the other constraint values are held constant. Then, a new optimal sustainability is obtained, using the TQSMS. The process is repeated until all environmental, social, and economic aspect constraints are analyzed. Figure 10 presents the results of the sensitivity analysis for various constraint values. As shown in the figure, the sustainability value of the environmental aspect decreases when the constraint value on the quantity of VOC discharge is relaxed and the other constraint values are held constant. When the control cost can be increased while the other constraint values are held constant, the sustainability value of the economic aspect decreases.
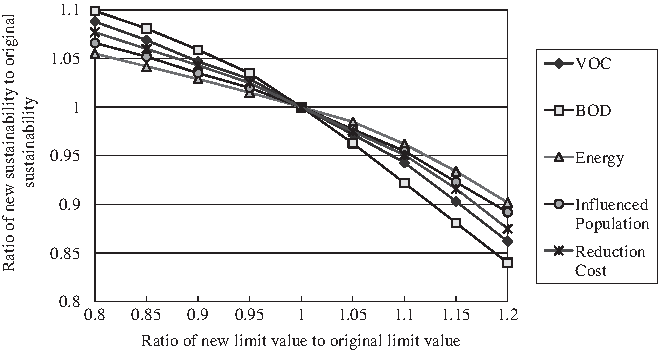
Sensitivity analysis results for various limit values of constraints.
Because the park's total quantities of pollution discharge and resource use are very high, when most of the constraint values of the environmental aspect are varied, the rate of decrease of sustainability exceeds the rates of decrease of social and economic constraints. Furthermore, the rate at which sustainability decreases as the constraint value on the quantity of BOD discharge increases is higher than the rate of decrease that accompanies an increase in the other constraint values. This is because BOD discharge exceeds the regulatory standard. Therefore the environmental aspect and BOD discharge should be considered to be more important for ensuring the sustainability of Jhongli Industrial Park than other aspects and their factors.
Summary
This work developed a novel methodology for simultaneously assessing sustainability and planning for total quantity and sustainability management of an industrial park. A management framework and an indicator system were developed, based on systems thinking, MFRs, a DPSIR framework, and system dynamics. The framework has triple decision layers that link the management of an industrial park and its manufactories. Based on this framework, the proposed indicators and their DPSIR relationships are integrated into an optimization model to maximize sustainability. A TQSMS was developed to maximize sustainability and the optimal total quantities of pollution discharge and resource use simultaneously. According to the results, the environmental, social, and economic aspects of an industrial park can be considered integrally to optimize management strategy.
The Jhongli Industrial Park in Taiwan was used as a case study to demonstrate the effectiveness of the proposed methodology and TQSMS. The optimal strategy for this park involved the quantities of pollution discharge and resource use of each group and manufactory. The quantities to be exchanged among the manufactories were calculated, and the capabilities of the manufactories to reduce pollution discharge and resource use were considered. The results of the sensitivity analysis revealed that the environmental aspect and the BOD discharge were the critical factors when trading environmental, social, and economic influences to get the optimal sustainability. The Jhongli Industrial Park case study demonstrates that the proposed methodology and TQSMS can assist administrative organizations in devising optimal or feasible strategies for managing an industrial park's total quantities of pollution discharge and resource use.
Footnotes
Acknowledgment
The authors would like to thank the National Science Council of the Republic of China, Taiwan, for supporting this research under Contract Nos. NSC-96-2621-Z-253-001, NSC-97-2621-M-253-001, and NSC 98-2221-E-152-003.
Author Disclosure Statement
No competing financial interests exist.