
Abstract
Abstract
An autonomous, wireless, in-situ sensor (AWISS) was demonstrated for the detection of Escherichia coli. A prototype battery-powered optical AWISS, consisting of a miniature spectrophotometer, monitored the changes in fluorescence intensity that occur when the E. coli–synthesized β-glucuronidase enzyme hydrolyzes the reagent's glycosidic bond, releasing fluorophores into solution. Laboratory testing with the prototype sensor showed the AWISS was capable of detecting low concentrations (<100 colony forming units [CFU]/100 mL) in less than eight hours. Higher concentrations (>5000 CFU/100 mL), indicative of a possible combined sewage discharge, could be detected in under one hour. A seven-day demonstration utilized the prototype sensor to sample and record the bacterial water quality of the St. Joseph River in South Bend, Indiana. Every six hours a new sample was drawn into a custom-designed stop-flow reaction chamber and injected with a soluble reagent. A wireless transmitter sent intensity data to a remote monitoring station. The deployment produced 19 individual sampling events, of which 15 were compared to culture methods approved by the U.S. Environmental Protection Agency (USEPA). Four samples were drawn in the middle of the night and not verified. Of the 15 verified samples, 13 correctly identified the presence or absence of an E. coli concentration defined as significant by the USEPA and Indiana Department of Environmental Management (IDEM) thresholds of 125 CFU/100 mL.
Introduction
To determine contamination, USEPA recommends the use of Escherichia coli as it is the organism most strongly correlated to the presence of dangerous fecal matter. However, the approved methods for detection require 24–48 hours of culturing prior to visually quantifying E. coli concentrations in the sample (APHA, 1995; USEPA, 1986, 2002; Hirschinger, 2002). Researchers have invested considerable effort into developing a method to enumerate E. coli and other bacteria (APHA, 1995; USEPA, 1986; Wolfbeis and Koller, 1983). Unfortunately, these methods are hindered variously by high limits of detection, extensive time and sampling preparation requirements, and a lack of species specificity. Furthermore, they are unable to rapidly react to changing conditions and/or do not perform well in complex water matrices, and often require a trained specialist to draw and/or analyze the sample.
Several studies have shown that E. coli concentrations in water bodies vary greatly from one day to the next, as well as with time of day, amount of sunlight, wave action, bird presence, wind speed, location, sampling depth, and other factors (Jamieson et al., 2004; Nevers and Whitman, 2005; Olyphant, 2005; Zimmerman, 2008). One additional factor for contamination is combined sewer overflow (CSO) events that occur following rainfall and result in untreated water being released into the environment. The St. Joseph River feeds an artificial waterway, often used by kayakers in South Bend, Indiana (South Bend Parks and Recreation, 2010), that has known CSO discharges that negatively impact the water quality of the artificial waterway (Ruggaber et al., 2007).
While current research efforts in contamination identification and the subsequent closure of recreational waters can minimize health and financial impacts, it is not always beneficial to close a beach 24 hours after fecal matter is identified. Often, the recreational population has already been exposed, and the water quality may have changed entirely by that point (Nevers and Whitman, 2005). Decisions based on the analysis of a single sample, enumerated 24 hours after collection, may not provide adequate protection for recreational water users.
In the case of fecal contamination, a cost-effective and rapid warning system, wirelessly transmitted to a central monitoring station, is more pertinent than a sample quantified 24 hours after exposure. Since current technology for automation for single cells is unlikely to provide a functional ideal device, the sensor described in this paper was designed to provide a potential best available technology. Finding the right balance of reliability, specificity, accuracy, durability, and ease of use is essential. The research presented here describes the development of an early warning sensor that can be economically deployed in a networked array across a recreational area. It offers a major improvement to water quality detection by standardizing and automating the collection and analysis of recreational water samples. The primary focus of this article describes a system developed for ease of use, ability to be deployed in-situ, and sensitivity. Systems on the market currently are priced from $40,000 to $100,000, which makes them cost-prohibitive in many high-risk areas (Dzenitis and Makarewicz, 2009; City of Asheville, 2010). The semiautonomous, ruggedized system reported by this research is a possible, cost-effective solution.
The sensor uses soluble a fluorophore-sugar substrate, to identify the presence of E. coli synthesized β-glucuronidase (GUS). The enzyme facilitates the hydrolysis of fluorescent substrate, releasing a fluorophore. As GUS activity correlates to the concentration of E. coli (Farnleitner et al., 2001; Wang and Touster, 1972), a relationship between sample fluorescence and initial E. coli concentration can be determined. Laboratory testing and a proof of concept field deployment are reported.
Experimental Protocol
Sensor construction and reagents
A sensor was constructed to achieve a balance in technology and usability. The main requirements considered in its design were autonomous operation, rugged durability, reliability, specificity, and sensitivity. Table 1 contains a list of the components utilized for the construction of the sensor shown in Fig. 1. Current estimates place the unit production costs at approximately $8,000.

AWISS prototype used during St. Joseph River deployment in South Bend, IN, shown here without larger enclosure for security and corresponding power supply. Left, actual image; right, diagram with numbered parts. See Table 1 for components.
Several fluorescent reagents are commercially available to bind with GUS. By far the most common is methylumbelliferyl-β-D-glucuronide (MUGlcU). However, its fluorophore is not only insoluble in neutral waters but also has a pKa of 7.8, meaning in natural waters (pH≈7.0), it will only partially disassociate into its highly fluorescent anion (Chilvers et al., 2001). The use of a water soluble glucuronidic fluorophore is significant, because it allows the use of an optical sensor in-situ. Therefore, carboxyumbelliferyl-β-D-glucuronide (CUGIcU), a carboxyl-based reagent that has a neutral pH soluble fluorophore and is more fluorescent at natural pHs, (Marker Gene Tech, Eugene, Oregon) was chosen for this demonstration. CUGlcU has been suggested as an acceptable alternative for E. coli detection (Geary, 2009; Geary et al., 2011).
Prototype development and laboratory testing
The fluorescent substrate was mixed with Milli-Q water and buffered with 100 mM phosphate buffer, adjusted to a pH of 6.9. A concentration of 250 μM provided a sufficient fluorescent signal upon hydrolysis without excessive use of reagent (Geary, 2009). One milliliter of reagent mixture containing the fluorescent substrate was added to each 4 mL sample to achieve a 250 μM concentration of CUGlcU.
Varying concentrations of wild strains of E. coli (obtained from raw influent into the South Bend Waste Water Treatment Plant (SBWWTP), were used to correlate increases in sample fluorescence to E. coli concentration. In laboratory testing, an E. coli concentration of 125 CFU/100 mL required 6.05 hours with a standard error of 9.1 min (N=6) to reach the 1:1 threshold (ratio between initial fluorescent intensity and current reading) (Geary et al., 2011). This demonstration analyzed the correlation between the timed reaching of the threshold ratio and E. coli levels above the USEPA recreational water limit of 125 CFU/100 mL (EPA, 1986). If the 1:1 threshold was not reached in eight hours, the E. coli concentration was determined to be below the designated maximum concentration (determined by a 95% confidence interval for measurements at 125 CFU/100 mL) (Geary, 2009). Intensity data were recorded every two minutes.
All E. coli concentrations were measured manually, independent of the sensor's assays, in triplicate, utilizing the USEPA approved culture method (Coliscan C MF, Microbiology Labs, Goshen, IN). Sample source waters were analyzed prior to and after each assay to ensure no significant concentration changes. Sample source waters used throughout the laboratory experiments were from Indiana and included influent collected from the SBWWTP, which was diluted with sterilized water from the St. Joseph River. Prior to and after sample introduction, the reactor and tubing were flushed for 30 seconds with sample water to completely remove any remaining fluorophores. After allowing the reactor to drain, a 4 mL sample was introduced along with 1 mL reagent, and the next assay was begun.
A simulated CSO event was introduced into the sensor over a period of 16 hours. Samples were diluted to a 1:4 water/wastewater ratio for simulated CSO water. Sensor reproducibility tests were conducted, utilizing four assays of the same sample maintained just above freezing. E. coli concentrations were measured at the beginning and end of each assay to track concentration changes. None were noted.
AWISS river deployment
For security during the river deployment, the prototype sensor, controlling microprocessor with visual interface, and batteries were placed in a metal box secured to pillars. The input tube was unfiltered and placed at a depth of approximately 0.3 m. Two 12 V batteries in series provided continuous operation for 2.4 days before requiring recharge. The AWISS was controlled by a Visual Basic. Data collected from the AWISS were saved to a networked location through a GSM internet connection. A virtual private network ensured data transmission security.
The St. Joseph River was chosen as the location for the sampling and deployment of the AWISS. As shown in Fig. 2, the river, which has an average flow of 135 m3/s, is a major waterway that serves southern Michigan as well as northern Indiana (United States Geological Survey, 2009). Typical river conditions include pH of 7.5, dissolved oxygen of 7.81 mg/L, and turbidity of 32 NTU (Kieser & Associates, 2009). Concurrent to the measurements collected from the AWISS, water samples were analyzed for turbidity, dissolved oxygen, temperature, nitrogen, phosphates, suspended solids, and pH to demonstrate the independence of the results from each variable.

Map of the St. Joseph River and the AWISS deployment point (St. Joseph River, downtown South Bend, IN). Adapted from Kieser & Associates (2009).
During the demonstration the sensor was located on a floating boardwalk platform for ease of monitoring. At the beginning of each assay, a 4 mL river sample was pumped directly into the reactor chamber from the river. The sample was mixed with 1 mL of buffered reagent, ensuring a final reagent concentration in the chamber of 250 μM. For E. coli enumeration, samples were collected at the beginning of each assay period and enumerated through triplicate analysis using Coliscan C MF.
Results
Laboratory testing and development
Prior to sensor deployment, controlled laboratory sensor runs were conducted to establish a quantification curve. Concentrations ranging from 68 CFU to 3000 CFU/100 mL of SBWWTP wild E. coli were measured as a function of time required to reach the algorithm threshold. Times of detection (i.e., the time to reach the 1:1 threshold at λ=365 nm) for USEPA recreational water E. coli levels were found to range from 5 to 8 hours while higher concentrations (i.e. those >5000 CFU/100 mL, as would be found in a CSO event), were detected in less than one hour. For example, samples of 2555 CFU/100 mL were assayed four times and had an average time of detection of 43.5 min and a standard deviation (STD) 5.06 min. As shown in Fig. 3, the decrease in time to detection can be correlated with a linear regression coefficient (R2) of 0.8104 (n=35).

Time to reach the sensor threshold of 1:1 for varying concentrations of wild type E. coli from the South Bend Waste Water Treatment Plant (determined by the number of colony-forming units [CFU] present in 100 mL of sample) in the laboratory based prototype AWISS (n=35).
The sensor was tested using low (1.00×10² CFU/100 ml), medium (2.55×10³ CFU/100 mL) and high (1.05×10⁴ CFU/100 mL) concentrations of SBWWTP wild E. coli. Times to detection for four similar assays were 230±15.1 min, 43.5±5.06 min, and 8.00±1.01 min for the low, medium, and high concentrations, respectively. Repeatability tests to determine sensor consistency were also conducted on simulated CSO waters (i.e., those >3000 CFU/100 mL), as shown in Fig. 4. Samples were pumped into the reactor, and the fluorescence intensity changes were measured over a four hour period. At the end of the assay period, the sensor released its analyzed sample, cycled through a flushing regimen, and introduced a new sample and fresh reagent. All samples registered positive for E. coli in less than 30 min with a mean of 28.8 min, and a STD of 2.28 min.
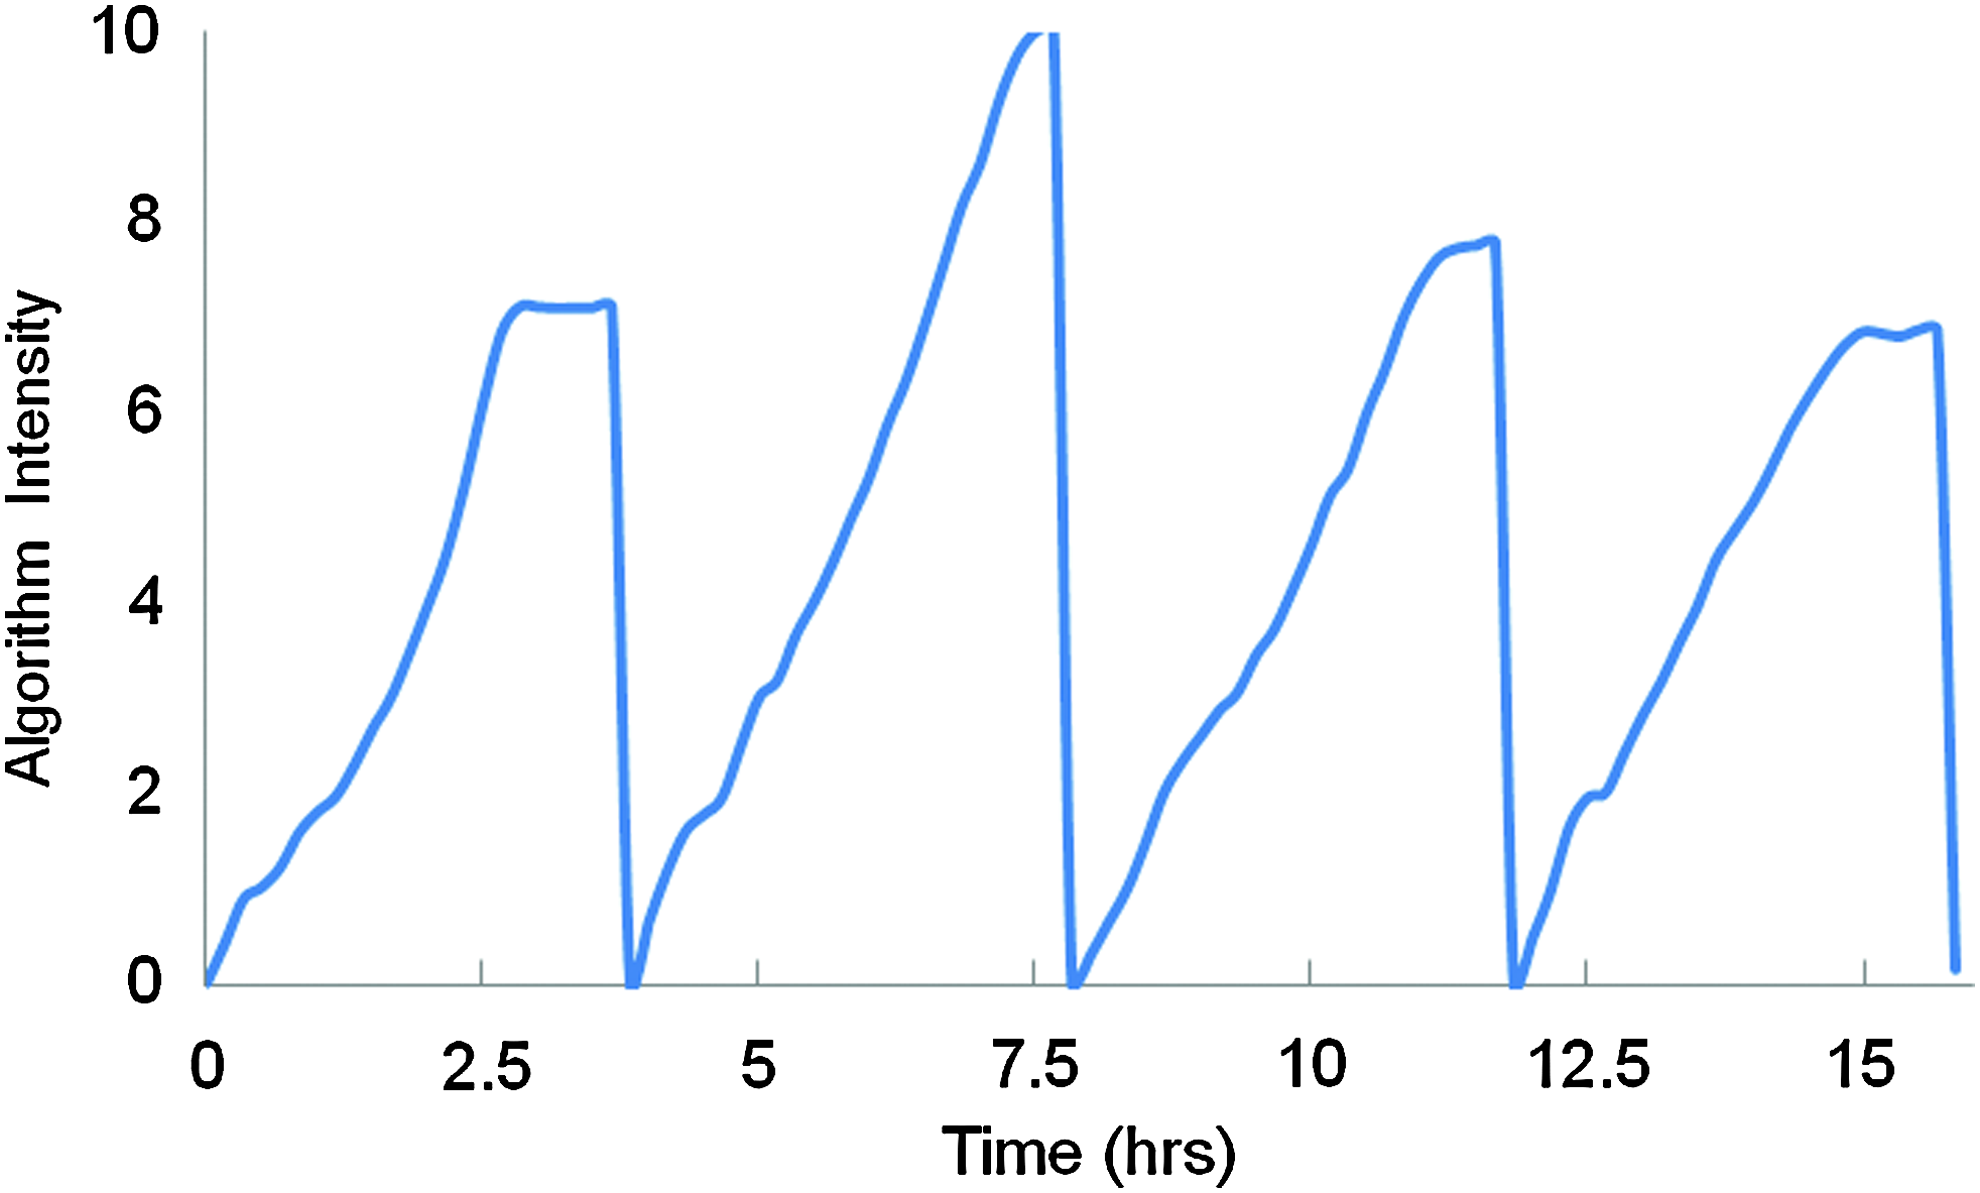
Simulated combined sewer overflow assays in the prototype AWISS sensor from a stock sample maintained on ice to minimize changes in E. coli concentrations, tested using the AWISS algorithm over the course of 15.5 hours with abbreviated assay time periods.
AWISS river deployment
After laboratory development and testing, the sensor was deployed on the St. Joseph River. As shown in Fig. 5, 19 samples, drawn every 6 hours, were evaluated by the sensor over the course of 6 days. Additionally, 15 of the 19 samples were enumerated using Coliscan C MF and tested to determine pH and turbidity. Thirteen of the 15 quantified samples corresponded to the culture-based methods, i.e. either above or below the USEPA recreational limit of 125 CFU/100 mL. The sensor had one false positive, defined as reaching the 1:1 threshold during the 6 hour assay, when the corresponding culture methods identified fewer than 125 CFU/100 mL (see Fig. 5, evening of Day 2). The sensor also registered one false negative, which was defined as the failure to reach the 1:1 threshold within the 6 hour assay when culture methods identified more than 125 CFU/100 mL (see Fig. 5, Day 4). The sensitivity of the sensor during deployment was 90%, the specificity was 80%, the false positive rate was 20%, and the false negative rate was 10% (Linn, 2004).
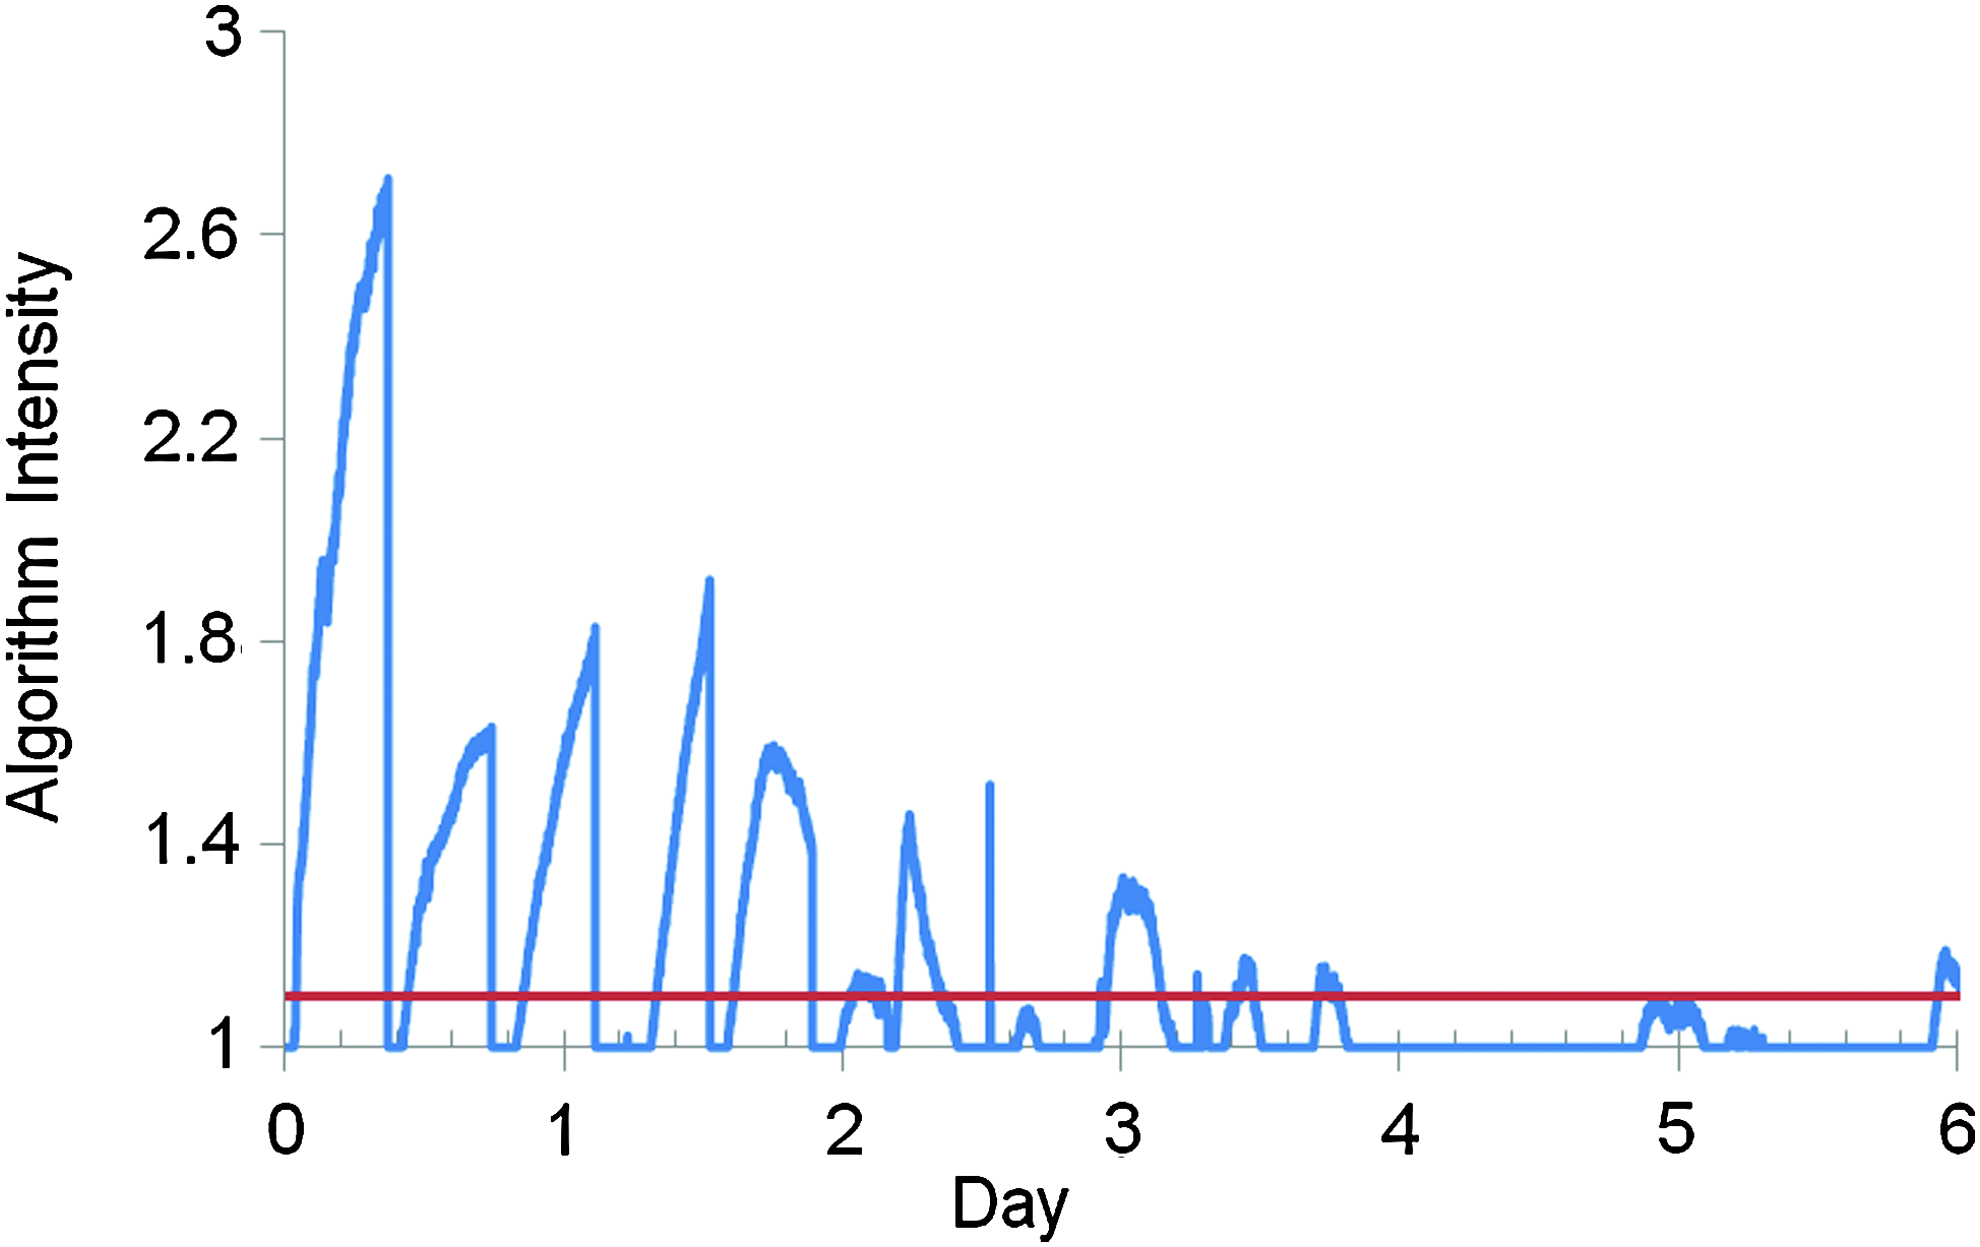
Algorithm processed output from the spectrometer during the course of the AWISS deployment in the St. Joseph River. Threshold is indicated, identifying which samples reported results over the EPA limit of 125 CFU/100 mL, as determined by the laboratory based observations. Assays above the 1.1 threshold indicate a positive for samples above the USEPA limit of 125 CFU/100 mL. Fifteen of the 19 assays were verified. Of these, a false positive occurred at the end of Day 2, and a false negative in the middle of Day 4. The remaining 13 assays corresponded to actual conditions.
Discussion
Sensor performance analysis
This relatively simple demonstration indicates that the AWISS prototype holds promise as a tool for rapidly detecting and alerting authorities to, the presence of E. coli in recreational waters. In assays containing E. coli concentrations that exceeded the USEPA recreational water standard (125 CFU/100 mL), the sensor correctly alerted in under six hours almost 90% of the time. Concentrations throughout the demonstration period did not exceed 1200 CFU/100 mL; however in bench tests conducted during the demonstration and in many previous experiments, a detectable fluorescent spike was evident in a matter of minutes when concentrations reached those expected in a CSO event. Even at lower concentrations, the results obtained from the AWISS are more timely and relevant than the current USEPA-approved culture methods. The false negative rate of the sensor (10%) needs to be improved to be considered a tool for municipalities, but the technology and algorithms associated with the sensor could be easily improved in the next generation. Further testing and refinement of the sensor should improve its sensitivity and specificity, resulting in fewer false positive and false negative rates.
Power requirements for the sensor configuration used throughout the St. Joseph River demonstration were very high. The two 12 V lead-acid batteries needed to be recharged every 57 hours (2.4 days). The heating of the sample cell, the microprocessor, data logger, the back-up data collection, as well as the aggressive data collection scheme, and visual interface utilized for sensor control, all contributed to the sizeable energy drain. Future prototypes configured for long-term deployment will not require a back-up data collection system or visual interface. The wireless transmission of data to a remote node was nearly constant as fluorescent intensities were sent every 20 seconds.
Experimental parameter analysis
Turbidity typically ranges from 20 Nephelometric Turbidity Units (NTU) in lakes and small streams to over 1000 NTU in large rivers (Davies-Colley et al., 2001). As the AWISS signal is based on changes in fluorescent intensity and not simply the total fluorescence, minor turbidity fluctuations have minimum effect on sensor performance. Turbidity during the sensor deployment ranged from 3 NTU to 22.1 NTU and appeared to have no impact on sensor performance. Furthermore, previous laboratory tests using wastewater influent samples (up to 200 NTU) showed no impact on sensor performance (Geary, 2009.). While there is an obvious turbidity threshold where an optical sensor is no longer viable, most recreational waters are relatively clear (single digit NTUs), and are unlikely to reach those thresholds.
Biomass growth within the optical cell is a concern and, in high nutrient waters, could necessitate the addition of a rinsing reagent. In this demonstration, the false positive occurred after an actual positive, suggesting memory effects. Memory effects occur when GUS or fluorophores are not fully flushed from the reactor chamber. It is also possible E. coli cells immobilized on the quartz chamber, tubes, or plastic fittings. Biofilm growth in the optical chamber, if left untreated, could also cause scattering and absorption of the fluorescent light.
The pH of the samples during this deployment varied slightly from 7.2 to 7.8, but had no observed impact on sensor performance. Variations in the pH are important as the fluorescent byproduct of the primary reaction, the GUS catalyzed hydrolysis of CUGlcU, has a pKa approximately 7.0 (Wolfbeis et al., 1983). However, as carboxyumbelliferone fluoresces strongly in both its protonated and deprotonated state, the signal is strong at pHs both above and below the pKa. Additionally, the AWISS reagent contains a phosphate buffer that stabilizes the pH, mitigating the impact of sample pH.
For this demonstration, the AWISS was configured to heat the sample cell to 44°C in order to selectively grow enteric organisms and reduce the possibility of a non-E. coli organism producing GUS. Although further investigation is necessary, culturing the sample may not be advantageous—especially when fast-time results are needed. Experiments during sensor development showed that, in low nutrient recreational water, E. coli cell populations decrease rapidly in the sensor's optical cell and GUS expression changes little over the course of a 6- to 12-hour assay (Geary, 2009.). This suggests activity detected in the initial 6 hours of sample introduction is the result of GUS already in solution rather than GUS produced through the course of the assay. In samples with low E. coli concentrations, time is needed to produce a sufficient number of cells capable of secreting enough GUS to provide a distinguishable signal. Single cell detection is theoretically possible with this technology, but the results will not be representative of current conditions. Therefore, the focus of the sensor was on shorter assays with detection limits near the USEPA regulatory requirements.
The relatively low cost and autonomous nature of the AWISS sensor facilitates its emplacement as part of a wireless sensor network. In this configuration, temporal and spatial microbial water quality data would be transmitted back to a central monitoring station, allowing regulators to identify and track possible fecal matter plumes. In addition, the relatively simple addition of pH, dissolved oxygen, or temperature sensors to the AWISS platform would provide data that would alert governments to other possible water quality issues.
Summary
The AWISS has demonstrated the ability to provide relevant notification of the presence of E. coli in recreational water. It is both rugged and relatively low cost compared to currently available systems and can operate in the field collecting and analyzing numerous samples autonomously. The AWISS utilizes widely accepted USEPA methods in a novel application that displays characteristics current practices cannot: reliability, accuracy, and timeliness in operation. As part of a wireless sensor network, this sensor could provide the ability to monitor fecal matter plumes and identify possible point discharge sources. Its ability to rapidly detect and report water contaminants enables city administrators to protect their citizens and orchestrate specific solutions, thus saving valuable resources. Future work will continue to test and upgrade the AWISS with the goal of reducing costs, lowering the limits of detection, and improving sensitivity and specificity.
Footnotes
Acknowledgements
We would like to acknowledge Tina Mitchell, Brent Bach, and Larry Wolfe from the University of Notre Dame (Notre Dame, IN) for their help in sensor construction and operation. We would like to thank EmNet LLC (South Bend, IN) for its assistance with programming; George Sharpson (County Fingal, Ireland) for his assistance with the field deployment in marine waters; the city of South Bend, Indiana, namely Gary Gilot and Patrick Henthorn, for assistance in the freshwater deployment described in this paper; and Matthew Sawtelle (Environmental Technology Solutions, Gilbert, AZ) for his assistance with the revisions to this manuscript.
We would also like to thank the Defense Advanced Research Products Agency (U.S. Department of Defense, Arlington, VA) for the CRANE Naval Surface Warfare Center grant (grant #N00164-07-C-8510).
Author Disclosure Statement
No competing financial interests exist.