
Abstract
Abstract
Biological scrubbers aim at reducing gaseous ammonia emissions by transferring it to a water phase followed by conversion to nitrite and nitrate. A small part of the removed nitrogen may be emitted as N2 and N2O produced as a result of denitrification processes. Due to the large greenhouse warming potential of N2O, even a small emission could be a point of concern. Determining these N losses in form of N2 and N2O via nitrogen balance is an alternative, but little is known about the uncertainty associated to this method. The main aim of this work was to develop an uncertainty model that evaluated N-balances in biological scrubbers in terms of result uncertainty. Secondary objectives were to provide a methodology to determine individual uncertainties involved, and to conduct a sensitivity analysis to identify the main contributors to the final uncertainty. For a defined scenario (biotrickling scrubber, 70% NH3 removal; 5% of inlet N-NH3 lost as N2 and N2O), the standard uncertainty expressed in relative terms of the average was 132% (released N in form of N2 and N2O). Main contributors to the final uncertainty were airflow rate and water volume in the scrubber basin. Uncertainty of the measurements of gaseous NH3 concentrations and N compounds in water had a reduced effect on the final uncertainty. Based on these results, N balances are not recommended to evaluate N2 and N2O formation in biological scrubbers, at least for the conditions considered in this work.
Introduction
Among the air treatment technologies available today, air scrubbing systems are the most widespread in livestock houses, mostly in Northern European countries. Air scrubbers are mainly aimed at reducing ammonia concentrations in the exhaust air from farms, but they have also demonstrated to be a powerful tool to reduce dust and odour emissions (Busca and Pistarino, 2003). Scrubbers can be classified in two main groups according to their working principle: chemical and biological scrubbers. In the first one, ammonia is trapped in an acid solution in the form of ammonium salts. In biological scrubbers (normally biotrickling scrubbers), ammonia is nitrified by bacteria (mainly Nitrosomonas and Nitrobacter species) to nitrites and nitrates (Weckhuysen et al., 1994).
Despite achieving higher removal rates for odour and PM than chemical scrubbers (Melse and Ogink, 2005), biological scrubbers may present inconveniences such as the possibility of N2O generation. During biological removal of ammonia in air, nitrification processes occur, as nitrites and nitrates are the main nitrogen species recovered in both trickling water and the packing material of the scrubber (Baquerizo et al., 2005; Chen et al.,2005; Ramírez et al., 2009). During these processes, N2O might be formed as a product of uncontrolled denitrification processes that can take place in the scrubber water (Trimborn, 2006). N-N2O formation rates of 3%–4% on the basis of the N-NH3 inlet were measured in a pilot biotrickling scrubber (Hahne and Brandes, 2002; Hahne and Vorlop, 2004). Hahne and Vorlop (2004) suggest that N2O formation starts after 100 days of scrubbing performance, with no water discharge or renewal. By contrast, in a full-scale biological scrubber placed in a pig house with weekly water renewal, the formation of N-N2O was on average 1.2% of the N-NH3 inlet (Aguilar et al., 2010).
Determining the amount of N2 or N2O that is being released from a biological scrubber is a challenging task. The most straightforward way to assess these emissions is by measuring gas concentrations before and after the scrubbing process (Hahne and Brandes, 2002; Hahne and Vorlop, 2004; Aguilar et al., 2010). These emissions can be also determined indirectly through a nitrogen balance considering all nitrogen forms in the system (Fig. 1). By measuring NH3 fluxes in the inlet and outlet air of the scrubber as well as the amount of nitrogen compounds trapped in the system (in the forms of total ammonia nitrogen (TAN),
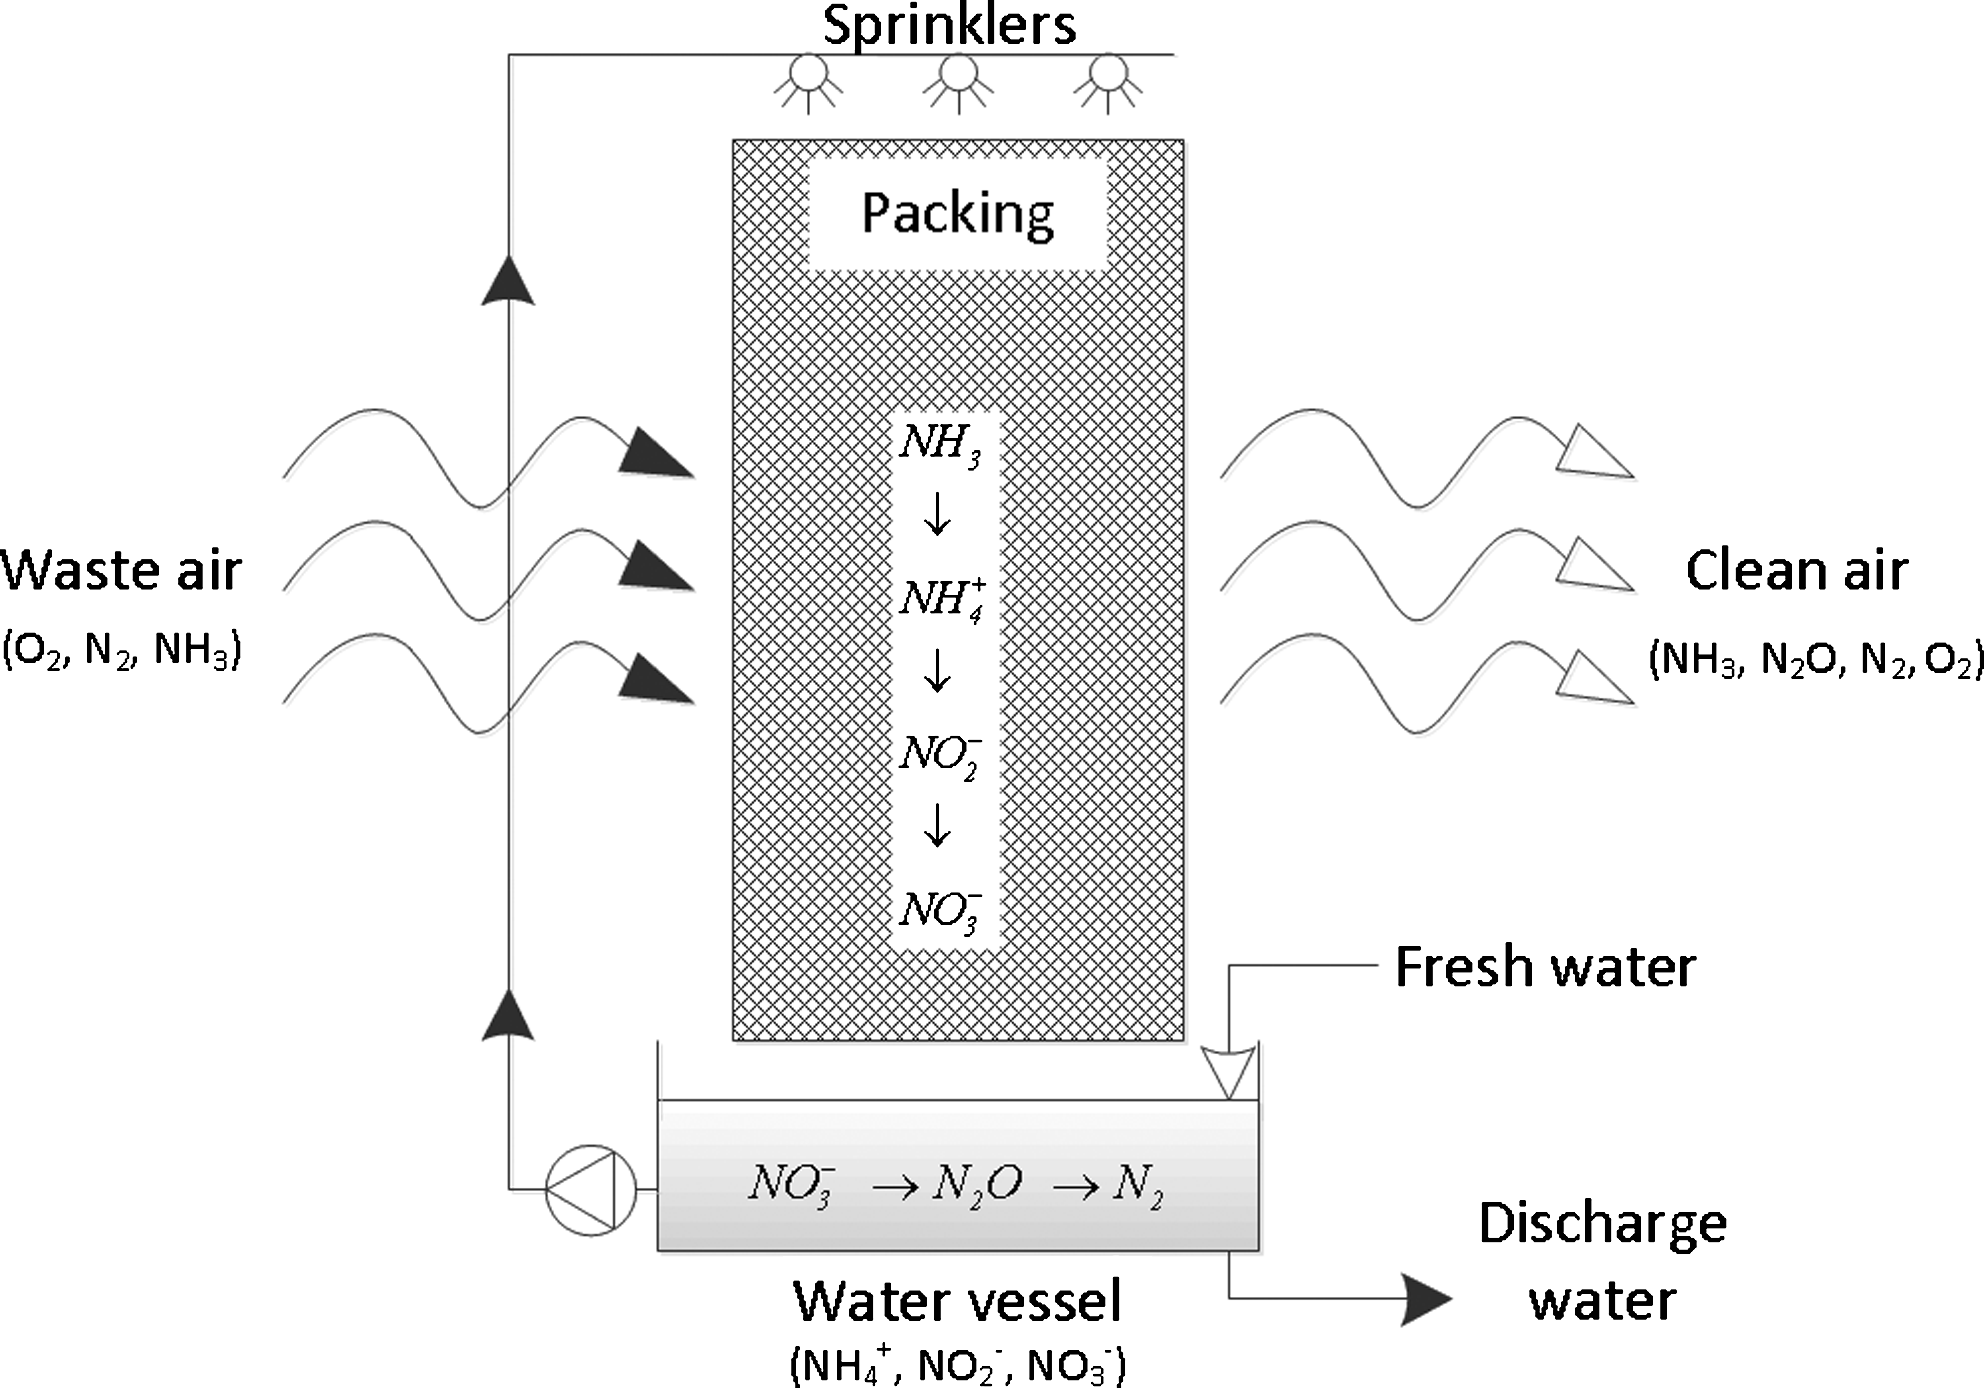
Ammonia removal in a biological scrubber.
The measurement of TAN, nitrite, nitrate, and organic nitrogen concentrations can be achieved with high accuracy. Ammonia concentrations in air can be determined with precisions below 1 ppb or 1% of reading using chemiluminiscence analysers (Ni and Heber, 2008). Nitrogen ions and organic nitrogen can also be determined in a water solution with accuracies from 1% to 3% of readings (APHA, 2005). Nevertheless, due to uncontrolled processes occurring in the system, such as the establishment of a pseudo-steady state originated by the accumulation of substrates and metabolites in the packing, developing nitrogen balances in biological scrubbers is difficult (Sakuma et al., 2008). In addition, measuring airflow rates and water volumes accurately to develop the balance needs to be done. It should also be considered that all errors committed during the balance development (including measurement, sampling, and modelling errors) are accumulated in the final result. In this sense, there is a need to investigate whether these N balances can be a tool for the determination of N2 and N2O in terms of the uncertainty of results.
The uncertainty is defined by the ISO (1995) as a parameter associated with the result of a measurement which characterizes the dispersion of the values that could reasonably be attributed to the measurand. In practice, to obtain the uncertainty of a measured value, it is needed to know the uncertainty of all single parameters involved in the measurement and the relationship between them and the final value (Cox and Harris, 2006). These individual uncertainties can be combined to obtain the measurand uncertainty using an uncertainty model (Sommer and Siebert, 2006). Sensitivity analysis is a tool complementary to the uncertainty analysis that allows determining the contributions of individual uncertainties in inputs to the uncertainty in results (Helton et al., 2006).
The main aim of this work was to evaluate, in terms of the uncertainty of the results, the use of nitrogen balances as a tool to determine N2 and N2O formation in biotrickling scrubbers. In this sense, the specific objectives of the work were as follows:
1. To develop an uncertainty model to propagate the uncertainty associated to this N balance 2. To provide a methodology to determine all individual uncertainties involved in the model 3. To apply a method to identify the parameters with large influence on the measurand uncertainty (sensitivity analysis)
Uncertainty Model and Sensitivity Analysis
Model definition
When using a nitrogen balance to determine the amount of N2 and N2O being formed in a biological scrubber, it is needed to determine the ammonia fluxes in the air as well as the amount of this ammonia recovered in water. Equation (1) describes this calculation:
where Nformed is the amount of N-N2 and N-N2O formed in the scrubber (g N), NH3_inlet is the incoming N-NH3 flow in the scrubber (g N), NH3_outlet is the amount of N-NH3 leaving the scrubber (g N), and Nrecovered is the nitrogen recovered in the system (g N). It is assumed in the model that no nitrogen compounds other than gaseous NH3, N2, and N2O are present in the outlet air.
To obtain the N-ammonia flux (NH3_i) in the air in a location i (inlet and outlet), it is needed to know both the N-ammonia concentration in the air and the airflow that is emitted during the considered period:
where F is the airflow rate (m3 h−1), t is the time basis of the balance (h), and [NH3] i is the N-ammonia concentration (g N m−3) at the location i.
The amount of nitrogen recovered in the system is composed of total dissolved concentrations of ammonia (TAN), nitrites, nitrates, and organic nitrogen, trapped in the water of the system (both re-circulated and discharged) and the packing material. It is assumed that no accumulation of nitrogen takes place in the packing. Therefore, the amount of nitrogen recovered in the system can be calculated following Equation (3):
where Vt and V0 are the volumes of water (m3) at the end and the start of the balance, respectively,
Individual uncertainties
All identified uncertainty sources for this model, classified according to their origin, can be found in Table 1. Once identified, they are characterized to be introduced in the model.
N(μ,σ) represents a normal distribution, where is μ the mean and σ is the standard deviation.
R(a,b) represents a uniform distribution, where a and b are upper and lower limits, respectively.
According to the ISO (1995), the knowledge about any quantity that influences the result of a measurement can be described by a probability density function (PDF). The PDF of the variables may be inferred from either repeated measurements or scientific judgement based on all available information about the quantity.
Thus, to assign a PDF to each variable (Table 1), general recommendations made by ISO (1995), JCGM (2008), and Cox and Harris (2006) were followed. When possible, PDFs were obtained from repeated measurements. If no experimental information was available, then the next rules were applied: If errors were expected to be normally distributed and very accurate information about the variable was available, then a Gaussian distribution N(μ,σ) was adopted. In those cases in which information was available only with regard to the lower (a) and upper limit (b), a rectangular distribution was used R(a,b), according to the principle of maximum entropy introduced by Jaynes (1957).
Correlations among parameters is not considered when measurement processes are independent among them (Sommer and Siebert, 2006; Payraudeau et al., 2007). This was the case considered in this work.
Uncertainty propagation
The propagation of individual uncertainties through the model can be achieved using two methods: the law of propagation of uncertainties and the propagation of distributions (IPCC, 2000). The numerical propagation of distributions, following Monte Carlo Methods (MCM), was chosen in this work, because of its versatility and the possibility of reducing calculation time when using computers (Cox and Harris, 2006).
Sensitivity analysis
In order to obtain the contribution of each parameter to the final uncertainty, two types of sensitivity analysis were evaluated. The approach used by Benke et al. (2008) was adapted to this aim. Since the variance of the measurand error distribution depends on the variances of each parameter error distribution, if a parameter PDF is replaced in the model by a constant value, then its effect on the final uncertainty is removed. This process was followed individually with all parameters involving uncertainty. Thus, starting with the full model, all parameters were held constant individually, and MCM simulations were run for each situation. The effect on the final uncertainty was then observed.
The second sensitivity analysis was performed in order to obtain the effect of the variation of individual uncertainties on the final standard uncertainty. To this aim, the individual uncertainty of each single parameter was modified from 0% to 200% (at 25% intervals) of the initial value by keeping the rest of the parameters unaltered. The effect on the measurand uncertainty was observed.
Modelling assumptions
To develop the uncertainty analysis, some assumptions were made related to the parameters and their individual uncertainties that were to be propagated through the model. A nitrogen balance was established for a biological scrubber installed in a pig farm with 5000 fatteners for a period of 24 h. The scrubber was formed by a counter current packed plastic bed, with a minimum empty bed residence time of 0.5 s and continuous water recirculation. The average efficiency on ammonia removal of the scrubber was 70% (Melse and Ogink, 2005). It was expected that around 95% of the retained N-ammonia was converted into TAN,
The average airflow rate in the building was established at 30 m3 h−1 per animal (which is in the range determined by Seedorf et al. (1998) for Northern European fatteners houses). The inlet ammonia-N concentration was considered to be 10 mg m−3 (Melse and Ogink, 2005). Water volumes in the vessel were automatically kept constant during the balance and equal to 1.5 m3. TAN, nitrite, and nitrate concentrations at the beginning of the experiment can be considered at 1000, 500, and 500 mg N L−1, respectively, which is also in the range proposed by Melse and Mol (2004).
NH3 concentrations in air were determined using a chemiluminiscence analyzer, with a precision of 1% of the reading (Ni and Heber, 2008). Airflow rates were measured using a fan-wheel anemometer installed in the farm exhaust. The precision of the system is 5% more than the measured value (Mosquera et al., 2005). The precision of the water vessel volume measurement can be considered fixed at 0.1 m3. The precision of the measurement method for nitrogen species in water can be established at 1% of reading for
To propagate the uncertainty, the software RiskAMP Monte Carlo Add-In Library version 2.7 for MS Excel (Structured Data, 2005) was used. The number of iterations used was M=105, which is the recommended value to obtain coverage intervals (Cox and Harris, 2006).
Results
Uncertainty propagation
The average value for N formed (related to the N-NH3 inflow) was 3.5% with an expanded uncertainty of [−6.11, 11.79]. Fig. 2 shows the PDF of the measurand. The PDF was approximately normal presenting a marked symmetry, which is in agreement with the Central Limit Theorem (ISO, 1995). The average value obtained (3.5%) agrees with the theoretical expectation. Nevertheless, the standard uncertainty (u) of this value (4.62% of N formed related to the N-NH3 inflow) was higher than the measurand average. This result implies that the formation of N-N2 and N-N2O as assumed at this level cannot be determined using the N balance method.

PDF of the N formed obtained with the uncertainty model, considering an average value of 3.5% [(N formed as %)/NH 3_inlet ] with standard uncertainty of 4.6%.
Sensitivity analysis
Regarding the influence of individual uncertainties over the measurand uncertainty, Table 2 summarizes the results of the first sensitivity analysis. It can be observed that the main contributor to the final uncertainty is the airflow measurement. The water volume measurement has also a clear effect on the final uncertainty. The rest of the parameters present minor (or null) effects on the final uncertainty.
The effect of modifying each individual uncertainty on the measurand standard uncertainty is shown in Fig. 3. Airflow rate and the water volume are the most sensitive parameters in the model. According to these results, reducing the uncertainty of these factors individually at 50% with regard to the initial value leads to a reduction of the measurand standard uncertainty of 22.4% and 16.1%, respectively. In general terms, the effect of reducing the uncertainty of the airflow rate reduces the measurand standard uncertainty by 15% more than reducing the uncertainty of the water volume. It should be also noticed that the measurand standard uncertainty cannot be reduced below 100% of the average value in any case for the model proposed here, which indicates that at least two of the parameters involved introduce a considerable amount of uncertainty in the final result.
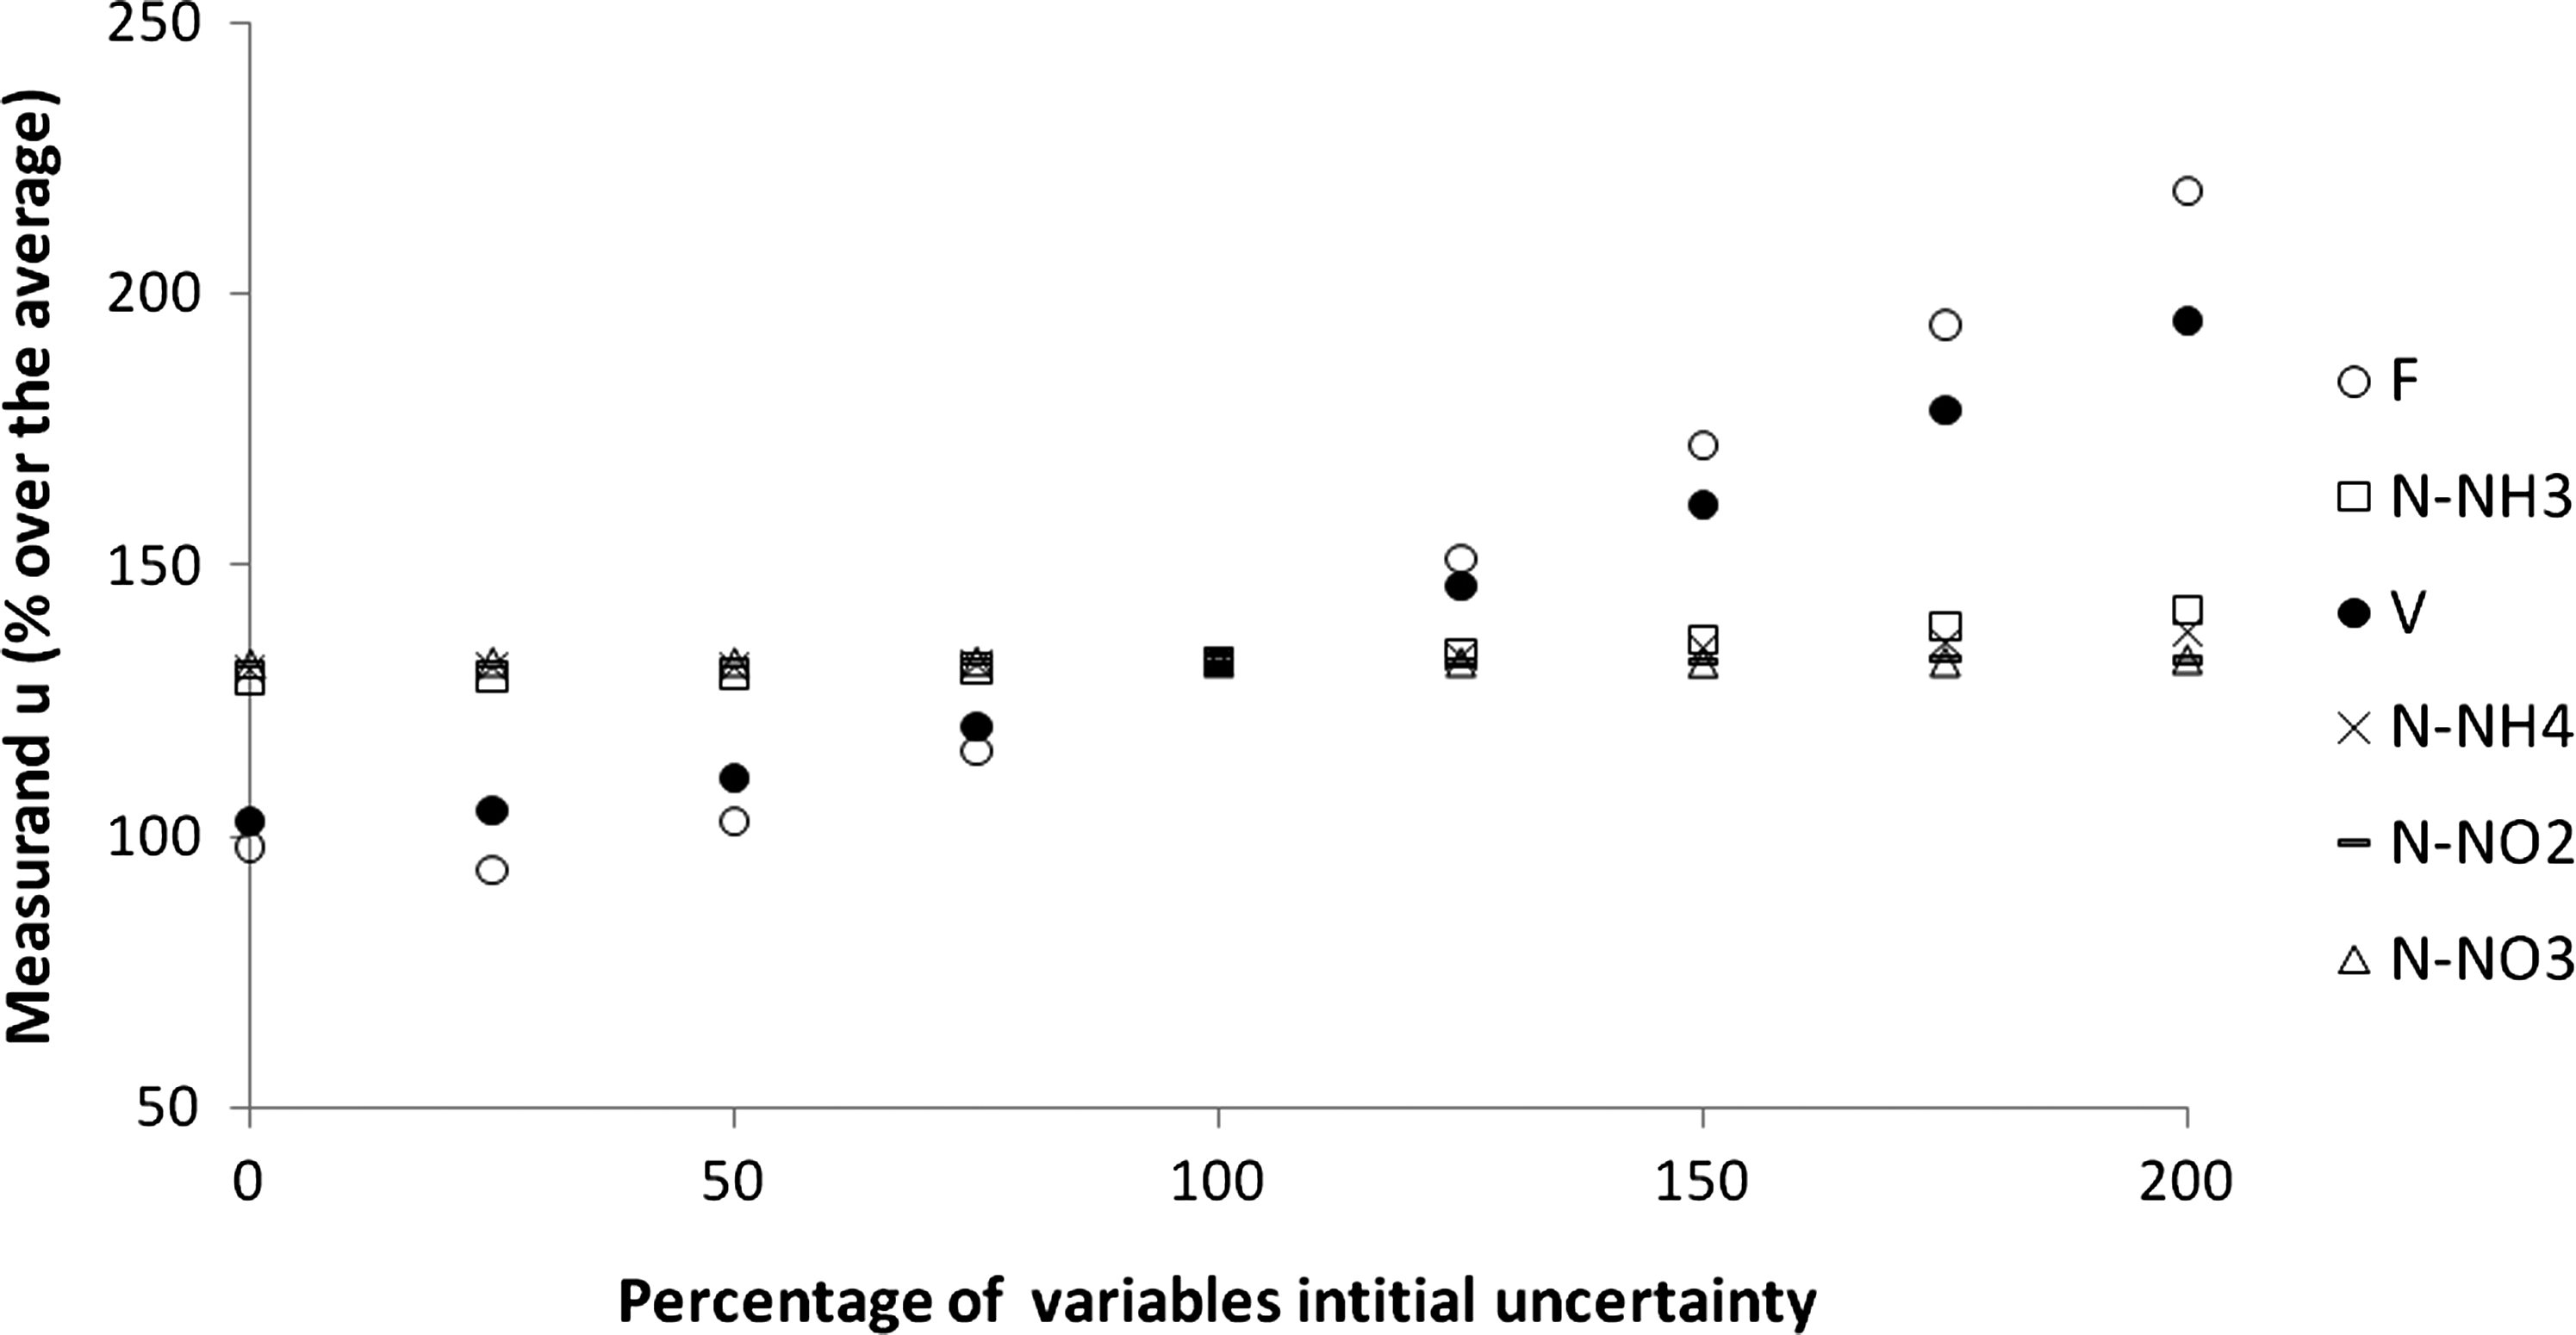
Influence of variables uncertainties variation (from 0% to 200%) on measurand uncertainty.
Discussion
Uncertainty models have demonstrated to be a useful tool in the field of environmental protection. These models had been successfully developed earlier to assess the uncertainties in pollutant emission inventories (IPCC, 2000), measurement of emissions to air (Romano et al., 2004), and Life Cycle Assessment (Payraudeau et al., 2007). The model developed in this work provides a methodological framework for uncertainty studies when evaluating scrubbers' performance. The methodology employed for the definition of individual uncertainties follows the ISO recommendations (ISO, 1995) and is similar to the one used in recent studies in the same field (Gates et al., 2009; Calvet et al., 2010).
The uncertainty model developed in this work aims at providing an insight into the uncertainty of nitrogen balances in biological scrubbers. The results derived from this model can be considered as a close approximation to the real processes, as the assumptions made in the case definition (e.g., ammonia concentrations, airflow rates, ions concentrations in water, etc.) are representative, and also the uncertainty of the variables is the result of a comprehensive bibliographic investigation. Nevertheless, caution should be applied, as the precision of measurements set in this work was chosen for a theoretical scenario. In practice, these individual uncertainties might be higher (e.g., improper sampling), which may lead to obtaining higher measurand uncertainties.
The relative standard uncertainty obtained for the measurand was higher than the measured value (over 132% on relative terms). According to these results, these N balances are able to demonstrate the formation of N2 and N2O at 95% probability, only if this amount exceeds 9.24% of the N-NH3 inlet (twice the standard uncertainty), which is not expected in practice in biological scrubbers (Hahne and Brandes, 2002; Hahne and Vorlop, 2004, Aguilar et al., 2010). In addition, it should be considered that this model does not include processes such as the formation of organic nitrogen, accumulation of nitrogen in the packing or water discharge, because they are not known in depth. These processes would introduce extra uncertainty in the model, increasing thus the uncertainty in the final result. Investigating these components would allow a better definition of the uncertainty model. According to the results obtained, in practical terms, it might be recommendable not to use nitrogen balances when evaluating N2O emissions from bioscrubbers.
The most influencing parameters in the model (in terms of uncertainty) are those related to the measurement of fluxes of both airflow and water volumes. Gates et al. (2009) also investigated the crucial effect of airflow measurements when determining gas emissions. It should be considered that this information is crucial to effectively improve the quality of the measurements and optimize measurement efforts for an expected measurement quality.
Finally, it was observed that reducing the uncertainty of airflow rate and water volumes measurements would lead to a significant reduction in the final uncertainty. Despite this, in practical terms, nowadays, it is difficult to reduce these uncertainties (mainly the uncertainty associated to the measurement of airflow rates) at levels allowing accurate determinations of the N formed .
Conclusions
In this study, an uncertainty model for the evaluation of nitrogen balances in biological scrubbers has been developed in order to evaluate the formation of N2 and N2O. In addition, a sensitivity analysis has been performed. The main conclusions that can be drawn from this model are as follows:
• The uncertainty of the determination of N2 and N2O formation in biological scrubbers using N balances is expected to be high; a relative standard uncertainty higher than the measured value was obtained in a defined case study representing average conditions. • The main contributors to this uncertainty are the uncertainties in the measurement of the airflow rates and water volumes.
According to these findings, it is concluded that the use of nitrogen balances for the determination of N2 and N2O formation in biological scrubbers is not recommended, at least for the emission magnitudes considered in this work. Therefore, to determine N2O emissions from biological scrubbers accurately, it is necessary to measure them directly, by monitoring airflow rates and N2O concentrations before and after the process.
Footnotes
Acknowledgments
The auhors would like to thank the Netherlands Ministry of Economic Affairs, Agriculture and Innovation, and the Netherlands Ministry of Infrastructure and the Environment, for financial support.
Author Disclosure Statement
No competing financial interests exist.