
Abstract
Abstract
In this study, a new method was proposed to systematically identify the local PM10 emission sources for priority regulation in urban air quality management through a coupled MM5-CAMx-PSAT modeling system. Parameters of emission source contribution ratio (ESCR) and normalized local ESCR were introduced to reflect the source contribution in terms of its total emission amount and per unit emission amount, and were used for identifying the emission sources for priority regulation. The proposed method was then applied to a case study in Beijing, China. Three scenarios were examined, including (a) analysis of only seven PM10 emission source categories for the entire Beijing; (b) analysis of just 13 emission districts in Beijing; and (c) comprehensive analysis of seven emission source categories in each emission district. The following emissions were identified for priority regulation: (a) stationary emissions from the urban center of Beijing and Fengtai districts; (b) industrial fugitive emissions from Chaoyang, Fengtai, and Shijingshan districts; (c) road dust emissions from the urban center of Beijing, Chaoyang, Fengtai, Shijingshan, and Haidian districts; (d) construction site dust emissions from the urban center of Beijing, Chaoyang, Fengtai, and Haidian districts; (e) bare land emissions from Chaoyang district; and (f) vehicle exhaust emissions from the urban center of Beijing, Chaoyang, Fengtai, and Haidian districts. Results indicated that the proposed method could be successfully implemented at different levels for different air quality management purposes.
Introduction
There have been various approaches to use models for evaluating emission source contribution to air quality. Particularly, with the recent development in air quality modeling, a technique called “particulate source apportionment technology” (PSAT) has been implemented in the CAMx model to provide source apportionment for primary and secondary particulate matter (PM) species according to emission source categories and their geographic locations (Koo et al., 2009). As compared with other methods, the PSAT technique holds a number of advantages, such as simulating nonlinear chemical reactions in the atmosphere, simultaneously predicting the air pollution contribution values of different emission sources, and reducing system errors. For example, Wagstrom and Pandis (2011) used PSAT to quantify the impacts of different source regions on fine PM concentrations in the Eastern United States, and illustrated that it was a computationally efficient approach to calculate long-range transport contributions to PM levels of source areas. Due to its advantages, CAMx with PSAT has been receiving interest for air quality management (Wagstrom et al., 2008; Huang et al., 2010). However, many of the previous works focused on only examining the interaction between the total emission amount of a source and the atmospheric pollutant concentration (Chen et al., 2008). It is possible that an emission source has a higher air pollution contribution in terms of its total emission amount but may have a lower contribution per unit emission amount, and vice versa. Consequently, the identification of atmospheric emission sources that have higher air pollution contributions in terms of both the total emission amount and per unit emission amount is of critical importance for air quality management, as the priority regulation of these sources could result in substantial environmental and cost effectiveness.
Air pollution in an urban region can be affected by both local and external emission sources, and the improvement of urban air quality needs coordinated efforts of reducing emissions within the urban region and its surrounding regions (Cheng et al., 2007b; Wang et al., 2010). When the air pollution contribution of local emissions is relatively large, then the emission curtailment within the urban region is of importance from the management perspective. In spite of the progress in emission source apportionment, there is still a lack of study to provide a methodology framework for identifying emission sources that need priority regulation. As an extension of our previous efforts (Cheng et al., 2007b; Huang et al., 2010), the objective of this study is to propose a method to identify PM10 emission sources within an urban region for priority regulation, based on a coupled MM5-CAMx-PSAT modeling system. The meteorological model MM5 was used to provide meteorological inputs of the CAMx air quality model, whereas PSAT was applied to examine the urban atmospheric PM10 concentration contributions of various PM10 emission sources. The proposed method was then applied to a case study in Beijing, China.
Methodology
Emission source contribution ratio
The coupled MM5-CAMx-PSAT modeling system was used for investigating the relationship between the urban atmospheric PM10 concentration and the emission amounts from different primary PM10 sources within an urban region and its surrounding regions. More detailed descriptions of this modeling system and PSAT technique can be found in Environ (2006), Koo et al. (2009), and Huang et al. (2010). The contribution to urban atmospheric PM10 concentration from a certain emission source is characterized through calculating the emission source contribution ratio (ESCR) as defined next:
where Vi denotes the simulated contribution value (μg/m3) to the urban atmospheric PM10 concentration from primary PM10 emission source i in terms of its total emission amount (
where m is the total number of local emission sources within a study region. The value of TLESCR may not be equal to 100% due to the impact of external emissions from the surrounding regions. For the convenience of urban air quality management, it sometimes needs to identify the main local emission sources by assuming that the total contribution ratio of all local emission sources is 100%. For example, the management may be “if the total contribution ratio of some local emission sources is greater than the target value of α (i.e., 80%), then these sources will be identified as the main contributors.” However, the target value of α needs to be converted to a number by considering the air pollution contributions from both local and external emission sources. In this study, a parameter called “reference value of total ESCR” (RTESCR) and a parameter called “cumulative local ESCR” (CLESCR) were introduced and are defined next:
The ESCR values of different local emission sources were first ranked in descending order, and the first p number (
where ER
j
is the emission ratio of local source j in an urban region (
Identification of local emission sources for priority regulation
Figure 1 presents the procedures to identify the local PM10 emission sources for priority regulation in a study region. Based on the obtained ESCR values by using the PSAT technique implemented in CAMx, the TLESCR and RTESCR values were first calculated by using Eqs. (2) and (3). A target value of α in Eq. (3) was arbitrarily selected as 80% in this study. The NLESCR values of different local PM10 emission sources within the study region were obtained by using Eq. (5). The ESCR values of all of the local PM10 emission sources were then ranked in descending order, and the CLESCR values were calculated by using Eq. (4). The PM10 emission sources that have a CLESCR value greater than the RTESCR value were identified as the main local contributors in the study region. On the other hand, the NLESCR values of different local emission sources were compared with the TLESCR value to screen the source with higher cost effectiveness for air quality management (i.e., NLESCR>TLESCR). If the screened source is within the main contributor source list, then it is identified as the local emission source for priority regulation.
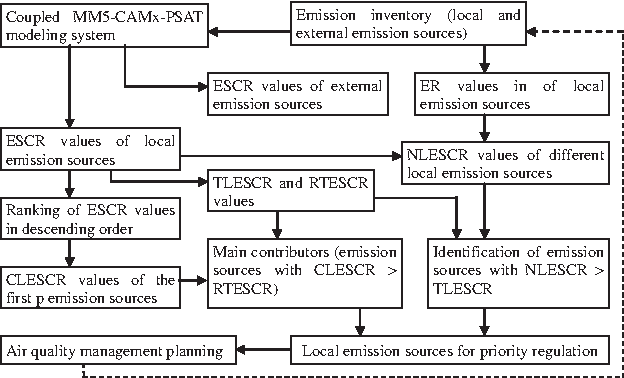
Schematic diagram of identifying local emission sources for priority regulation. ESCR, emission source contribution ratio; CLESCR, cumulative local ESCR; ER, emission ratio; NLESCR, normalized local ESCR; TLESCR, total local ESCR.
The identification of emission sources as just described would provide a sound basis for developing an effective air quality management plan. The following principles of emission regulation were suggested in this study: (a) the main contributor emission sources with a higher NLESCR value than the TLESCR value should be controlled with first priority, as they significantly contribute to the urban air pollution, and it is also assumed that a higher cost effectiveness of air quality improvement would be achieved through only curtailing the emission amount with a smaller extent; (b) other nonmain contributor emission sources with a higher NLESCR value than TLESCR value should be controlled with second priority; (c) other main contributor sources but with lower NLESCR values than the TLESCR value should be controlled with third priority; and (d) for further air quality improvement, a new air quality management plan should be developed by conducting new simulation based on the new emission inventory as indicated by the dotted line shown in Fig. 1. It should be pointed out here that the proposed screening of emission sources for second and third priority regulation is arbitrary, and it should require a detailed analysis of emission reduction cost and other relevant factors (i.e., air quality control objectives) for the application to different air pollution control situations. Different emission sources can be associated with different emission reduction costs, and there is no direct or clear relationship between emission reduction cost and the ESCR or NLESCR values. Generally, when the air quality standard is not very tough, then the nonmain contributor emission source with a higher NLESCR value may need to be controlled with a higher priority than the main contributor source with a lower NLESCR value, and when the air quality standard is tough, then the main contributor source with a lower NLESCR value may need to be regulated with higher priority than the nonmain contributor source with a higher NLESCR value.
Case Study in Beijing, China
The MM5-CAMx-PSAT modeling system was applied to a case study in Beijing, China. The overview of the Beijing metropolitan region can be found in Cheng et al. (2007a, 2007b) and Huang et al. (2010). For modeling purpose, the emission inventories of Beijing and its surrounding regions were obtained. Table 1 lists the PM10 emission amounts from different sources within Beijing in 2002, whereas all the local emission sources were grouped into seven categories, including road dust emission, stationary emission, construction site dust emission, industrial fugitive emission, vehicle exhaust emission, residential energy consumption emission, and bare land emission. The modeling domains with three nesting levels were shown in Fig. 2. The detailed descriptions of modeling set up, input data, and emission inventory processing can be found in Huang et al. (2010). The detailed results of modeling performance evaluation and the simulated hourly PM10 concentrations in Beijing in November 2002 due to local and external PM10 emission sources can also be found in Huang et al. (2010). Those results were used in this study to calculate the monthly ESCR values of the local emission sources in November 2002. Three scenarios were designed, including (a) analysis of the seven local PM10 emission source categories; (b) analysis of 13 emission districts in Beijing as shown in Fig. 2, including the urban center of Beijing (Dongcheng, Xicheng, Chongwen, and Xuanwu districts), Chaoyang, Fengtai, Shijingshan, Haidian, Mentougou, Fangshan, Tongzhou, Shunyi, Changping, Daxin, Huairou and Yanqin, Pingu and Miyun districts; and (c) a comprehensive analysis of both emission districts and local emission source categories.
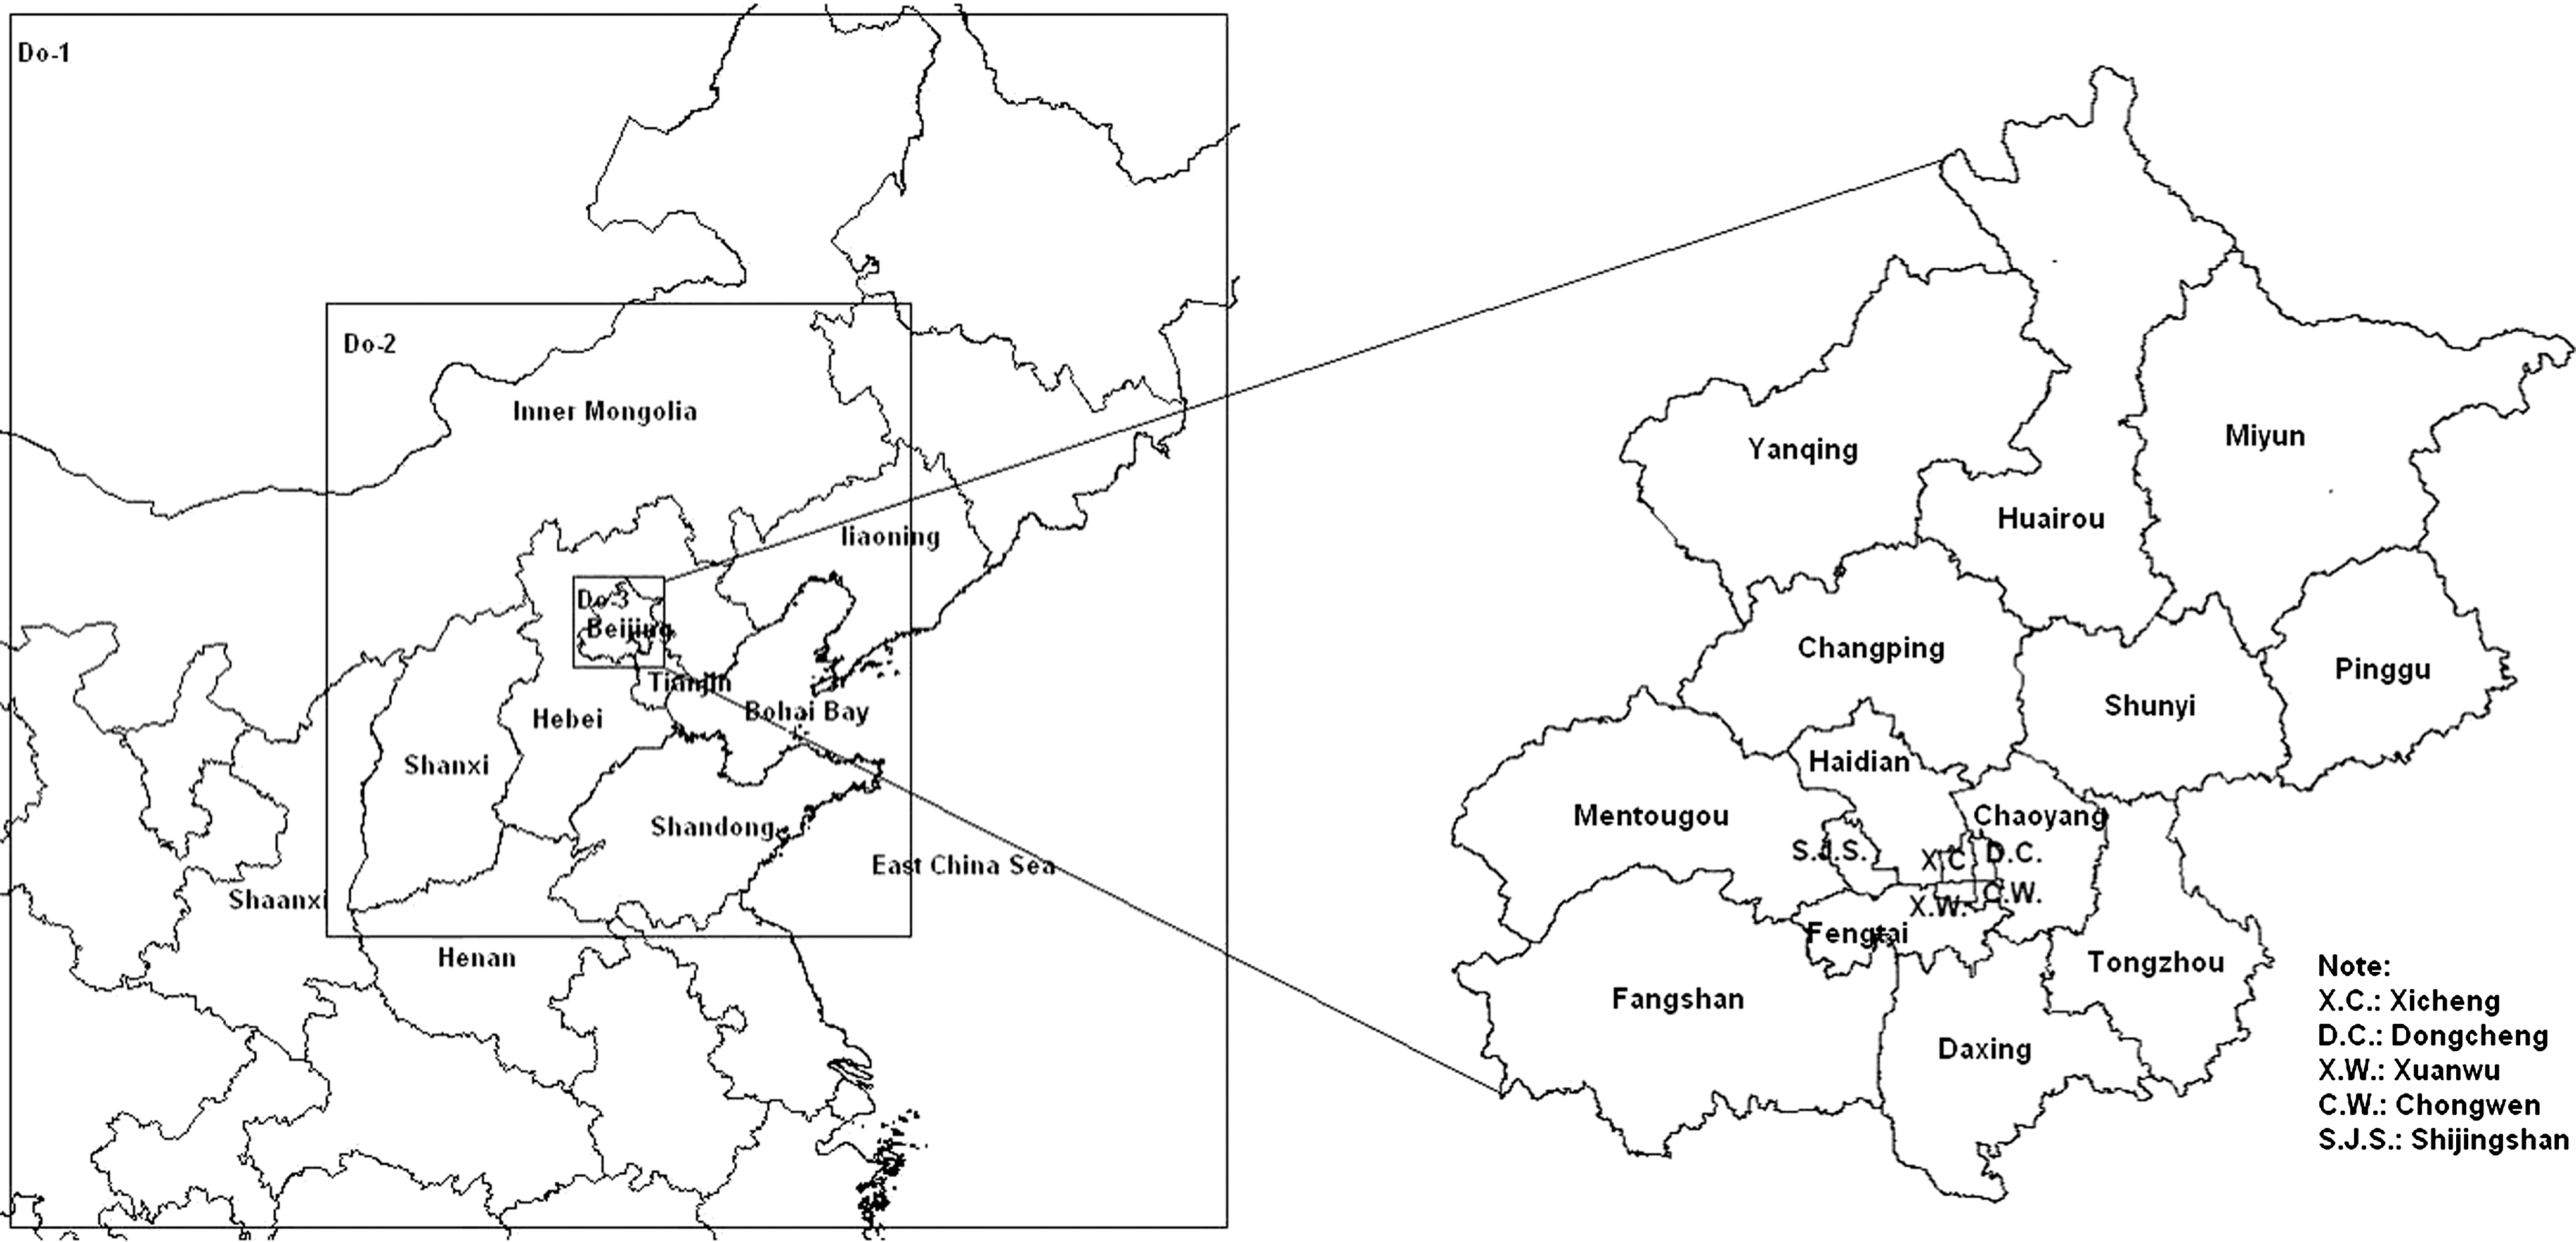
Three-level nested modeling domain for Beijing and its surrounding provinces.
Results and Discussions
Analysis of emission source categories
Figure 3 presents the calculated monthly ESCR, CLESCR, and NLESCR values in November 2002 for seven different local PM10 emission categories in Beijing, and their ER values are also presented. The ESCR values were ranked in descending order as follows: road dust emission (18.11%), stationary emission (17.43%), construction site dust emission (12.45%), industrial fugitive emission (11.60%), vehicle exhaust emission (6.90%), residential energy consumption emission (3.15%), and bare land emission (2.63%). The TLESCR value within Beijing was then calculated as 72.27% (i.e., TLESCR=72.27%), whereas the remaining ESCR of 27.73% was due to the external emissions from Beijing's surrounding provinces (Huang et al., 2010). The RTESCR value was then obtained as 57.82% by using Eq. (3) (80%×72.27%). It was found that the CLESCR value of local road dust emission, stationary emission, construction site dust emission, and industrial fugitive emission source was 59.59%, which was greater than the RTESCR value of 57.82%; thus, these four categories of PM10 emission sources were identified as the main local contributor sources in Beijing.
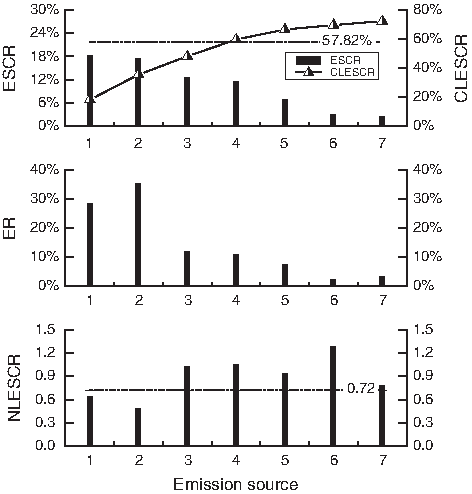
Calculated values of ESCR, CLESCR, ER and NLESCR of different local PM10 emission sources in Beijing (1, road dust; 2, stationary, 3, construction site dust; 4, industrial fugitive; 5, vehicle exhaust; 6, residential energy consumption; 7, bare land).
On the other hand, the NLESCR values were calculated as 0.64 for road dust emission, 0.49 for stationary emission, 1.03 for construction site dust emission, 1.05 for industrial fugitive emission, 0.93 for vehicle exhaust emission, 1.29 for residential energy consumption emission, and 0.78 for bare land emission, respectively, as shown in Fig. 3. Consequently, five local PM10 emission sources had higher NLESCR values than the TLESCR value of 72.27% or 0.72, including construction site dust emission, industrial fugitive emission, vehicle exhaust emission, residential energy consumption emission, and bare land emission. The emission reduction of these five local PM10 sources was then assumed to have higher cost effectiveness of air quality management. Since the industrial fugitive emission and construction site dust emission sources were in the list of main contributors, these two sources were then indentified as the local PM10 emission sources for priority regulation in Beijing. When developing an air quality management plan, these two emission sources should be controlled with first priority.
Analysis of emission districts
Figure 4 presents the calculated ESCR, CLESCR, NLESCR, and ER values of the 13 emission districts. Similar to the analysis just mentioned, the emission districts with CLESCR≥RTESCR (57.82%) when ranking their ESCR values in descending order were screened as the main contributor emission districts. It was, thus, found that the urban center of Beijing, Chaoyang, Shijingshan, Fengtai, and Haidian were the main PM10 emission contributor districts with a CLESCR value of 62.35%. It was also found that five districts had higher NLESCR values than the TLESCR value of 0.72, including the urban center of Beijing, Fengtai, Haidian, Chaoyang, and Shijingshan districts. All these five districts were in the list of main emission contributor districts; thus, they were identified as the PM10 emission districts for priority regulation, and the regulation of PM10 emissions from these five districts should be the first priority of air quality management in Beijing.
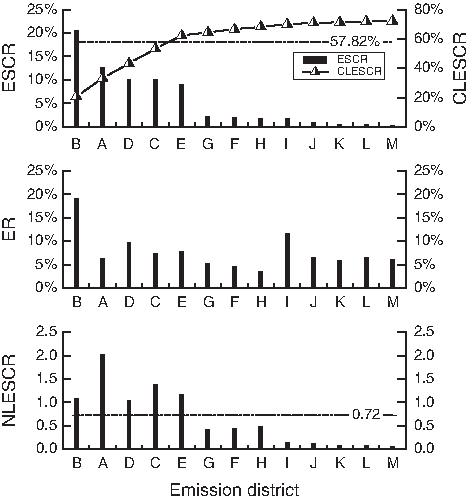
Calculated ESCR, CLESCR, ER, and NLESCR values of different PM10 emission districts in Beijing (A, urban center of Beijing; B, Chaoyang; C, Fengtai; D, Shijingshan; E, Haidian; F, Shunyi; G, Changping; H, Mentougou; I, Fangshan; J, Tongzhou; K, Daxing; L, Huairou and Yanqing; M, Pinggu and Miyun).
Analysis of both emission districts and emission source categories
Figure 5 presents the calculated values of ESCR, CLESCR, ER, and NLESCR for each PM10 emission source within each district in Beijing. The ESCR values were ranked in descending order, and it was found that the following emission sources within the following districts had a CLESCR value of 57.99%, which is just greater than the RTESCR value of 57.82%, including (a) stationary emissions from the urban center of Beijing (1.54% for 2A), Chaoyang (4.67% for 2B), Fengtai (4.16% for 2C), Shijingshan (3.12% for 2D), and Haidian (1.02% for 2E); (b) industrial fugitive emissions from Chaoyang (4.67% for 4B), Fengtai (1.55% for 4C), and Shijingshan (3.95% for 4D); (c) road dust emissions from the urban center of Beijing (4.41% for 1A), Chaoyang (5.08% for 1B), Fengtai (1.66% for 1C), Shijingshan (1.28% for 1D), and Haidian (2.89% for 1E); (d) construction site dust emissions from the urban center of Beijing (3.98% for 3A), Chaoyang (2.79% for 3B), Fengtai (1.02% for 3C), and Haidian 2.96% for 3E); (e) bare land emissions from Chaoyang (1.23% for 7B); and (f) vehicle exhaust emissions from the urban center of Beijing (1.88% for 5A), Chaoyang (1.54% for 5B), Fengtai (1.30% for 5C), and Haidian (1.29% for 5E). Consequently, these emission sources within the districts just mentioned were identified as the main PM10 contributor sources in Beijing.
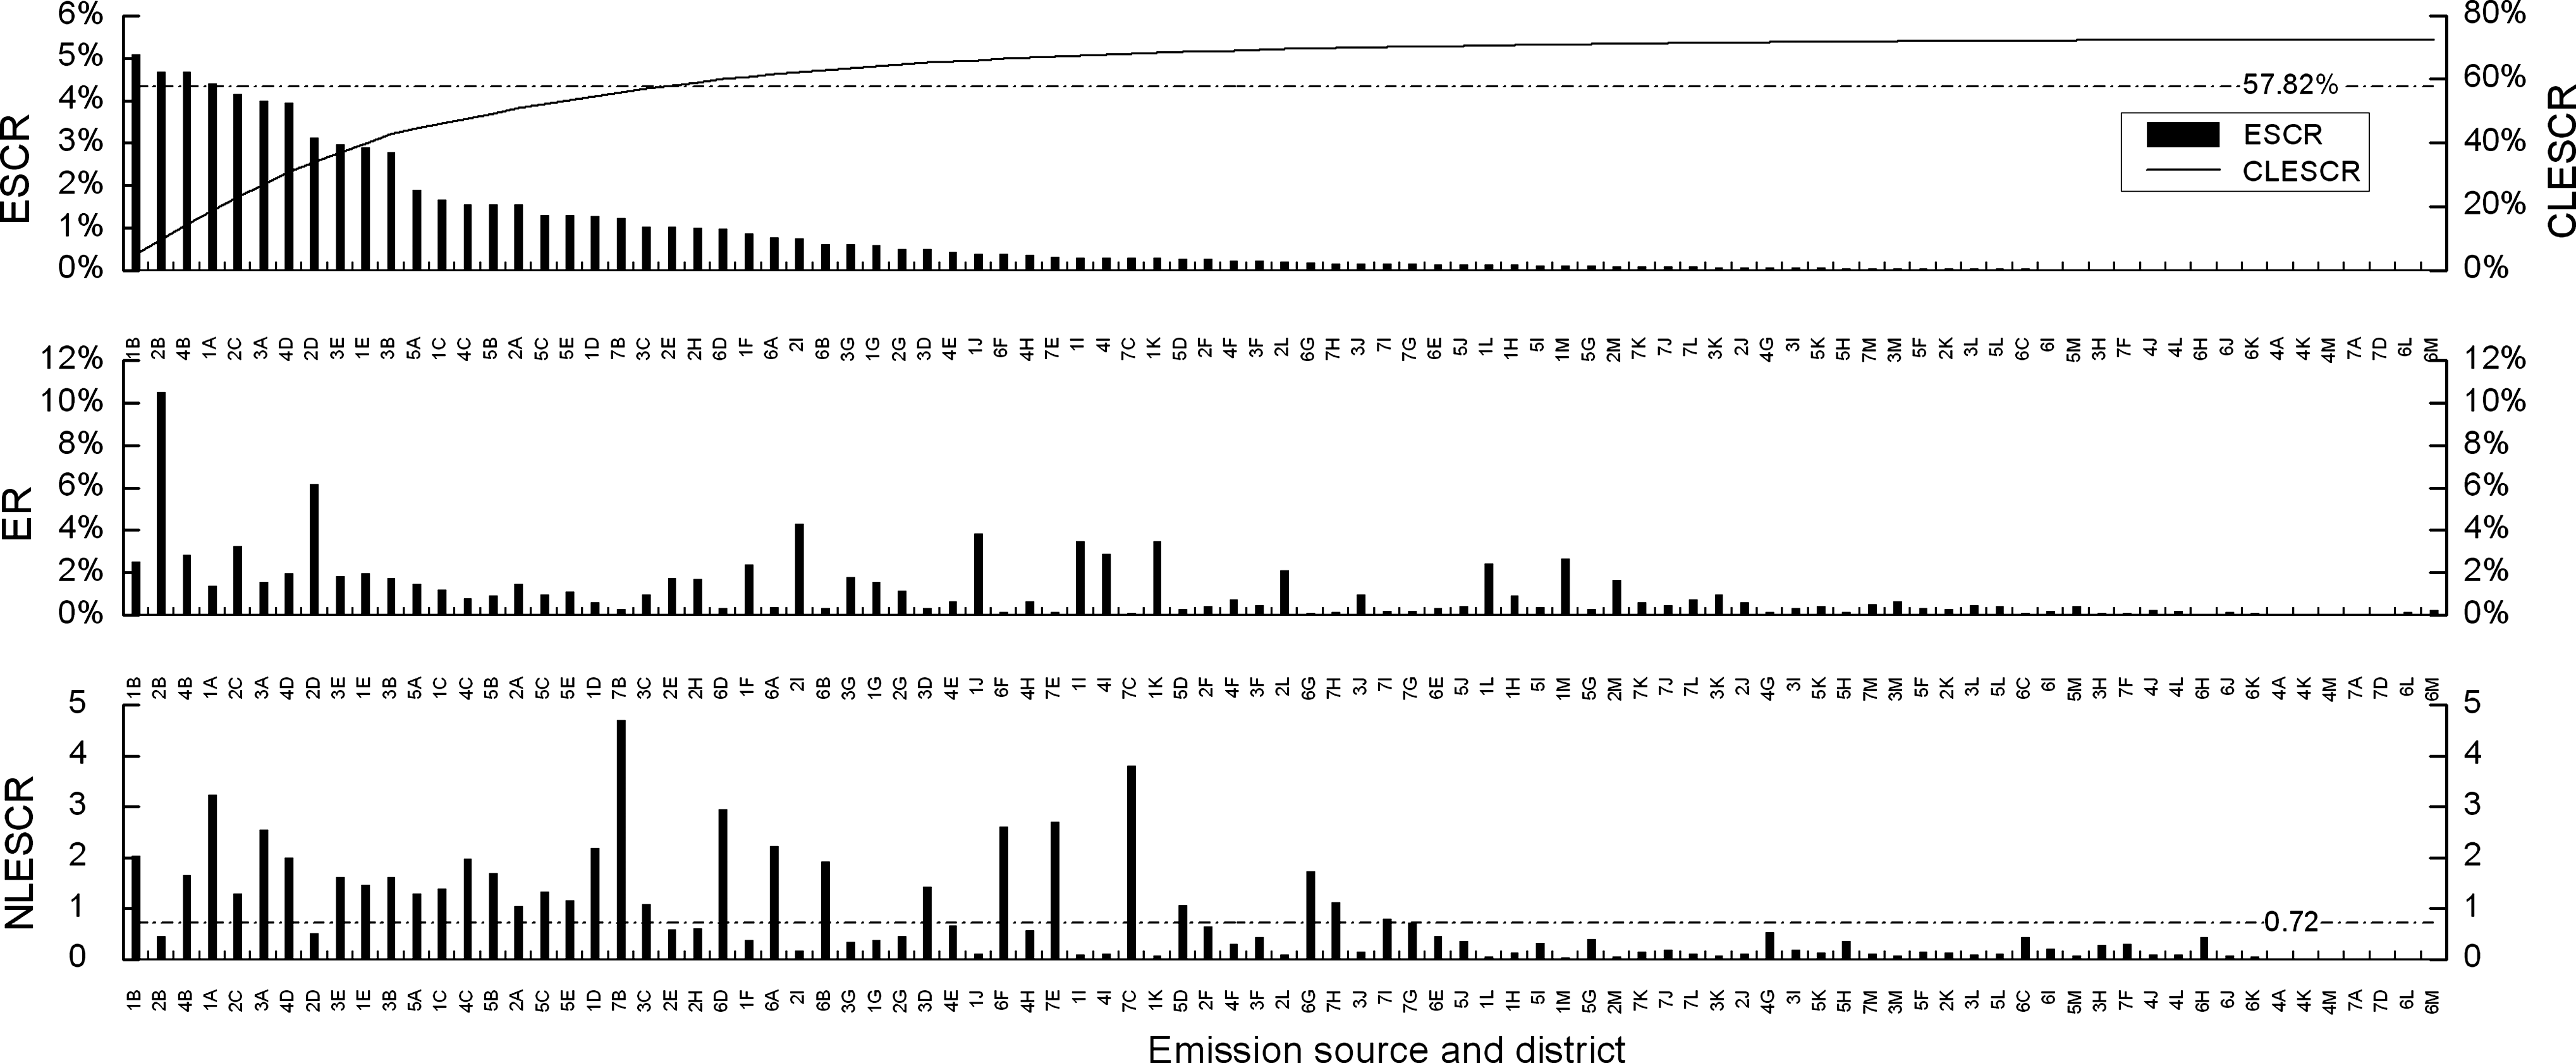
Calculated values of ESCR, CLESCR, ER, and NLESCR of different PM10 emission sources within different districts in Beijing.
It can also be found from Fig. 5 that the following PM10 emission sources within the following districts had higher NLESCR values than the TLESCR value of 0.72, including (a) stationary emissions from the urban center of Beijing (1.04) and Fengtai (1.29); (b) industrial fugitive emissions from Chaoyang (1.65), Fengtai (1.98), and Shijingshan (1.99); (c) road dust emissions from the urban center of Beijing (3.23), Chaoyang (2.03), Fengtai (1.39), Shijingshan (2.18), and Haidian (1.47); (d) construction site dust emissions from the urban center of Beijing (2.54), Chaoyang (1.61), Fengtai (1.08), Shijingshan (1.43), and Haidian (1.62); (e) bare land emissions from Chaoyang (4.69), Fengtai (3.81), Haidian (2.70), Changping (0.72), Mentougou (1.12), and Fangshan (0.80); (f) vehicle exhaust emissions from the urban center of Beijing (1.29), Chaoyang (1.69), Fengtai (1.33), Shijingshan (1.07), and Haidian (1.16); and (g) residential energy consumption emissions from the urban center of Beijing (2.23), Chaoyang (1.92), Shijingshan (2.94), Shunyi (2.61), and Changping (1.74).
As a result, the PM10 emission sources within the 13 districts of Beijing for priority regulation were identified as (1) stationary emissions from the urban center of Beijing and Fengtai; (2) industrial fugitive emissions from Chaoyang, Fengtai, and Shijingshan; (3) road dust emissions from the urban center of Beijing, Chaoyang, Fengtai, Shijingshan, and Haidian; (4) construction site dust emissions from the urban center of Beijing, Chaoyang, Fengtai, and Haidian; (5) bare land emissions from Chaoyang; and (6) vehicle exhaust emissions from the urban center of Beijing, Chaoyang, Fengtai, and Haidian. Consequently, a detailed air quality management plan for Beijing could be developed.
Discussion
Generally, the coupled MM5-CAMx-PSAT modeling system can be easily used to screen the emission sources for priority regulation at different levels for different management sectors or purposes. The analysis of PM10 emission source categories or districts in Beijing only requires low-resolution emission inventory but with fast computation speed, whereas the obtained results are also in low resolution, which can only be used to develop preliminary air quality management plan for controlling emissions. For example, the emission districts with high or low air quality management cost effectiveness can be identified based on their NLESCR values, and such information could be used for locating or relocating an industry. The industry with a high ESCR value identified from the analysis of emission source categories should be moved out of the emission district with a high NLESCR value, and be located or relocated in the district with a low NLESCR value. The comprehensive analysis of both emission source categories and districts could identify the emission source categories in a specific district for priority regulation and reveal the hidden information in the analysis of only emission source categories or only emission districts. For example, the industrial fugitive emission source was identified as a PM10 emission source for priority regulation in Beijing from the analysis of only emission source categories, but this result may be lack of implementation implications of urban air quality management, as there are too many districts in Beijing. From the comprehensive analysis, further detailed information was revealed to identify that the industrial fugitive emission only from Chaoyang, Fengtai, and Shijingshan districts (instead of the entire 13 districts in Beijing) was for priority regulation. Similarly, Haidian was identified as a PM10 emission district for priority regulation from the analysis of only emission districts, but it is not clear which emission sources within this district need priority regulation. From the comprehensive analysis, only road dust emission, construction site dust emission, and vehicle exhaust emission (instead of all the seven emission categories) from Haidian district were screened as the PM10 emission sources for priority regulation. In some situations, a certain emission category A may not be identified as an emission source for priority regulation from the analysis of only emission source categories, whereas a specific district B may also not be screened as an emission district for priority regulation from the analysis of only emission districts, but it is possible that emission source category A from district B can be identified as an emission source requiring priority control from the comprehensive analysis. As a result, a comprehensive analysis of both emission source categories and emission districts within a study region can provide more detailed and useful information for developing a sound air quality management plan.
Conclusion
In this study, a methodology based on a coupled MM5-CAMx-PSAT modeling framework was proposed to identify the local PM10 emission sources for priority regulation in urban air quality management. The emission source for priority regulation needs to satisfy two conditions: (a) the source is one of the main contributor sources to air pollutant concentration, and (b) the source has high cost effectiveness of emission control. The screening of main contributor sources was based on the ESCR in terms of the source's total emission amount, and the identification of the source with high cost effectiveness of emission control was based on the ESCR per unit emission amount. The proposed method was then applied to a case study in Beijing, China. Three scenarios of emission source study were analyzed, and it was found that the industrial fugitive emission and construction site dust emission were two sources requiring priority regulation in Beijing when only analyzing the PM10 emission source categories. Further, the modeling results indicated that the urban center of Beijing, Fengtai, Haidian, Chaoyang, and Shijingshan districts were the PM10 emission districts requiring priority regulation when only analyzing 13 emission districts. More in-depth information was revealed by comprehensively analyzing both PM10 emission source categories and districts, and the PM10 emission sources for priority regulation within various districts were identified. In this study, the parameters of ESCR and NLESCR were used to screen the emission source for priority regulation, and a high NLESCR value was assumed to be corresponding to the high cost effectiveness of emission control. In fact, the emission regulation can be affected by many factors, such as the cost of emission control and technological conditions, and such complexities need to be carefully considered. Generally, the proposed methodology framework still holds the potential to be applied to many other regional air quality management decision analysis studies, and could be implemented at different levels for different management purposes.
Footnotes
Acknowledgments
This research was supported by the Natural Sciences Foundation of China (No. 51038001 & 50878006), the “Beijing Science and Technology Project” (D09040903670801) of the Beijing Municipal Science & Technology Commission, the Ministry of Environmental Protection Special Funds for Scientific Research on Public Causes (No. 200909008), the Natural Science Foundation of Beijing (No. 8092004), Beijing NOVA Program of China (No. 2009B07), Innovation Team Project of Beijing Municipal Education Commission (PHR201007105), and the Cultivation Fund of the Key Scientific and Technical Innovation Project, Ministry of Education of China (708017). The authors would like to thank C. Emery and G. Wilson from ENVIRON International Corporation for their technical suggestions. The authors would also like to thank the journal editor and the anonymous reviewers for their comments and suggestions that helped in improving the article.
Author Disclosure Statement
No competing financial interests exist.