
Abstract
Abstract
Iron-oxide nanoadsorbents are attractive for wastewater treatment for two important reasons. First, nanoadsorbents can remove contaminants from wastewater rapidly. Second, iron oxide nanoadsorbents can be employed as catalysts for the decomposition of contaminants and thus eliminate sludge formation. This article investigates the use of iron-oxide nanoadsorbents to remove contaminants from wastewater. A later paper considers their use as catalysts for decomposition.
In this study, goethite (a type of iron oxide) nanoparticles was employed for the removal of methylene blue from an aqueous solution, using a batch-adsorption technique. Effects of contact time, initial concentration of methylene blue, temperature, and solution pH on the adsorbed amount of methylene blue were investigated. Adsorption was rapid, as equilibrium was achieved within 20 minutes. An external mass transfer model fit adsorption kinetic results well and provided reasonable overall volumetric mass transfer coefficients. Increases in initial concentration, temperature, and pH favored the adsorption of methylene blue. Adsorption data fit both the Langmuir and Freundlich isotherm models well, with the better fit to the Langmuir model. Thermodynamic studies confirmed that the adsorption reaction was spontaneous and endothermic in nature.
Introduction
Because of their multi-functionalities (e.g., high adsorption affinity and catalytic activities), iron-oxide nanoparticles are the most commonly used adsorbent and/or catalyst for wastewater remediation (Nassar, 2010a, 2010b, 2011; Hristovski et al., 2007). Furthermore, because iron oxide is naturally occurring, inexpensive, and stable over a wide range of temperatures and acidity levels (Perez, 2007), nanoparticles of iron oxide are advantageous over other metal oxides. There have been numerous studies on the use of iron-oxide nanoparticles as catalysts for degradation of contaminants, usually organic materials from wastewater (Tratnyek and Johnson, 2006; Yue and Economy, 2005; Savage and Diallo, 2005; Diallo and Savage, 2005; Waychunas et al., 2005; Zhang et al., 1998; Wang and Zhang, 1997), and as adsorbents for adsorptive removal of pollutants, mainly metal ions, from wastewater (Hristovski et al., 2007; Hu et al., 2005, 2006, 2007a, 2007b; Uheida et al., 2006a, 2006b). In this study, we explored the adsorptive removal of organic pollutants, exemplified by the methylene blue dye (MB), by goethite (α-FeOOH) nanoparticles. The catalytic oxidation of MB in the presence of iron-oxide nanoparticles will be addressed in future study.
Experimental Methods
Nanoparticles
Nanoparticles of α-FeOOH (goethite) were used as nanoadsorbents. The particles were obtained from Nanostructured & Amorphous Materials, Inc., in Houston, Texas. Before any adsorption experiments were performed, the textural and surface properties of the nanoparticles, including particle size, Brunauer-Emmett-Teller (BET) surface area, external surface area, and point of zero charge (pHpzc), were estimated. The BET and external surface areas were measured by performing nitrogen adsorption and desorption at 77K, using a Micromeritics Tristar 2000 surface area analyzer. Before analysis, the samples were degassed overnight at 150°C under a nitrogen (N2) gas flow. The specific area was calculated using the BET equation and the external surface area was estimated by the t-plot method.
The structure and size of the nanoparticles were determined using an X-ray Ultima III Multi-Purpose Diffraction System with Cu Kα radiation operating at 40 kV and 44 mA with a θ/2θ goniometer. Scanning was performed from 8° to 90° with a counting time of 0.8 s/step.
The solid addition method (Balistrieri and Murray, 1981) was used to determine pHpzc. This was achieved by exposing 100 mg of goethite nanoparticles to a set of 25 ml vials containing 10 mL aqueous solution of 0.1 M potassium nitrate (KNO3) with varying initial solution pH (pHi). The mixtures were shaken in an Innova 40 temperature incubator (New Brunswick Scientific, Enfield, CT) at 200 rpm and 298K for 24 h. After that period of time, the nanoparticles were separated from the mixture by centrifugation using an Eppendorf Centrifuge 5804 (Mississauga, Canada) for 15 min at 5000 rpm. The pH values of the supernatant were measured and noted as pHf. The difference between pHi and pHf was plotted against the pHi and the intersection point of the obtained curve was estimated. This intersection point represents the pHpzc, which is the point at which the adsorbed protons are equal to the desorbed protons. The estimated pHpzc value for our goethite nanoparticles was 7.5±0.5, which is in agreement with the value reported in literature (Balistrieri and Murray, 1981). An AB15 plus pH meter from Fisher Scientific was used for pH measurements. Aliquots of HNO3 or sodium hydroxide (NaOH) were used to adjust the pH over the range 2–12.
Adsorbate
Methylene blue chloride (MB), from EMD Chemicals Inc., was selected as a source of blue dye for this study. MB has a molecular weight 374 g/mol, color index number 52015, and wave number 625. A stock solution was prepared by dissolving a specified amount of MB in 300 mL of deionized water and subsequently diluted to the required concentrations.
Adsorption of MB onto goethite nanoparticles
Batch-mode adsorption experiments were performed by exposing a specified weight of goethite nanoparticles to an aqueous solution containing a certain concentration of MB at a specified solution pH for a predetermined mixing time. For the pH-dependent studies, MB adsorption experiments were conducted at 298K and 200 rpm for 24 h of mixing in an Innova 40 temperature incubator. To adjust the pH of the solution, HNO3 or NaOH, was used in a range from 2.5 to 11. For the adsorption isotherm studies, 100 mg of goethite nanoparticles were added to a set of 25-mL vials containing 10 mL aqueous solution with MB concentrations ranging from 0 to 200 mg/L at pH of 6.62. The mixture was then left in an Innova 40 temperature incubator for 24 h and shaken at 200 rpm at temperatures of 298K, 313K, and 328K. For the adsorption kinetic studies, the initial concentrations of MB were 25 and 50 mg/L, and the experiments were carried out in an Innova 40 temperature incubator at 298K, 200 rpm, and solution pH of 6.62. The mixture was shaken for specified time intervals.
To determine the adsorption equilibrium time required for saturation, samples were selected at predetermined time intervals and analyzed for MB concentration. In all experiments, the goethite nanoparticles containing adsorbed MB were separated from the mixture by centrifugation for 15 min at 5000 rpm using an Eppendorf Centrifuge 5804, and the supernatant was decanted. The residual concentration of MB in the supernatant was measured by UV-vis spectrophotometry (UV-vis) using a Nicolet Evolution 100 at a wavelength of 625 nm. A calibration curve of UV-vis absorbance at 625 nm against the MB concentration was established, using standard model solutions with known concentrations. UV-vis spectra of MB in solution were selected on the basis of the absorption linearity range, that is, absorbance <2.0. The adsorbed amount of MB (mg of MB/g of nanoparticles) was determined by the mass balance in Equation (1):
where C0 is the initial concentration of MB in the solution (mg/L), C is the final concentration of MB in the supernatant (mg/L), V is the solution volume (L), and m is the dry mass of goethite nanoparticles (g). For equilibrium data, Ce replaces C, and Qe replaces Q in Equation (1).
The supernatant was also analyzed for iron (Fe) concentration at different pH values between 2.5 and 11 using an inductively coupled plasma-atomic emission spectroscopy (ICP-AES; IRIS Intrepid II XDL, Thermo-Instruments Canada Inc., Mississauga, Canada). ICP-AES measurements showed no significant Fe concentration, indicating that all the goethite nanoparticles were separated by centrifugation, and no dissolution of the nanoparticles occurred under experimental conditions.
Desorption of MB
In this set of experiments, desorption of MB from MB-loaded nanoparticles was conducted, using HNO3 solutions at different concentrations. Nanoparticles containing MB were exposed to 10-mL solutions of different HNO3 concentrations. The mixture was shaken for 20 min at 200 rpm and 298K in an Innova 40 temperature incubator. After desorption, the nanoparticles were separated by centrifugation for 15 min at 5000 rpm using an Eppendorf Centrifuge 5804, and the supernatant was transferred to UV-Vis for MB concentration measurement. The recovery efficiency, R(%), of MB from the nanoparticles was estimated as follows:
where Cdes and Cads are the desorbed amount of MB from the surface of the nanoparticles to the aqueous solution and the adsorbed amount of MB onto the nanoparticles (mg/L), respectively.
Results and Discussion
Textural properties of the selected nanoparticles
Table 1 lists the specifications and textural properties of the goethite nanoparticles used in this study. As shown in the table, there is no significant difference between BET and t-plot surface area values, indicating that the goethite nanoparticles are nonporous. Figure 1 shows the X-ray diffraction patterns of the nanoparticles. The patterns confirm the peaks of goethite as reported by the manufacturer. The structure was identified by comparison to spectra in the JADE program, using the database of Materials Data XRD Pattern Processing Identification & Quantification (pdf card 01-073-9835).
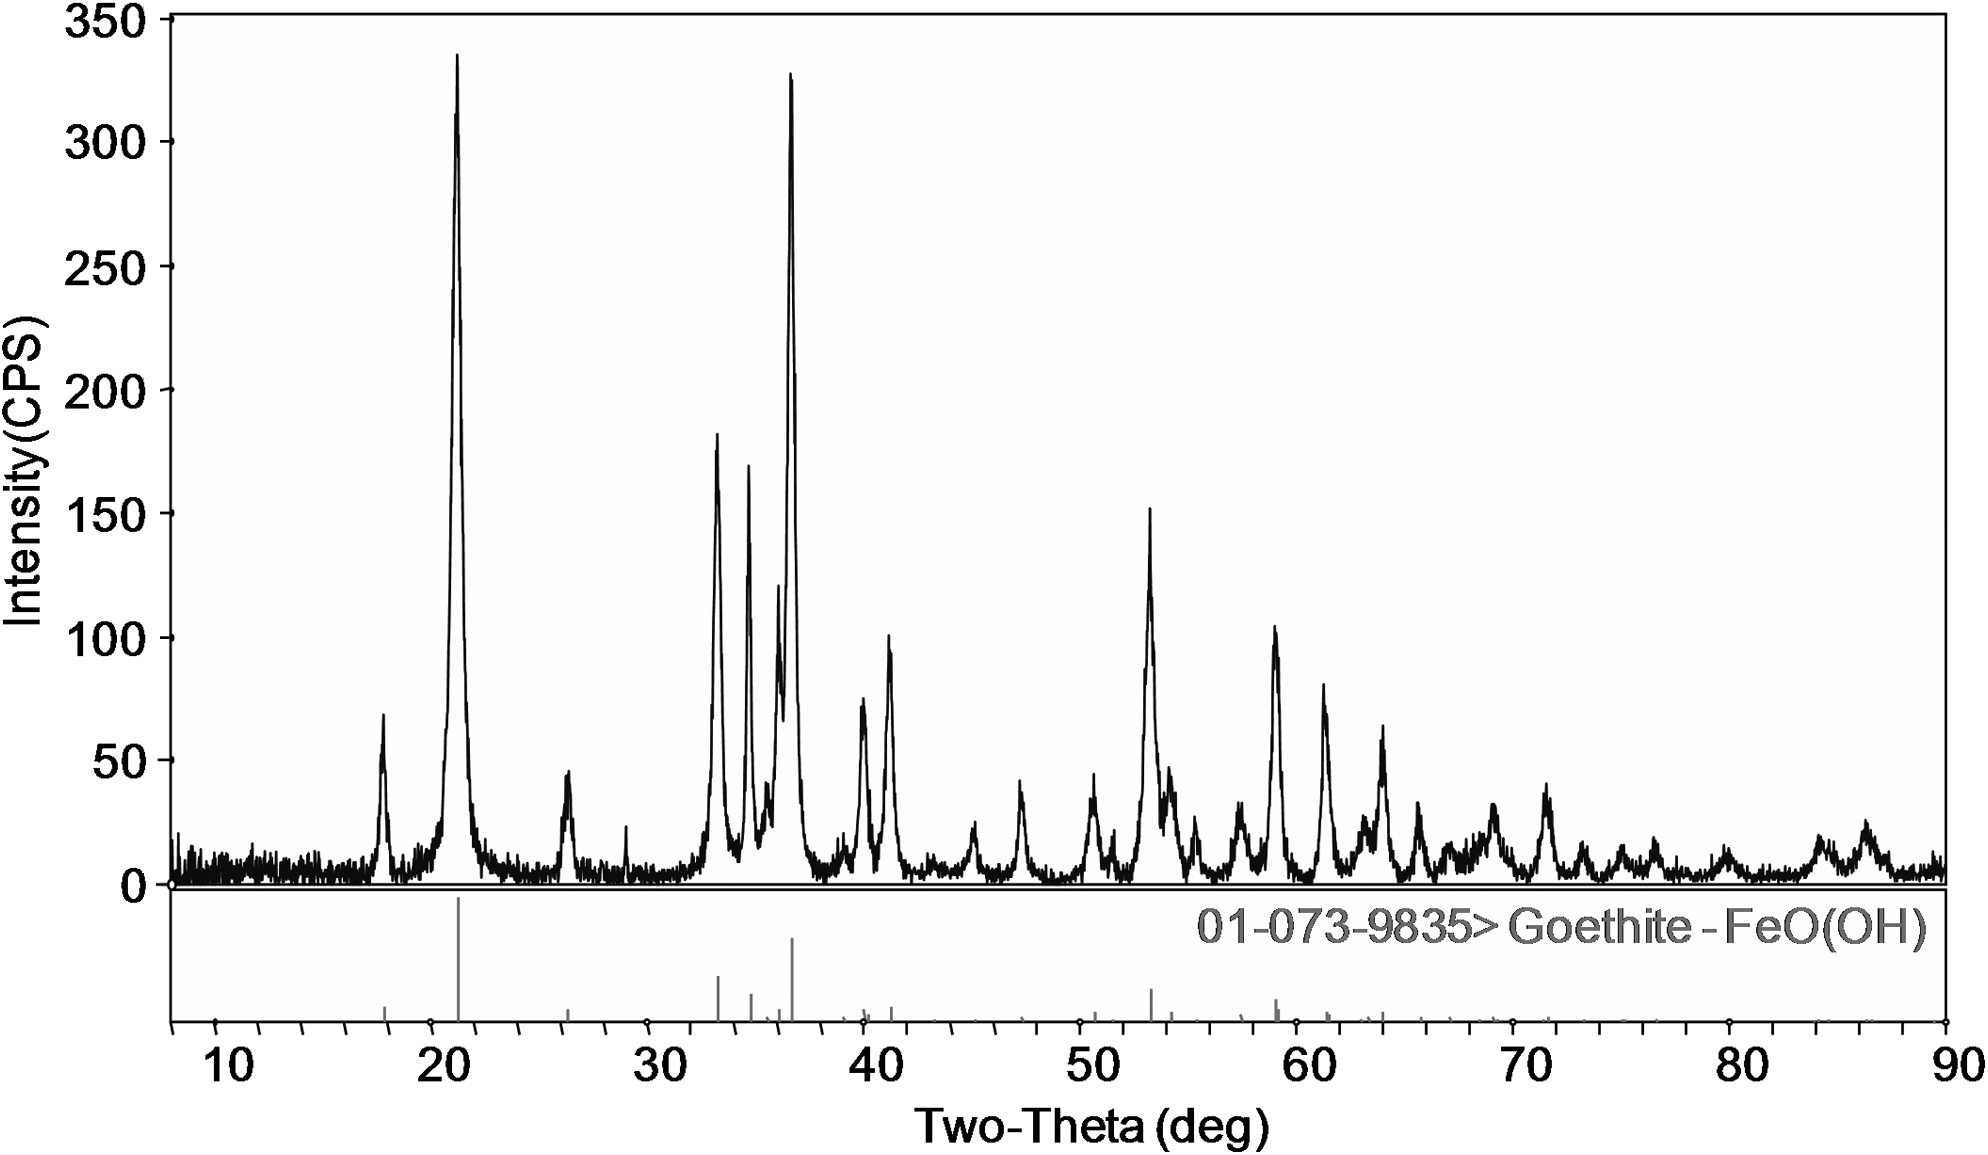
X-ray diffraction pattern of the selected nanoparticles. Reference data for goethite (α-FeOOH) are from Materials Data XRD Pattern Processing Identification & Quantification.
Adsorption mechanism and effect of pH
Depending upon the pH of the solution, the presence of goethite nanoparticles in an aqueous solution caused the surface of nanoparticles to undergo protonation or deprotonation, as per the following reaction (Roonasi and Holmgren, 2009; Johnson et al., 2000):
where H+ and OH− refer to the potential determining ions.
MB is a water-soluble basic dye having functional groups in its structure. In an aqueous solution, the MB dissociates a positive cation as illustrated in the following reaction:
MB adsorption occurs when the deprotonated surface of goethite nanoparticles is contacted with the MB functional groups. The adsorption is likely to be an electrostatic attraction. At a high pH, electrostatic attraction is expected to exist between the negatively charged surface of the nanoparticles and the positively charged MB functional groups, as exemplified by Reaction (R3):
As the solution pH decreases, the number of positively charged sites increases, and the number of negatively charged sites decreases. A positively charged surface site repels the positively charged MB functional groups, and hence adsorption is expected to decrease.
Figure 2 shows that the adsorption of MB onto goethite nanoparticles increased with increasing pH. The adsorption became higher at pH>7.5, reflecting the point of zero charge (pzc) of the goethite nanoparticles. The significant adsorption above pzc serves to emphasize the need for a favorable electrostatic environment for MB adsorption onto a goethite surface. It should be noted that polar interactions between adsorbate molecules and an adsorbent surface cannot be overlooked. Note that the goethite nanoparticles were still capable in adsorbing MB at pH<7.5. This suggests that, as in most polar material, the presence of sites suitable for the formation of electron-donor/electron-acceptor interactions would favor adsorption.
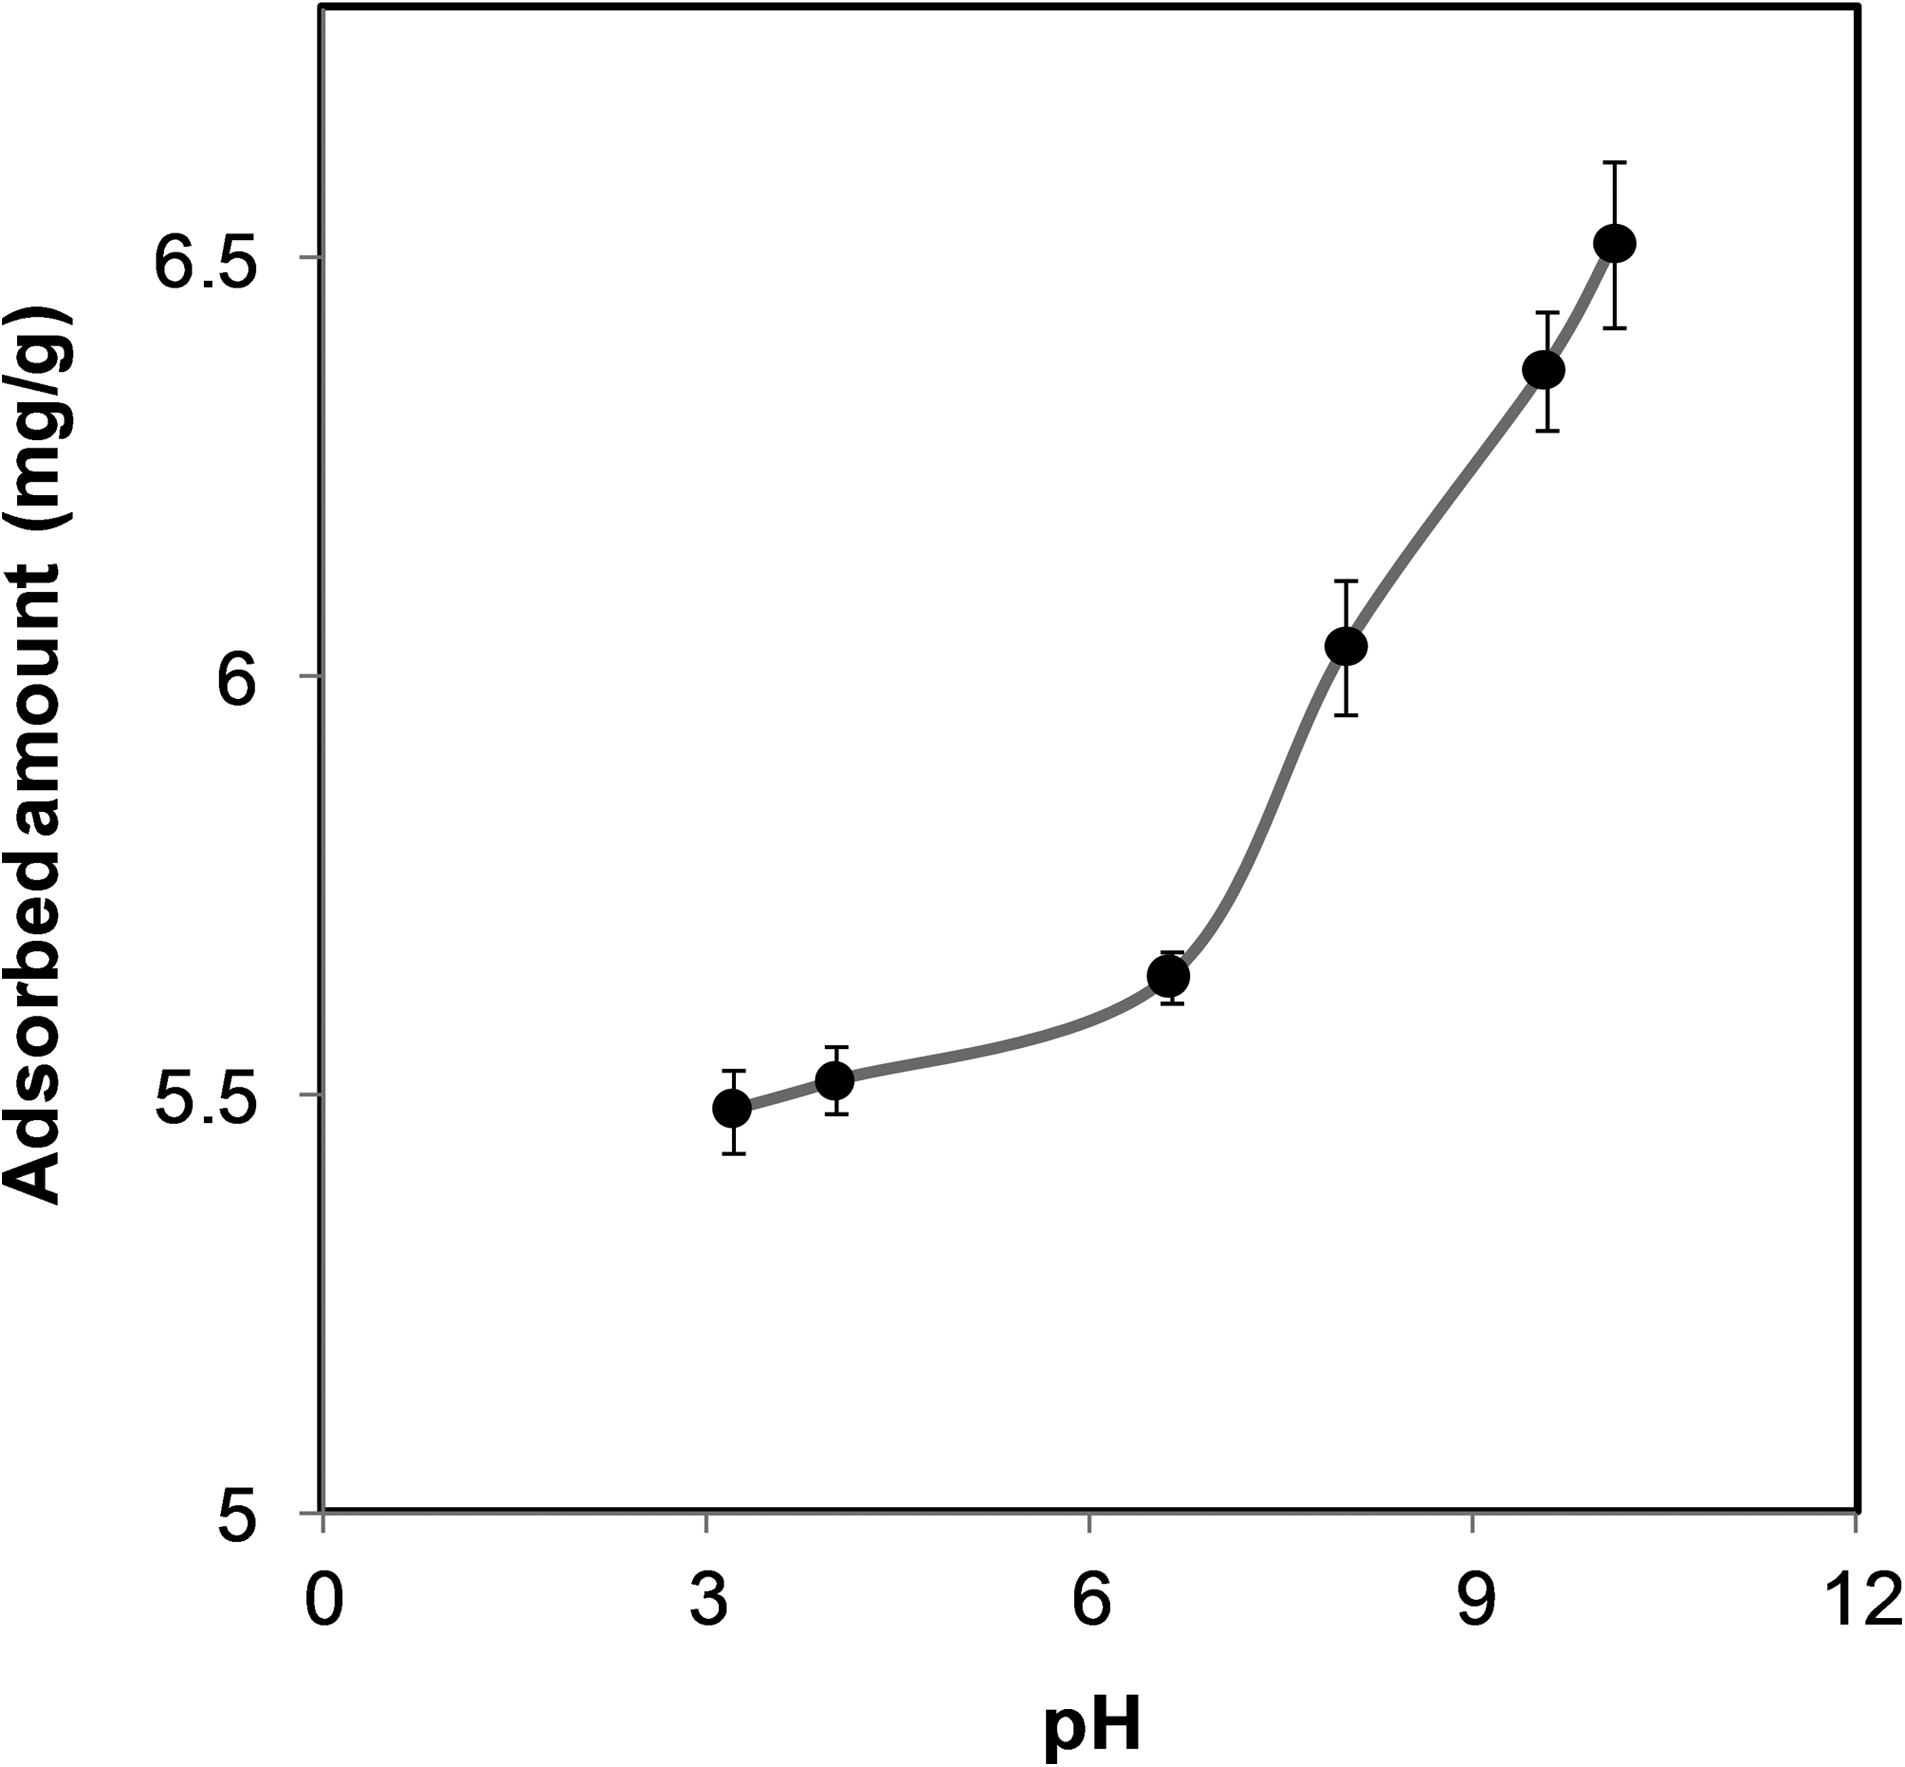
Effect of solution pH on MB adsorption onto goethite nanoparticles. Initial concentration of MB: 100 mg/L; adsorbent dose: 10 g/L; shaking rate: 200 rpm (Innova 40 temperature incubator); and T: 298K.
Adsorption isotherms
To conduct adsorption isotherms for the goethite nanoparticles, the initial concentration of MB was varied from 0 to 0.40 mM at different temperatures and a pH of 6.62. Figure 3 shows that MB adsorption at all of the selected temperatures increased sharply at low equilibrium concentration and started to level off with further increase in equilibrium concentration, which suggests that goethite has a high adsorption affinity for MB. Furthermore, as Fig. 3 shows, adsorption increased with temperature. This may be because of the increase in the mobility of MB molecules, which in turn, increased the number of molecules that interacted with the active sites at the nanoparticle surfaces (Nassar, 2010b). It also suggests that the adsorption process is endothermic.
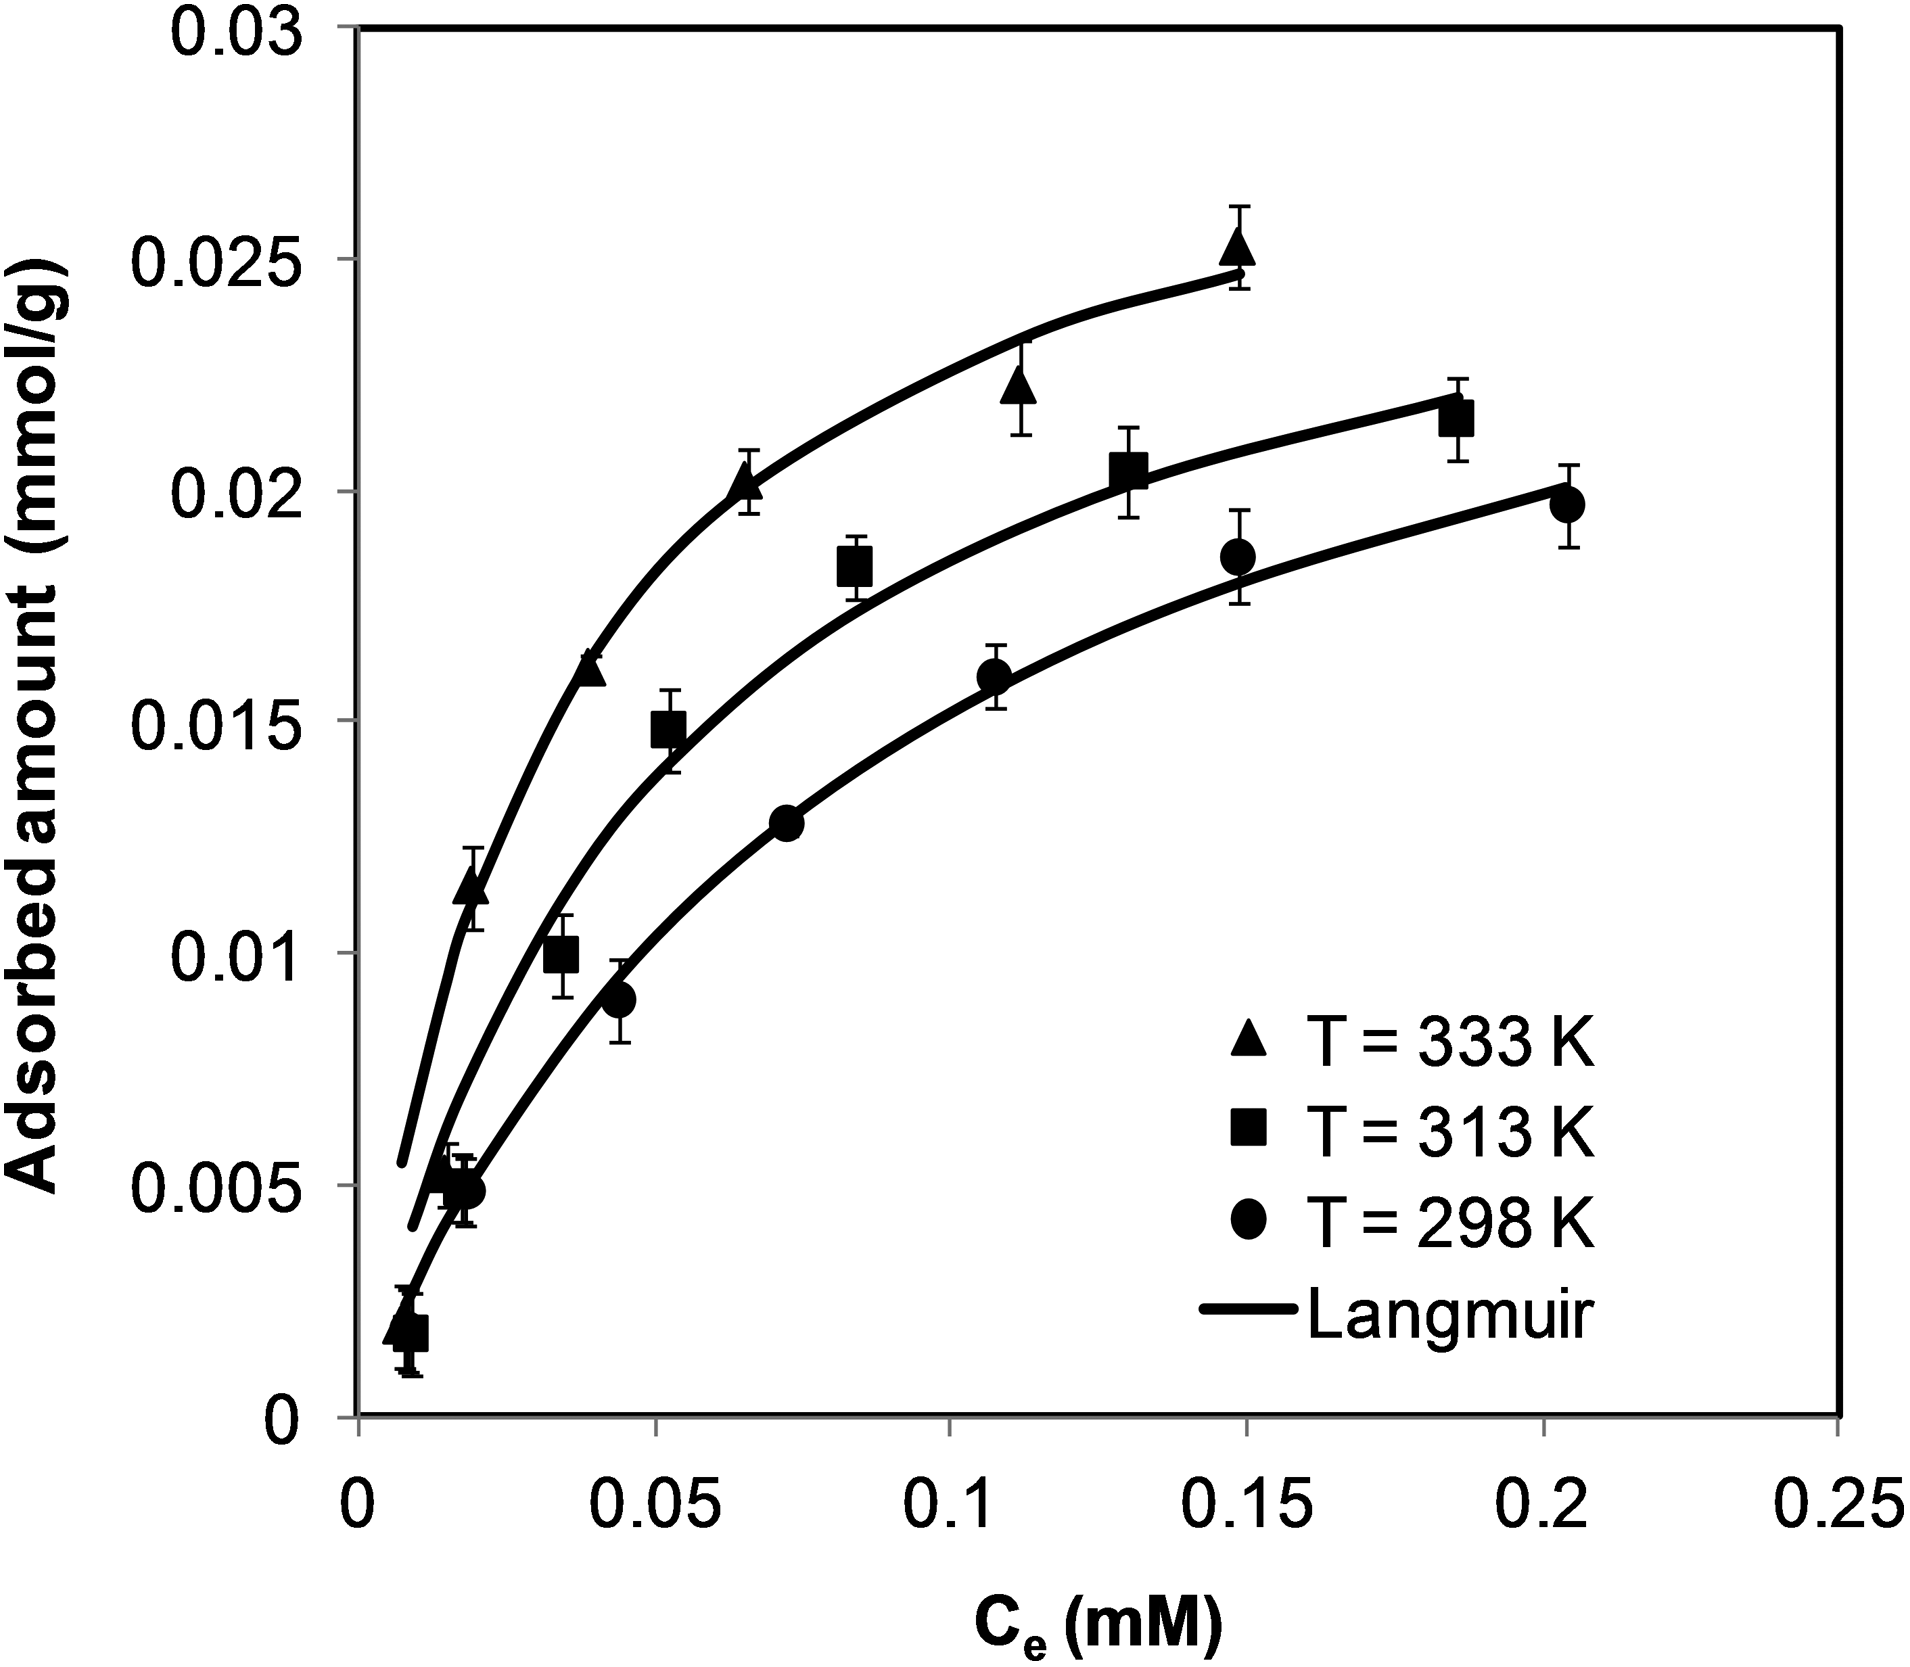
Adsorption isotherm of MB onto goethite nanoparticles at different temperatures. Adsorbent dose: 10 g/L; shaking rate: 200 rpm (Innova 40 temperature incubator); pH: 6.62. The symbols are experimental data, and the solid lines are from the Langmuir model [Eq. (3)].
The shapes of the isotherms were fit to the Langmuir and Freundlich models (Langmuir, 1916; Freundlich, 1906), which are expressed linearly in Equations (3) and (4):
where Qe is the adsorbed amount of MB onto the goethite nanoparticles (mmol/g), Ce is the equilibrium concentration of MB in the supernatant (mM), KL is the Langmuir equilibrium adsorption constant related to the affinity of adsorption (L/mmol), Qm is the maximum adsorbed amount of MB per mass of nanoparticles for complete monolayer coverage (mg/g), KF is the Freundlich constant related to the adsorption capacity [(mmol/g)(L/mmol)1/n], and 1/n is the adsorption intensity factor (unitless). Langmuir constants were estimated by plotting the experimental results as Ce/Qe against Ce, as shown in Fig. 4. KL and Qm were obtained from the slope and intercept of the best-fit line, respectively. Freundlich constants were estimated by plotting log (Qe) against log (Ce) as presented in Fig. 5. The slope and intercept of the best-fit line were used to estimate 1/n and KF, respectively.

Langmuir adsorption isotherms of MB onto goethite nanoparticles. Nanoparticle dose: 10 g/L; shaking rate: 200 rpm (Innova 40 temperature incubator); pH: 6.62. The symbols are experimental data, and the solid lines are from the linearized Langmuir model [Eq. (3)].
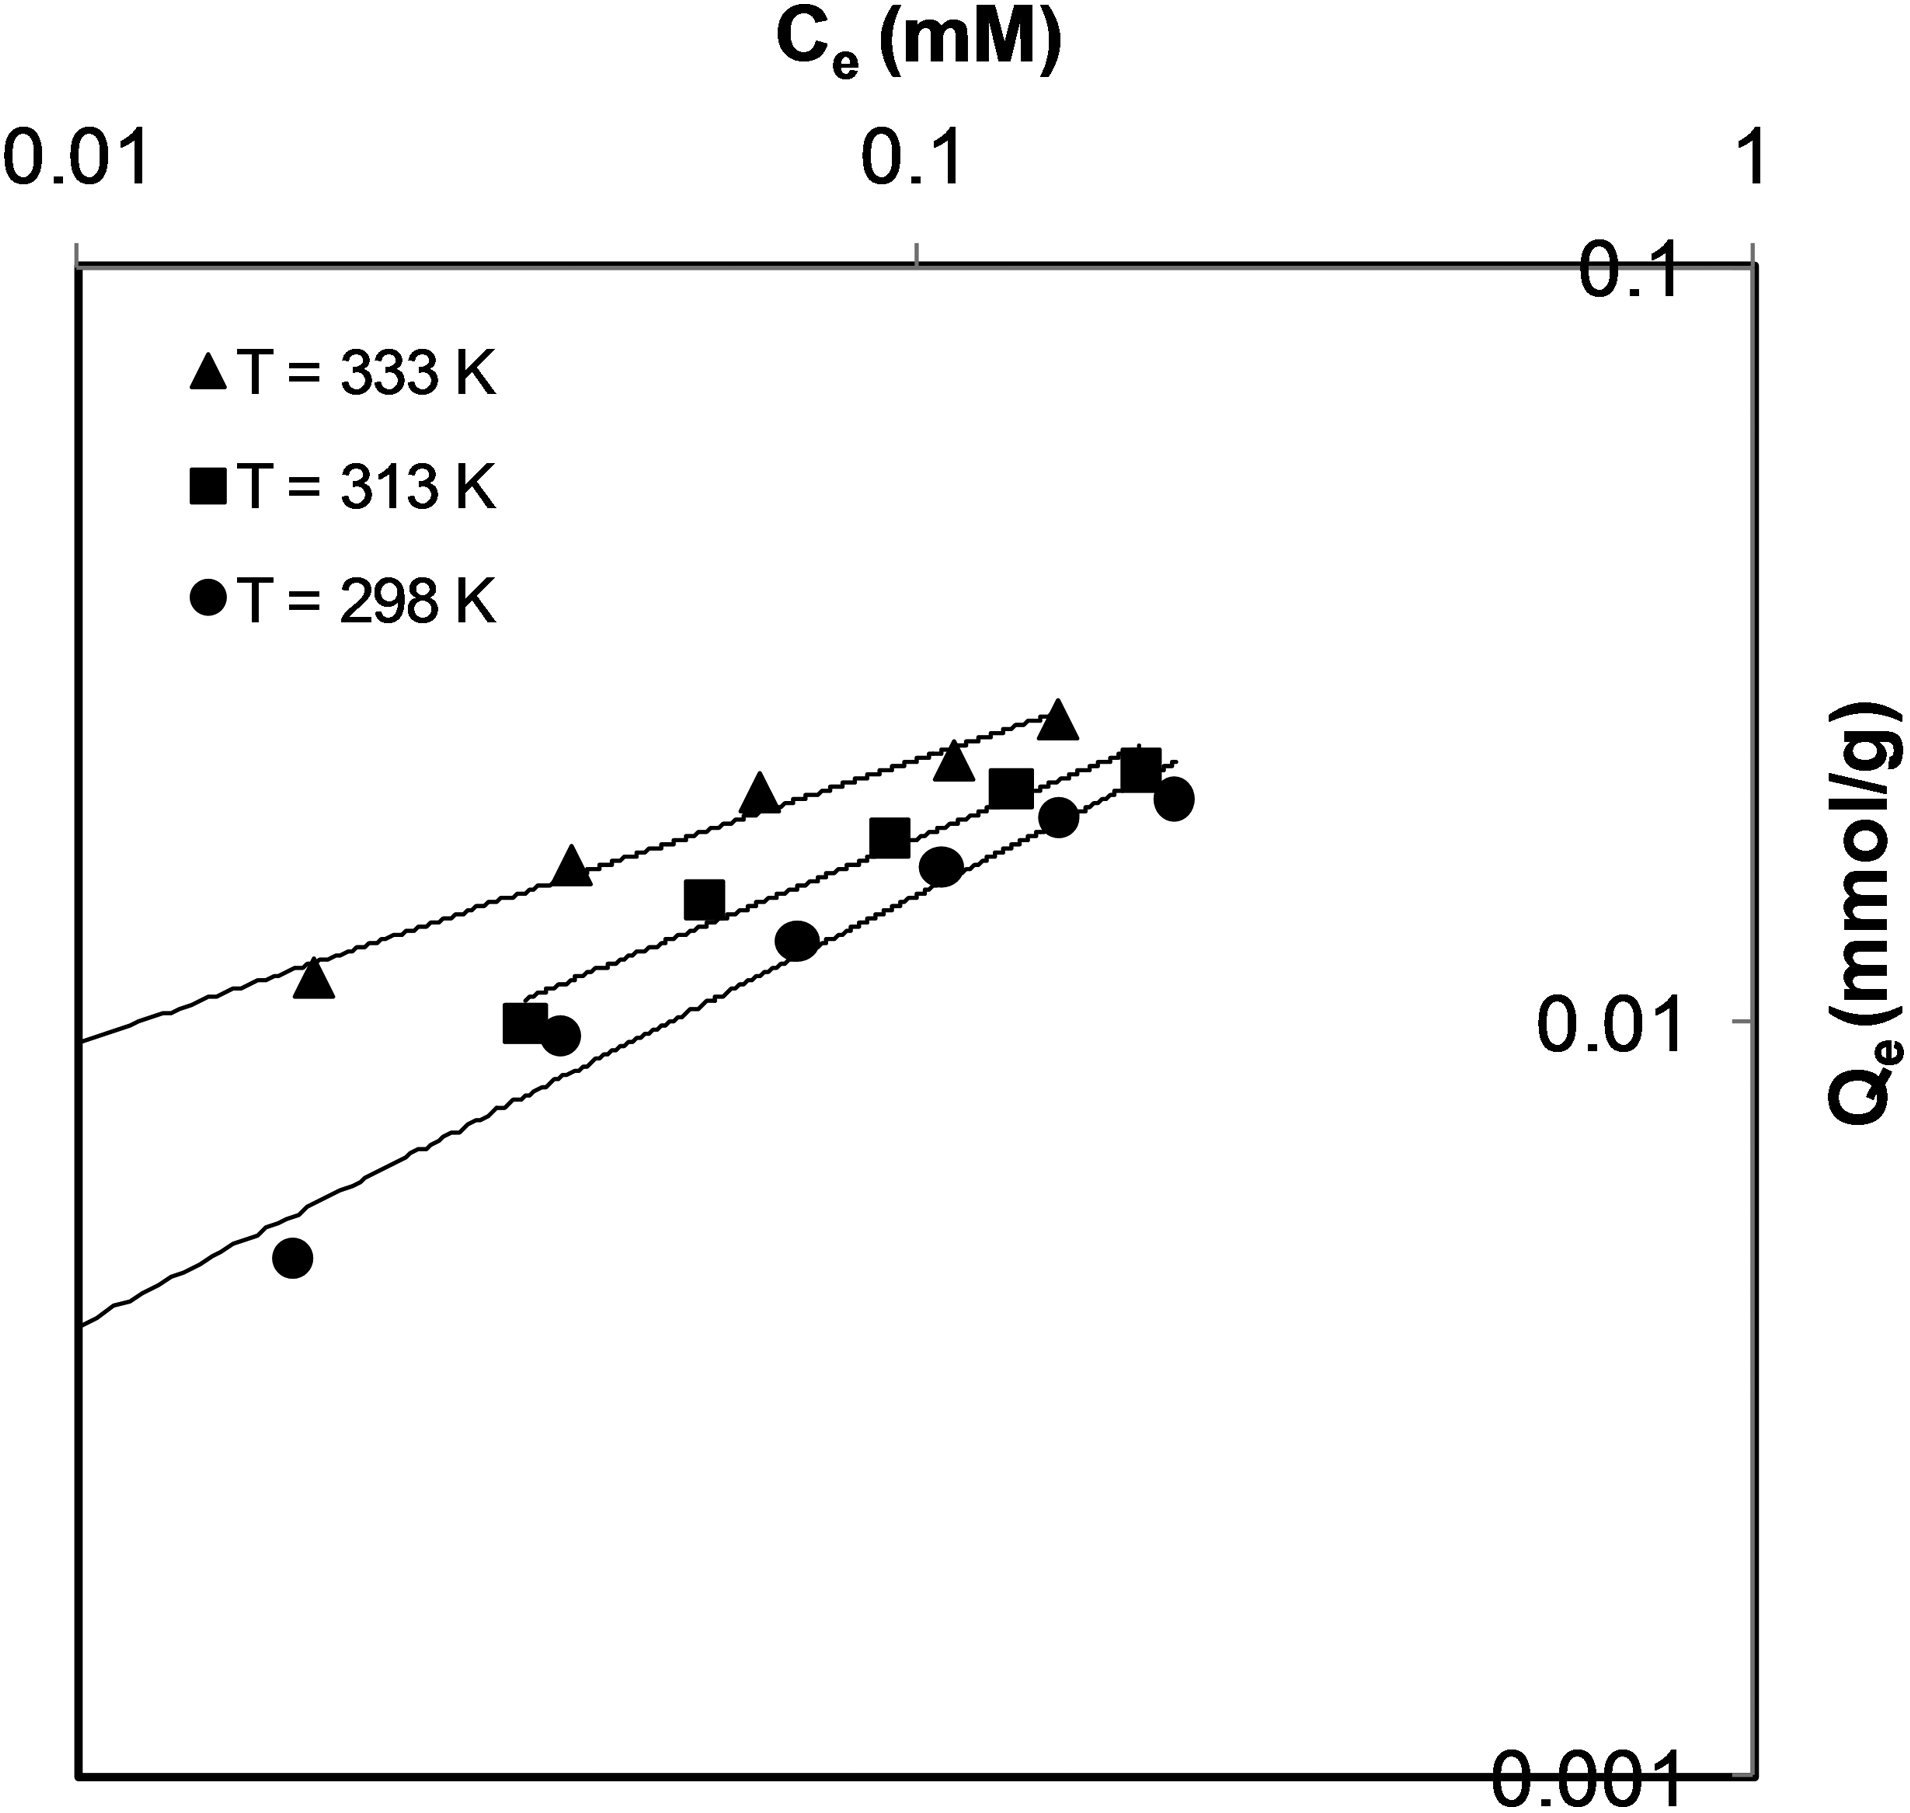
Freundlich adsorption isotherms of MB onto goethite nanoparticles. Nanoparticle dose: 10 g/L; shaking rate: 200 rpm (Innova 40 temperature incubator); pH: 6.62. The symbols are experimental data, and the solid lines are from the linearized Freundlich model [Eq. (4)].
Nonlinear Chi-square analyses were conducted for comparing the best-fit-model, using Equation (5) (Montgomery and Runger, 2006):
where Qe and QeModel are the equilibrium adsorbed amount of MB obtained experimentally and through modeling. The estimated values of χ2 are listed in Table 2. Clearly, the Langmuir model, which has smaller χ2 values than the ones of the Freundlich model, is the best-fit model for the experimental data. The Langmuir model assumes that adsorption occurs on a homogeneous surface by monolayer adsorption and that there is no interaction between adsorbed species. The values of KL and Qm shown in Table 2 increased with temperature, indicating that MB is favorably adsorbed by the nanoparticles, and the adsorption capacity increases with temperature. The values of KL and Qm obtained in our study are higher than those reported in the literature on the adsorption of MB onto metal oxide surface or low-cost adsorbents (Ma et al., 2010; Jain et al., 2010; Fangwen et al., 2009; Ofomaja, 2007; Mak and Chen, 2004; Dogan et al., 2004). It is possible that this because of the high surface area, good dispersion ability, and intrinsic reactivity of goethite nanoparticles.
Thermodynamic studies
Thermodynamic studies were employed to better explain the adsorption reaction and to provide more insights into the effect of temperature on adsorption. Such thermodynamic parameters as the changes in standard Gibbs free energy (ΔGo), enthalpy (ΔHo), and entropy (ΔSo) during the MB adsorption were evaluated. Using the following equation (Smith et al., 2005), ΔGo was estimated:
where R is the ideal gas constant (R=8.314 J/mol.K), T is the temperature (Kelvin) and K is the adsorption equilibrium constant (dimensionless). The adsorption equilibrium constant could be estimated from the Langmuir's constant, using Equation (7) (Nassar, 2010a, 2010b; Rudrake et al., 2009):
where KL is the equilibrium Langmuir constant (L/mmol) and Csolvent is the solvent molar concentration (mM), which was estimated from the density and molecular weight of water at the given temperature. The van't Hoff equation (Smith et al., 2005), which shows the dependence of the adsorption reaction equilibrium constant on temperature, was used to calculate ΔHo and ΔSo as follows:
By plotting the experimental results as ln K against 1/T, ΔHo and ΔSo were obtained from the slope and intercept of the best-fit line. The van't Hoff plot is shown in Fig. 6. The calculated thermodynamic parameters are presented in Table 3. As seen, the values of ΔGo at all temperatures are negative, which indicates the spontaneous and thermodynamically favorable nature of adsorption. The ΔHo value is positive, which implies that the adsorption process is endothermic in nature. The positive value of ΔSo may be attributed to the increase in randomness at the nanoparticle–liquid interface, which results from the extra translational entropy gained by the water molecules that were previously adsorbed onto the nanoparticles but then displaced by MB molecules. It should be noted that an adsorption reaction with ΔGo values between −20 kJ/mol and 0 kJ/mol indicates a spontaneous physical adsorption, while an adsorption reaction with values between −400 kJ/mol and −80 kJ/mol indicates a chemisorption (Seki and Yurdakoç, 2006; Yu et al., 2001). In this study, the ΔGo values were between −39.64 kJ/mol and −33.35 kJ/mol, which suggests that the adsorption mechanism may be attributed to a physical adsorption enhanced by a chemical effect (Yu et al., 2001). In addition, the fact that ΔHo <40 kJ/mol suggests a physical adsorption process (Seki and Yurdakoç, 2006).
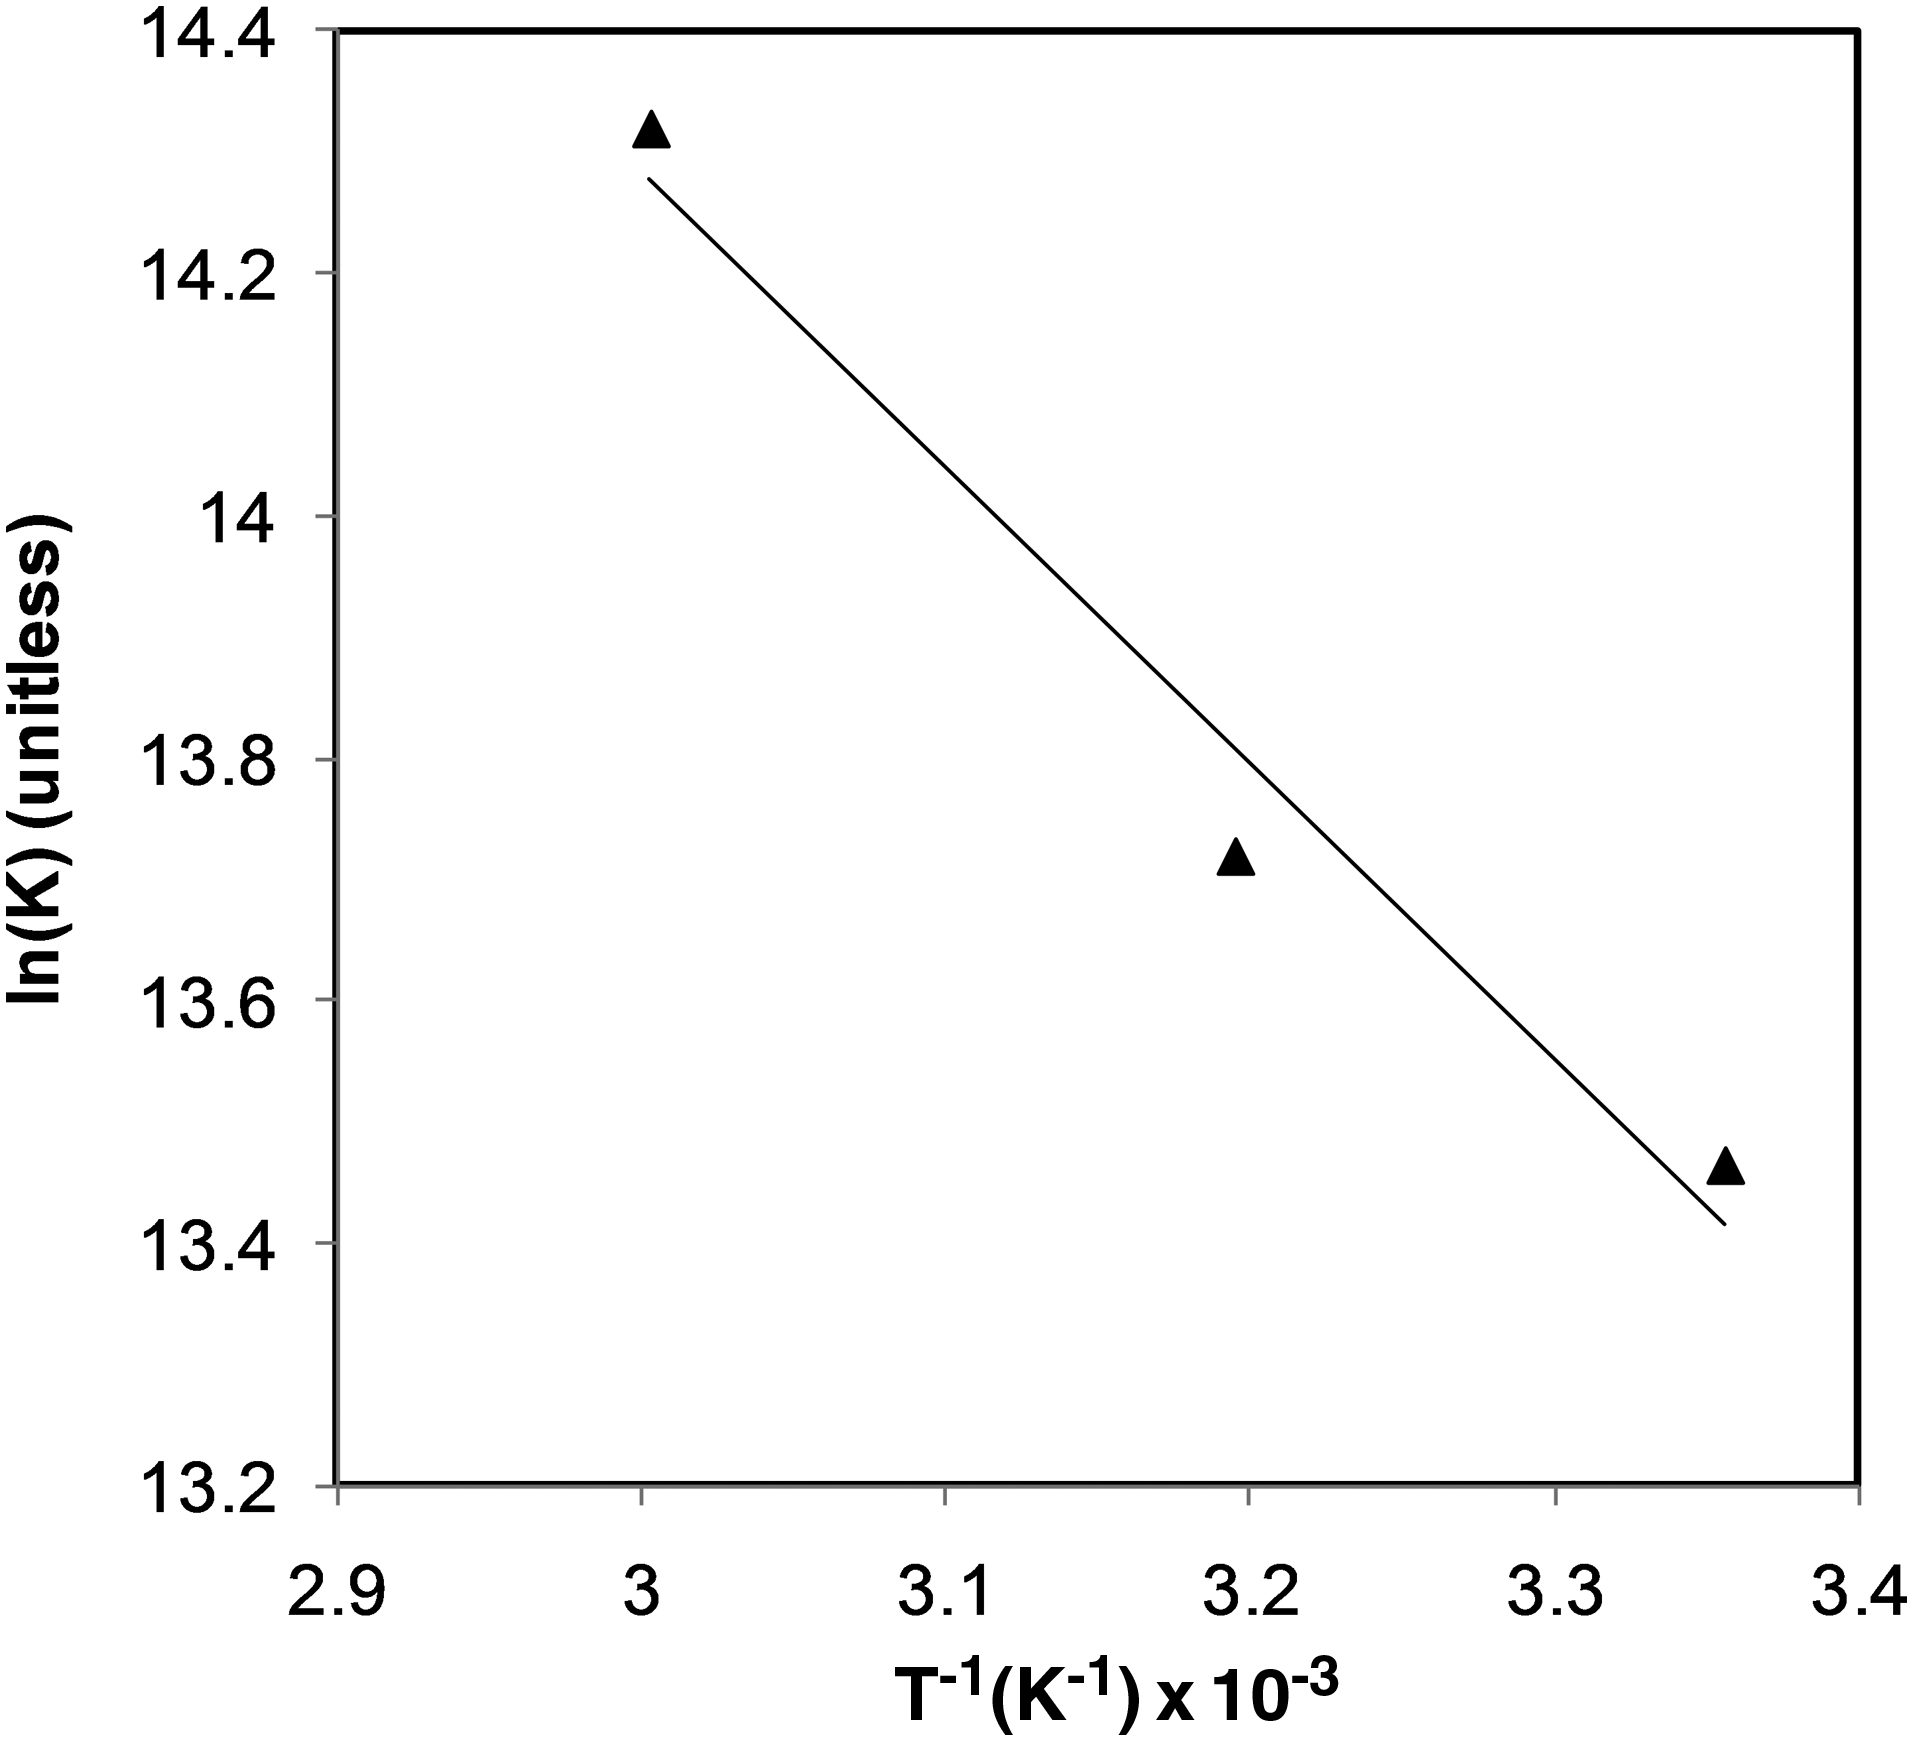
van't Hoff plot for the endothermic adsorption of MB onto goethite nanoparticles.
Adsorption kinetics
Kinetic experiments were performed at 298K and pH of 6.62 to determine the MB removal rate from an aqueous solution at MB initial concentrations of 25 mg/L and 50 mg/L. Figure 7 shows the change in the normalized concentration of MB in the solution as a function of contact time. As shown, the MB adsorption was rapid and independent of the initial concentration. For both initial concentrations, adsorption equilibrium was reached within ∼20 minutes. This is not surprising as the nanoparticles are nonporous and, hence, external adsorption is dominant, and no intraparticle diffusion was available to slow the adsorption rate (Nassar, 2010a, 2010b). It should be noted that the adsorption of a molecule onto a nonporous adsorbent is expected to take place in three steps: (1) bulk transport of the molecule in solution, which is usually fast because of mixing; (2) film diffusion transport, which involves diffusion of the molecule through a film layer surrounding the adsorbent surface; and (3) adsorption (or sorption), which is a fast step, equivalent to an equilibrium reaction, and involves the interaction of the molecule by the active adsorption sites (Weber and Smith, 1987; Weber, 1985). Due to good mixing and the degree of dispersion for nanoparticles in solution, the adsorption kinetic considered in this study apparently was only affected by film diffusion. Hence, modeling of the adsorption kinetics was determined using an external mass transfer model (Metcalf and Eddy, 2003):
where Km is the external mass transfer coefficient in the liquid phase (m/min), a is the specific surface area of the nanoparticles available for mass transfer per unit volume of the reactor (m2/m3), Cs is the concentration of MB at the liquid-nanoparticle interface (mmol/L), and C (mmol/L) is the concentration of MB in the solution at time t, where t is the time in minutes. Kma is known as the volumetric mass transfer coefficient (1/min). Cs was estimated by assuming that equilibrium conditions exist at the liquid-nanoparticle interface (Puranik et al., 1999; Weber and Smith, 1987), and adsorption followed the Langmuir model as per the findings in the previous section. Hence, Cs was calculated from the Langmuir model as follows:
When Equation (10) is substituted into Equation (9), it yields
Q can be obtained from the mass balance [Eq. (1)]. By substituting Equation (1) into Equation (11), the following differential equation is obtained:
Equation (12) represents a first-order ordinary differential equation that can be solved numerically at the initial condition of C=Co at t=0. Langmuir constants, KL and Qm, are obtained from the isotherm study at 298K (Table 2). The MATLAB package was used to estimate the Kma values at different initial concentrations of MB by fitting the kinetic results obtained experimentally to equation (12). As seen in Fig. 7, the model fit well to the experimental results and described the adsorption kinetics accurately. The calculated Kma values for initial concentrations of 25 mg/L and 50 mg/L are 0.10 and 0.097 (1/min), respectively. These values are in agreement with the values reported in literature on the adsorption of organic molecules, such as bovine serum albumin, onto magnetite (Fe3O4) nanoparticles (Peng et al., 2004).
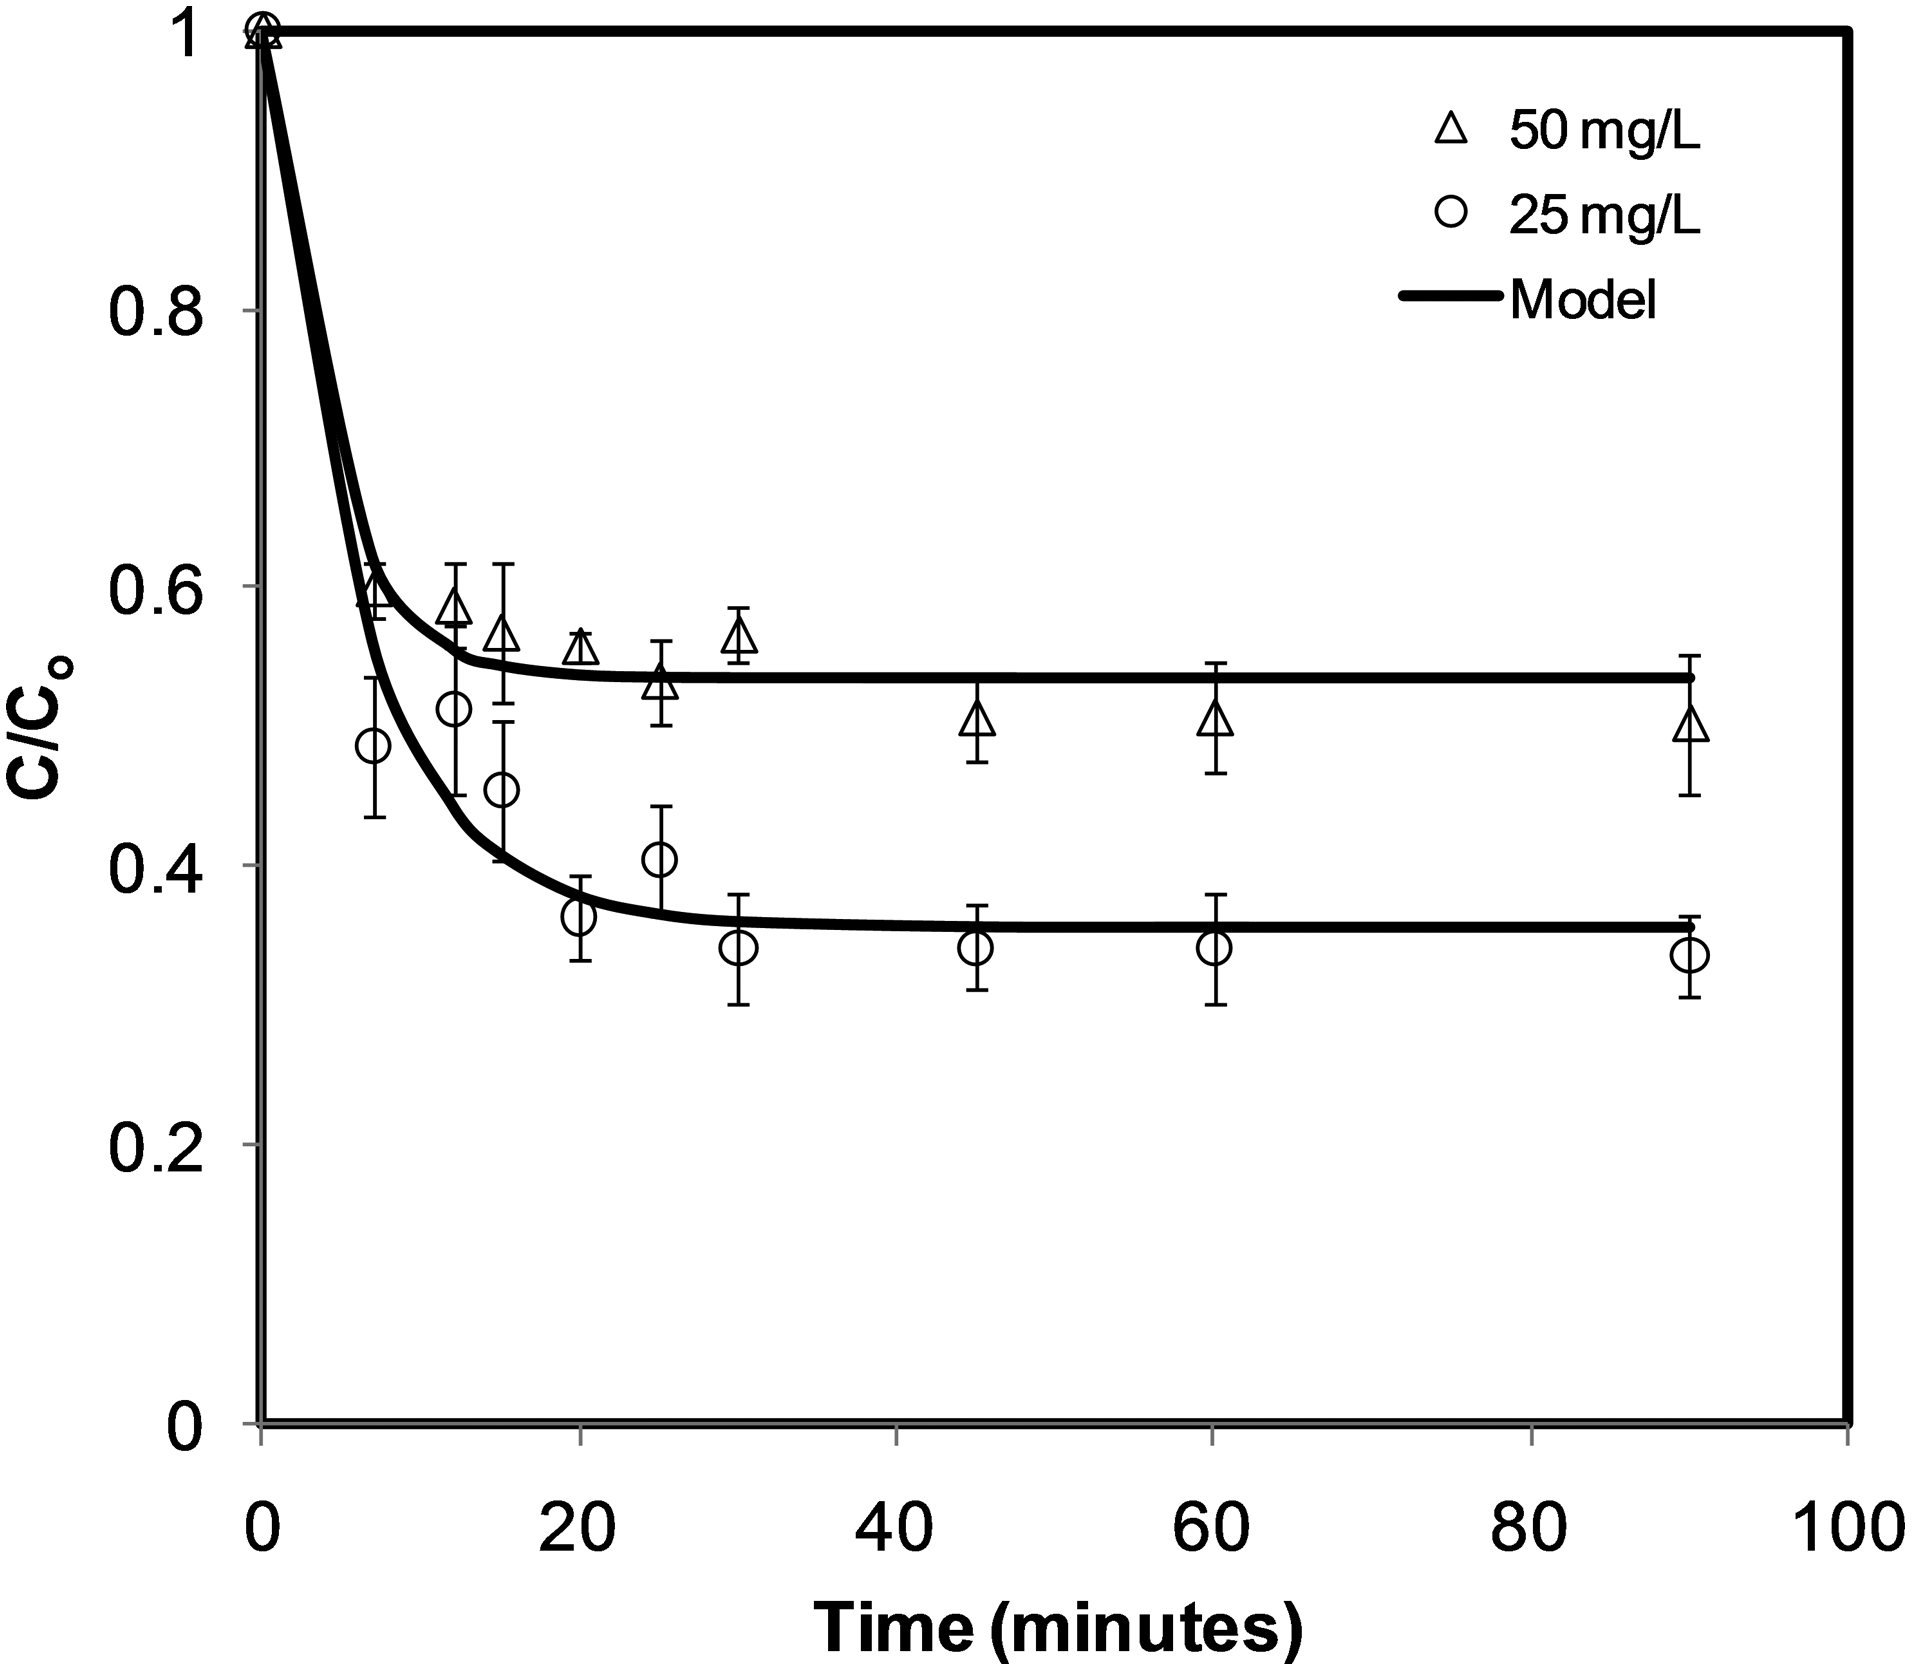
Adsorption kinetics of MB onto goethite nanoparticles at different initial concentrations. Adsorbent dose: 10 g/L; shaking rate: 200 rpm (Innova 40 temperature incubator); pH: 6.62; T: 298K. Points are experimental data, and the solid lines are from the external mass transfer model [Eq. (12)].
Desorption of MB
As the adsorption of MB onto goethite nanoparticles is pH dependent and favorable at high pH, desorption of MB was achieved by decreasing the pH of solution through the addition of an acid (e.g., nitric acid [HNO3]). Insignificant desorption was achieved by adding pure water, without HNO3. However, MB was completely desorbed through the use of a very low concentration of HNO3 (5 mM), independent of the adsorbed amount of MB. This finding supports the idea that adsorption of MB onto goethite nanoparticles is reversible, as a result of weak bonding between the adsorbent active sites and the adsorbate. It is worth noting that, as in the adsorption process, MB desorption was achieved within approximately 20 minutes. This supports the theory that adsorption-desorption is occurring on an external surface.
Conclusions
In this study, goethite nanoparticles were employed for adsorptive removal of MB from wastewater. The adsorption isotherm of MB onto goethite nanoparticles was a Langmuir type, suggesting monolayer coverage. Adsorption increased with the increase of the initial concentration of MB, temperature, and solution pH. Adsorption kinetics showed that equilibrium was achieved in <20 minutes. The kinetic external mass transfer model fit well with the kinetic results of MB adsorption and provided reasonable values for the overall volumetric mass transfer coefficients. The thermodynamic studies showed that the adsorption of MB onto goethite nanoparticles was spontaneous, thermodynamically favorable, and endothermic in nature. MB was completely desorbed from the surface of goethite nanoparticles in a very short time by the addition of low concentration HNO3. This study shows that goethite nanoparticles can serve as an excellent adsorbent for organic contaminants present in wastewater.
Nomenclature
C, concentration of methylene blue in the solution at any time (mg/L)
Cads, amount of methylene blue adsorbed onto the nanoparticles (mg/L)
Cdes, amount of methylene blue released into the aqueous solution (mg/L)
Ce, equilibrium concentration of methylene blue in the solution (mg/L)
Co, initial concentration of methylene blue in the solution (mg/L)
ΔGo, standard Gibbs free energy change (kJ/mol)
ΔHo, standard enthalpy change (kJ/mol)
K, adsorption equilibrium constant (dimensionless)
KF, Freundlich isotherm constant (mmol/g)(L/mmol)1/n
KL, Langmuir isotherm constant (L/mmol)
m, mass of FeOOH nanoparticles (g)
1/n, Freundlich heterogeneity factor (unitless)
Q, amount of methylene blue adsorbed at any time (mg/g)
Qe, amount of methylene blue adsorbed at equilibrium time (mg/g)
Qm, maximum adsorption capacity of methylene blue (mg/g)
R, ideal gas constant (R=8.314 J/mol.K)
R(%), recovery efficiency of methylene blue
ΔSo, standard entropy change (J/mol.K)
V, total volume of aqueous solution (L)
Subscripts
ads, adsorption
des, desorption
e, equilibrium
F, Freundlich
L, Langmuir
m, maximum
o, initial
pzc, point of zero charge
Footnotes
Author Disclosure Statement
No competing financial interests exist.