
Abstract
Abstract
A composite membrane composed of iron oxide and polyvinyl alcohol (PVA) was investigated as an alternative electrolyte material for proton exchange membranes (PEMs) in fuel cells using hydrogen as a fuel. Acetic acid (AA)-stabilized lepidocrocite (γ-FeOOH) nanoparticles and goethite (α-FeOOH) nanoparticles (ferroxane) were mixed with dissolved PVA and air-dried to fabricate the PEMs. The ferroxane–PVA composite membrane showed higher proton conductivity than goethite–PVA composite membrane. However, the proton conductivities of the ferroxane–PVA composite membrane decreased as PVA content in the composite membranes increased. Fourier transform infrared spectroscopy analyses of the ferroxane–PVA composite membrane showed that a large portion of AA groups on the surface of ferroxane nanoparticles was lost when mixed with PVA. The tensile force resistance of the composite membrane was much higher compared with ferroxane-derived ceramic membranes.
Introduction
Besides organic polymer membranes such as Nafion, several kinds of inorganic ceramic membranes have been fabricated and tested in the PEMFC system, such as carboxylate-FeOOH (ferroxanes) membranes and silica glass membranes. Ferroxane membranes have shown great potential in the application of PEMFC because of their high proton conductivity (Tsui et al., 2007). With a conductivity comparable to that of Nafion membranes at high relative humidity (RH), the ferroxane-derived membranes are also relatively insensitive to humidity, even at values as low as 33% (Tsui et al., 2007). Also, ferroxane membranes have very good thermal stability and present the possibility of operation at temperatures in excess of those currently limiting Nafion use. Finally, ferroxane membranes can be fabricated in aqueous solutions, thereby presenting a relatively environmentally benign and low-cost process for making fuel cell membranes (Rose et al., 2002).
However, the ferroxane membranes are extremely brittle, with low compression resistance. This is currently a key limitation in applying these membranes to large-scale systems. Polyvinyl alcohol (PVA) is a widely used polymeric stabilizer and binder in the synthesis of organic–inorganic composite materials. A PVA–ferroxane composite might yield flexible and compression-resistant membranes. However, the impact of such a composite on proton conductivity must also be investigated. Ferroxane particles can be stabilized by adsorbing PVA as a capping agent, which can prevent aggregation of ferroxane particles (Kickelbick, 2007), thus increasing the chemical stability of the ferroxane membranes. In this work, we explore proton conductivity and mechanical properties of novel ferroxane–polymer composites as a means of improving ductility and compression resistance of the ferroxane-derived membranes.
Materials and Methods
Preparation of ferroxane nanoparticles
A 500 mL of 0.2 M NaOH solution (Sigma-Aldrich Inc., St. Louis, MO) was mixed with 500 mL of 0.12 M FeCl2·4H2O solution (MP Biochemicals, Solon, OH). An [FeCl2·4H2O]/[NaOH] ratio of 0.6 was used, which was favorable for the formation of pure lepidocrocite (Refait and Genin, 1993). The mixture was thoroughly aerated with an air bubble stone and stirred at a speed of 1,000 rpm for at least 12 h to completely oxidize FeCl2·4H2O to lepidocrocite. The solution was then dried out in the oven (Fisher Scientific, Pittsburgh, PA) at 80°C to get lepidocrocite particles. Lepidocrocite particles were redissolved in deionized (DI) water and reacted with pure acetic acid (AA; EMD Chemicals, Gibbstown, NJ) at an [Fe/AA] ratio of 1.5 (Refait and Genin, 1993). The solution was stirred at room temperature overnight and centrifuged at 20,000 rpm for 2 h to remove coarse particles (Refait and Genin, 1993). Then, the supernatant was oven-dried at 80°C to obtain pure lepidocrocite-derived ferroxane nanoparticles. To prepare for goethite-derived ferroxane nanoparticles, 1.5 g of granular goethite was dissolved in 50 mL of DI water and the nanoparticle production procedures were the same as the procedures to produce lepidocrocite-derived ferroxane nanoparticles.
Fabrication of ferroxane–PVA composite membranes
A 30 g/L PVA solution was prepared by dissolving 3 g of PVA powder (Fisher Scientific, Rochester, NY) in 100 mL of DI water. The mixture was stirred at 500 rpm overnight to completely dissolve the PVA. The solution was divided in four beakers (20 mL solution each) and different amounts of ferroxane were added to each beaker to produce samples with various PVA:Fe mass ratios of 0, 2:3, and 1:4. The mixtures were stirred at room temperature for 2 h to ensure complete ferroxane dispersal. The solutions were then air-dried in Petri dishes at room temperature to yield ferroxane–PVA composite green body membranes. The thicknesses of these composite membranes ranged from 0.003 inch (7.62×10⁻³ cm) to 0.01 inch (0.0254 cm).
Characterization methods
Chemical bonds in ferroxane green body, ferroxane ceramics after sintering, pure PVA, and ferroxane–PVA composite (green body) membranes were determined by attenuated total reflectance–Fourier transform infrared spectroscopy (ATR–FTIR; NexusTM 670 spectrometer; Nicolet Instrument Corporation, Madison, WI) with a Smart Golden GateTM ATR bridge. Spectra were collected over wave numbers ranging from 4,000 to 650 cm−1 with an average of 64 scans at a resolution of 4 cm−1 (Tsui et al., 2007) and analyzed with Omnic 5.1 software (Nicolet Instrument Corporation). Note that only lepidocrocite-derived composite membrane samples were tested.
Surface morphology of ferroxane green body, ferroxane ceramics after sintering, pure PVA, and ferroxane–PVA composite membranes was investigated using scanning electron microscope (SEM; FEI XL30 SEM-FEG, FEI, OR). Samples were attached to a circular copper plate with the use of carbon tape and were sputtered with platinum to form a thin platinum layer on the surfaces of samples, so as to provide a conductive surface for imaging. Note that only lepidocrocite-derived composite membrane samples were tested.
Tensile resistance of the membrane samples was measured with the use of a Dynamic Mechanical Analyzer (Tinius Olsen 1000; Tinius Olsen Inc., Horsham, PA). Dumbbell-shaped membrane samples were measured by width and thickness and were clamped into the instrument. Tensile force and strain were recorded by a computer connected to the instrument to obtain stress–strain curves. The Young's modulus (E) was obtained from the slope of the tangent at origin of the stress–strain curve and the ultimate strength (σB) and strain (εB) were noted at the point where the sample broke. Note that only lepidocrocite-derived composite membrane samples were tested.
Electrochemical impedance spectroscopy (EIS) was used to quantify the proton conductivity of the membranes. In the EIS measurement, a Nyquist plot (the real component of the system impedance versus the negative of the imaginary component of the system impedance at various current frequencies) was obtained as described in a previous study (O'Hayre, 2006) and the resistance of the proton exchange membrane (PEM), Rs, was obtained from a fitting exercise where the system was modeled as a corresponding equivalent circuit. In the Nyquist plot, the resistance of the PEM, Rs, is the value at first point where the Nyquist curve intersects with x coordinate. The proton conductivity of the membrane, σ, can be calculated with the value of Rs (Tsui et al., 2007) (Fig. 1 and Appendix Fig. A1):
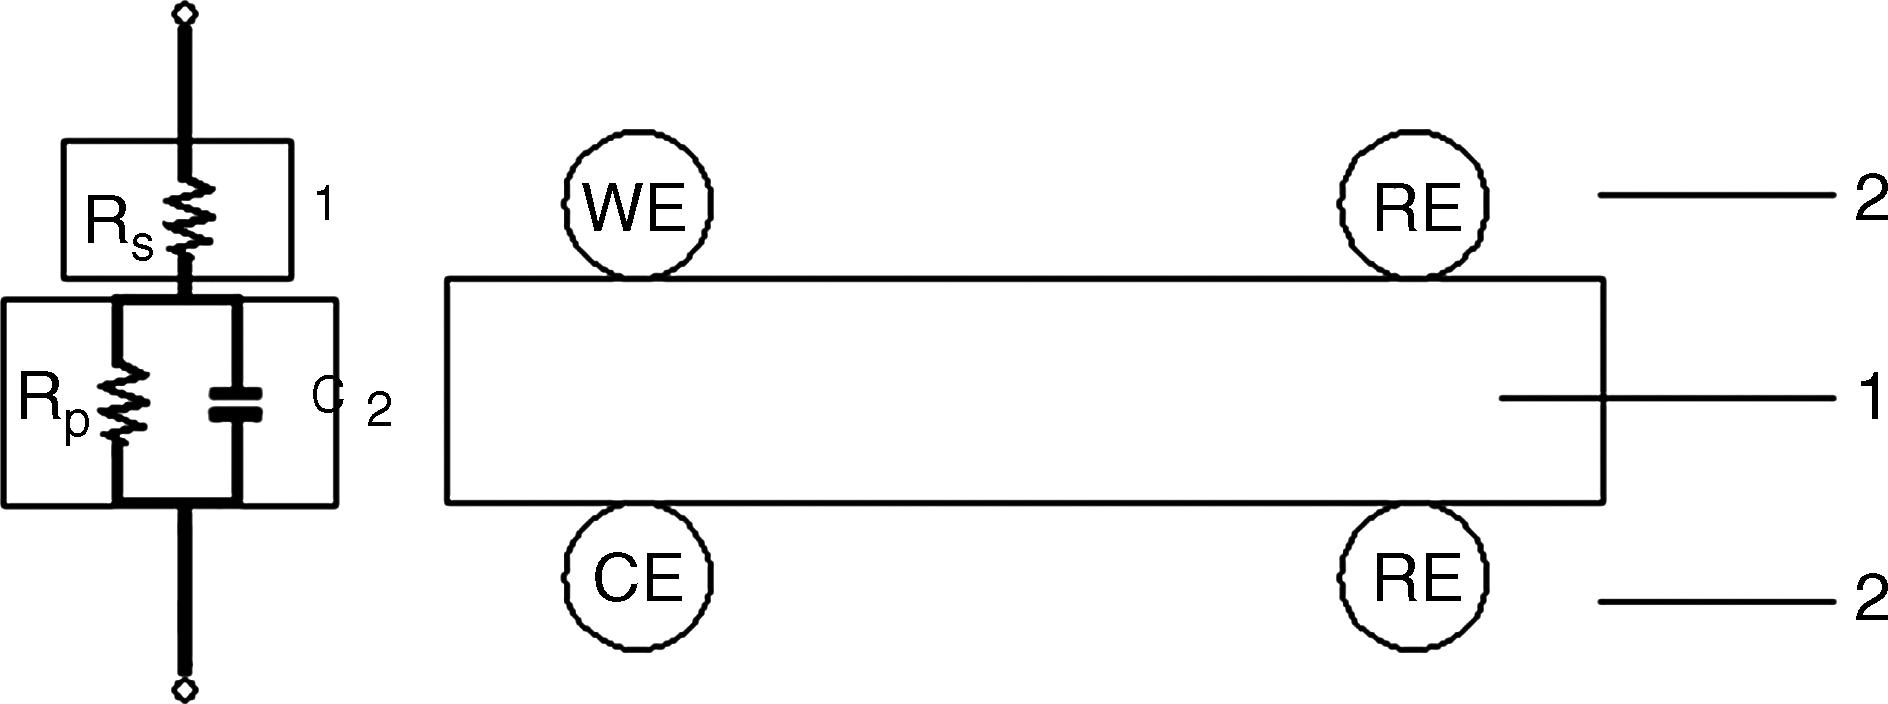
Equivalent circuit for the membrane impedance measurements (modified from Lee et al., 2005). 1, Proton-conductive membrane sample; 2, electrodes connecting potentiostat (WE, working electrode; CE, counter electrode; RE, reference electrode). If a two-probe method is applied, WE and RE on the same side will coincide and the same principle is applied to CE and RE on the other side. Resistance of the sample, resistance of the interface between the sample and the electrodes, and capacitance between electrodes correspond to Rs, Rp, and C, respectively.
where l is the thickness of the membrane, Rs is the resistance of the membrane, and A is the cross-sectional area of the membrane. Rs is obtained at the left intersection between the semicircle Nyquist plot and x coordinate (Somasundaran, 2006).
EIS measurements were conducted using a Gamry Potentiostat (Gamry Instruments, Inc., Warminster, PA) with program EIS 300 in Gamry Framework software system. In this measurement system, the two-probe method was applied and one reference electrode was replaced by a working electrode. Membrane samples were clamped with two plastic cylinders covered with aluminum foils and gold was sputtered on both sides of the sample with the use of a Denton Desk IV vacuum sputter coater. Copper wires were attached to aluminum foils and connected with the electrodes of the potentiostat. The schematic diagram of the structure is represented in Fig. 2.
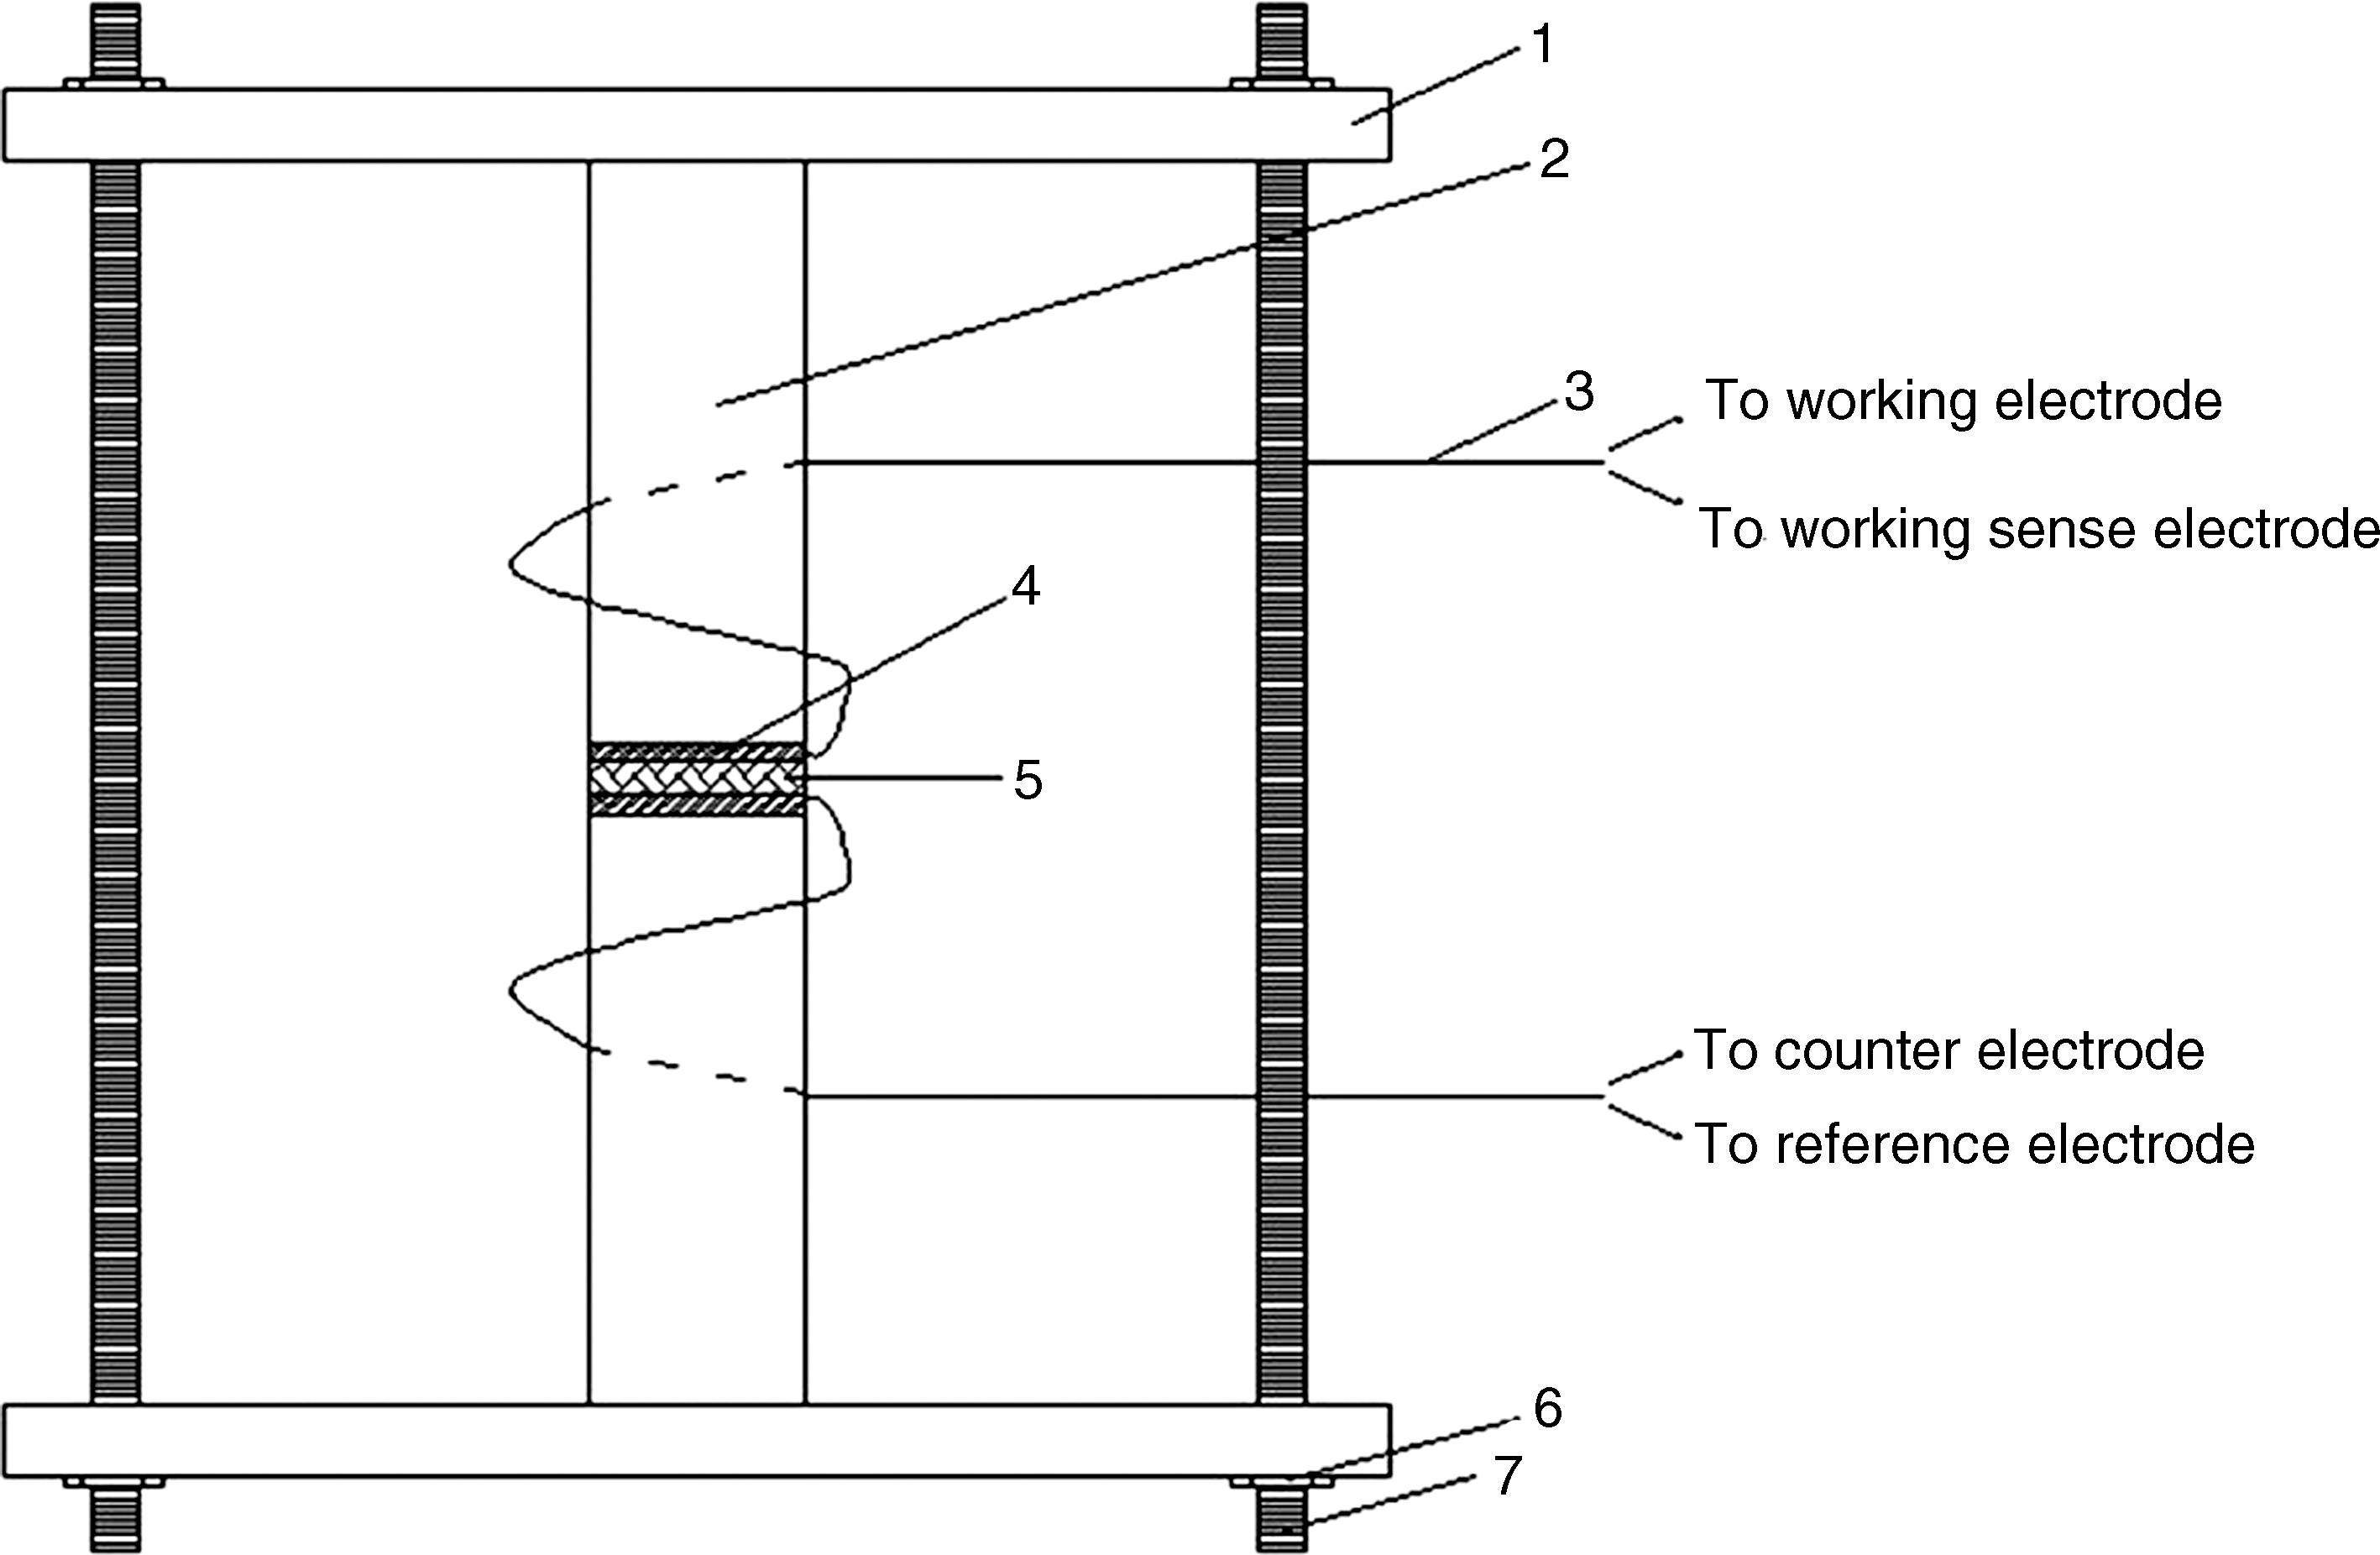
The schematic diagram of the membrane impedance measurement system. 1, Plastic plate; 2, plastic cylinder; 3, copper wire; 4, aluminum foil; 5, membrane sample; 6, steel nut; 7, steel screw.
Measurements over different values of RH were obtained by placing the assembly in sealed plastic cells that communicated with various saturated salt solutions for 12 h. Membrane samples were put in the cells and were equilibrated with the headspaces over the solutions in cells. The saturated salt solutions were MgCl2·6H2O for 33% RH, (NH4)2SO4 for 81% RH, K2SO4 for 97% RH, and Millipore water for 100% RH (Tsui et al., 2007). All experiments were conducted at 298 K.
Results and Discussion
Chemical bonds in ferroxane–PVA membranes
As shown in Fig. 3, for ferroxane green body (Fig. 3a), strong absorption at wave numbers 3383.5 cm−1 (①) and 3223.2 cm−1 (②) can be observed, which correspond to the existence of -OH stretching on the surface of ferroxane and a large amount of water adsorbed on the surface. The strong absorption at wave number 1640.9 cm−1 (③) (C=O stretching of quinines or ketones) (Gu et al., 1994) corresponds to the AA group. Noticeably, a strong absorption at 1610.9 cm−1 (④) is also observed, which represents a shift of C=O absorption range that occurs due to the complexation of -COO- functional groups with the iron oxide surfaces (Gu et al., 1994). If the ferroxane samples are sintered to a complete conversion to ceramic iron oxide, the internal structure of ferroxane will change. Compared with ferroxane green body, the ferroxane samples sintered for 13 h (Fig. 3b) have a much weaker absorption at -OH absorption range and C=O absorption range, which shows clearly that both the water and AA groups will be desorbed from the iron oxide surface. However, the ferroxane samples sintered for 13 h can recatch water in a humid environment very easily, because of the removal of AA group at high sintering temperature (Tsui et al., 2007).
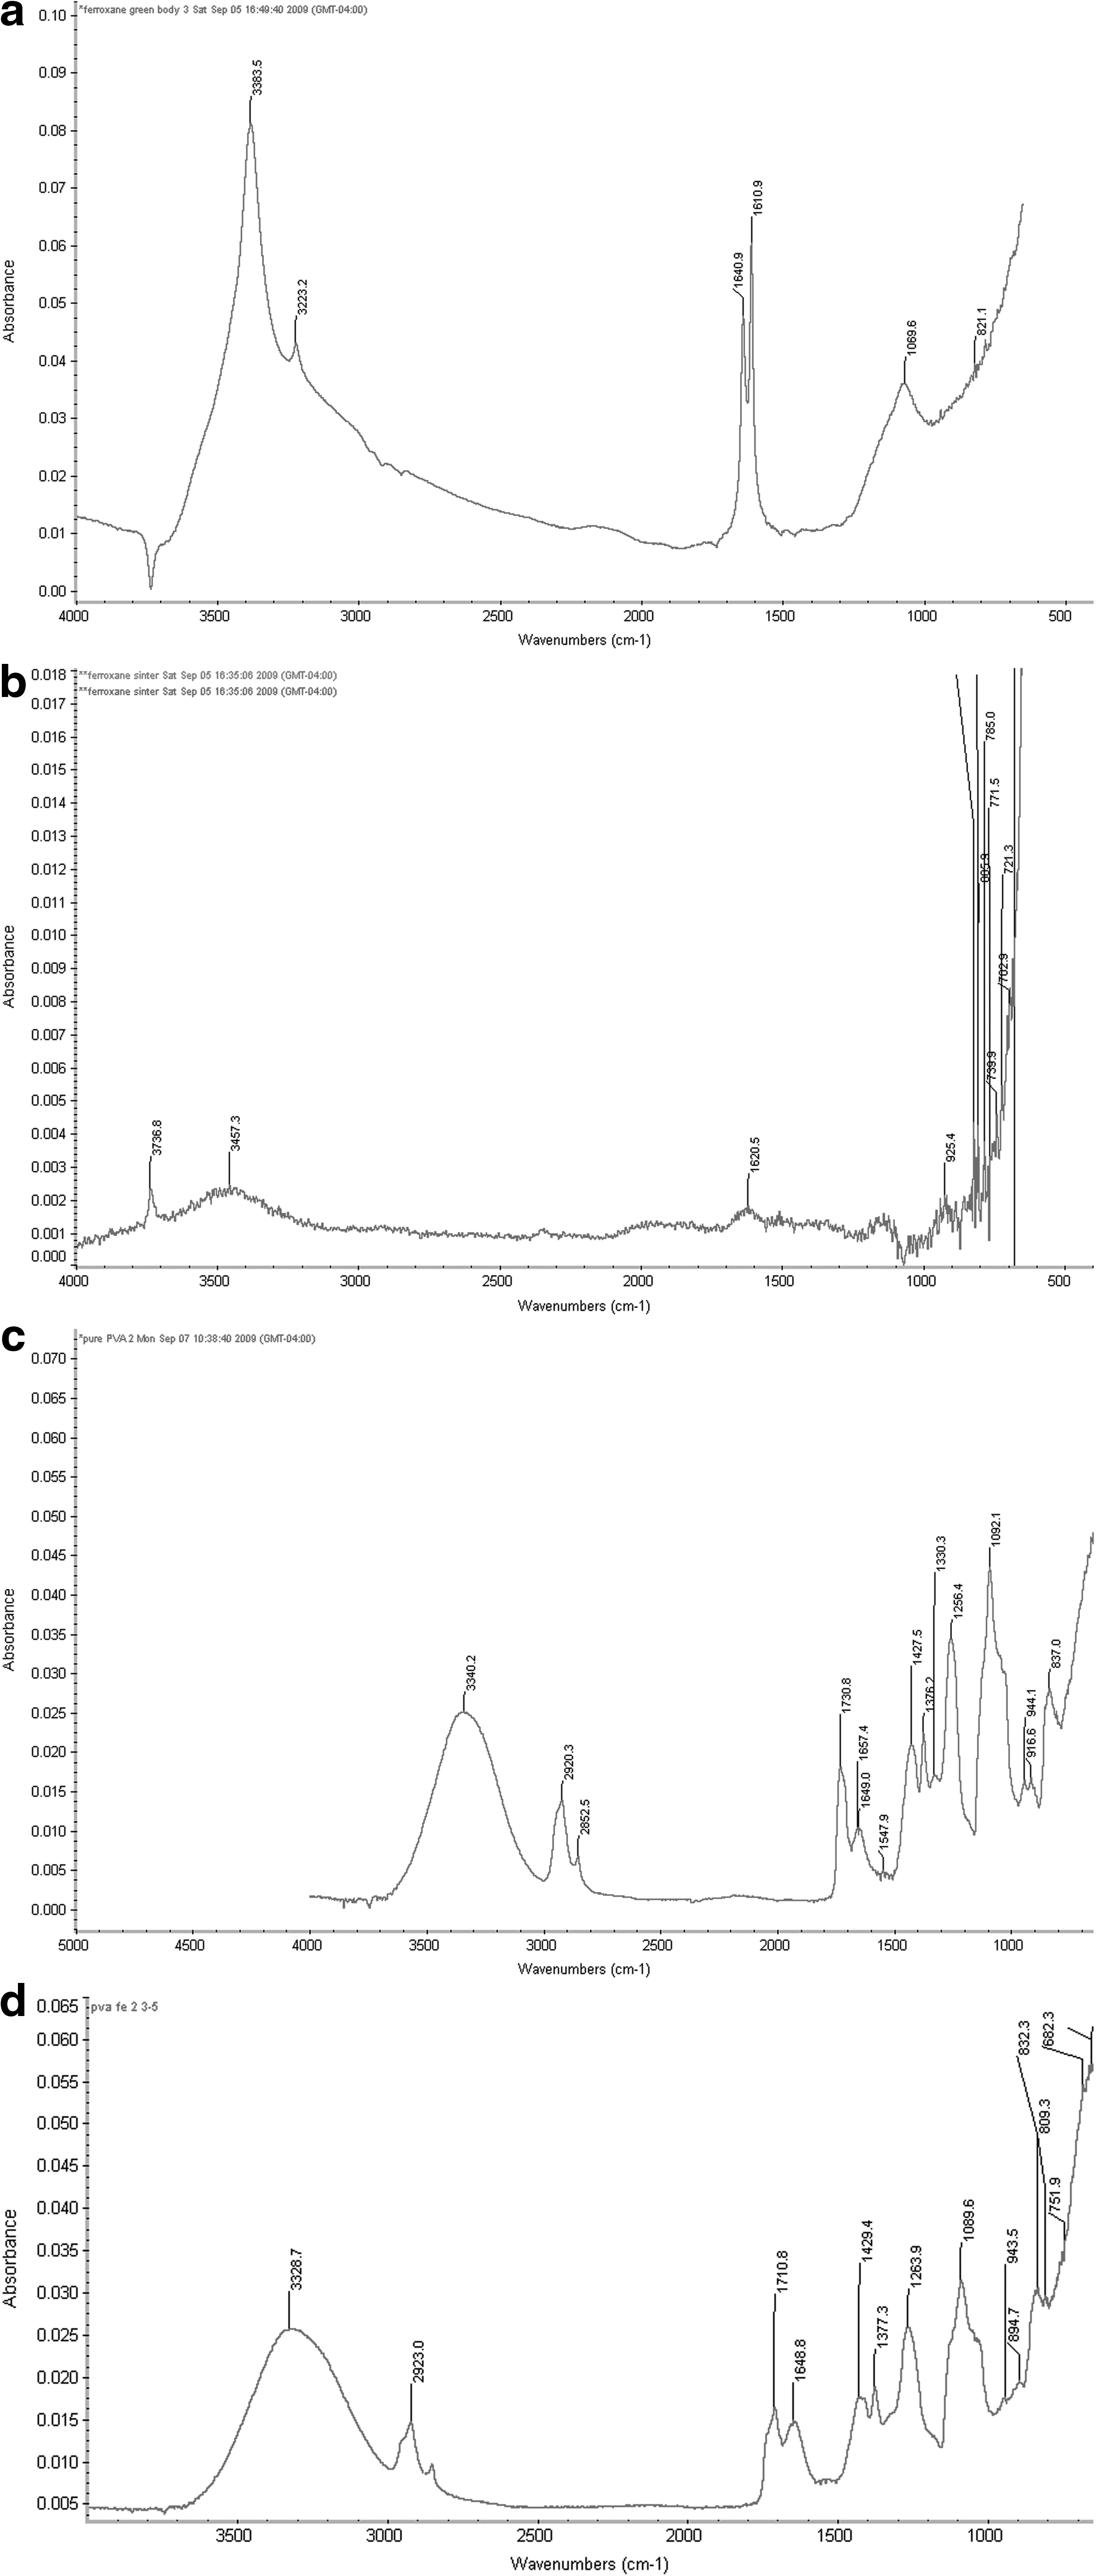
Attenuated total reflectance–Fourier transform infrared spectroscopy spectra of the ferroxane green body
In contrast with the inorganic ferroxane-derived ceramics, both the pure PVA membrane and PVA–ferroxane composite membranes had similar attenuated total reflectance–Fourier transform infrared spectroscopy images because of the dominant role of PVA in both pure PVA and the composite membrane. For pure PVA (Fig. 3c), the main absorption bonds are in the region of 3000–3600 cm−1 (①, hydroxyl band), 2800–3000 cm−1 (②, CH/CH2 stretching vibrations), 1730 cm−1 (③, C-O stretching), and 1000–1260 cm−1 (④, bands related to CH/CH2 deformation vibrations and band of CO stretching vibrations) (Ilcin et al., 2010). Moreover, a weak absorption bond around 1640 cm−1 (⑤, C=O stretching bond) can be seen, which is mainly due to the existence of residual acetyl content (Upadhyay and Bhat, 2004) and dehydration of the PVA, thus favoring the formation of C=C bonds and C=O bonds (Ilcin et al., 2010). For the ferroxane–PVA composite membrane samples (Fig. 3d), the intensity of C=O stretching bond absorption was expected to be much greater than that of pure PVA, as a strong absorption corresponding to C=O stretching bond was observed when ferroxane green body was tested. However, the absorption of C=O stretching bond increased only slightly (at 1640.5 cm−1 in Fig. 3d) for the ferroxane–PVA composite sample. This suggests that as a result of mixing pure ferroxane and PVA, some AA groups on the surface of ferroxane have been removed. There are two possible mechanisms to explain the removal of AA groups. The first mechanism is that AA groups react with water and will be desorbed during the mixing process with PVA, leaving vacant positions to be occupied by new hydroxyl groups (Fig. 4a); the second mechanism is that hydroxyl groups of PVA react with acetic groups on the ferroxane surface to displace the acetic groups (Fig. 4b).
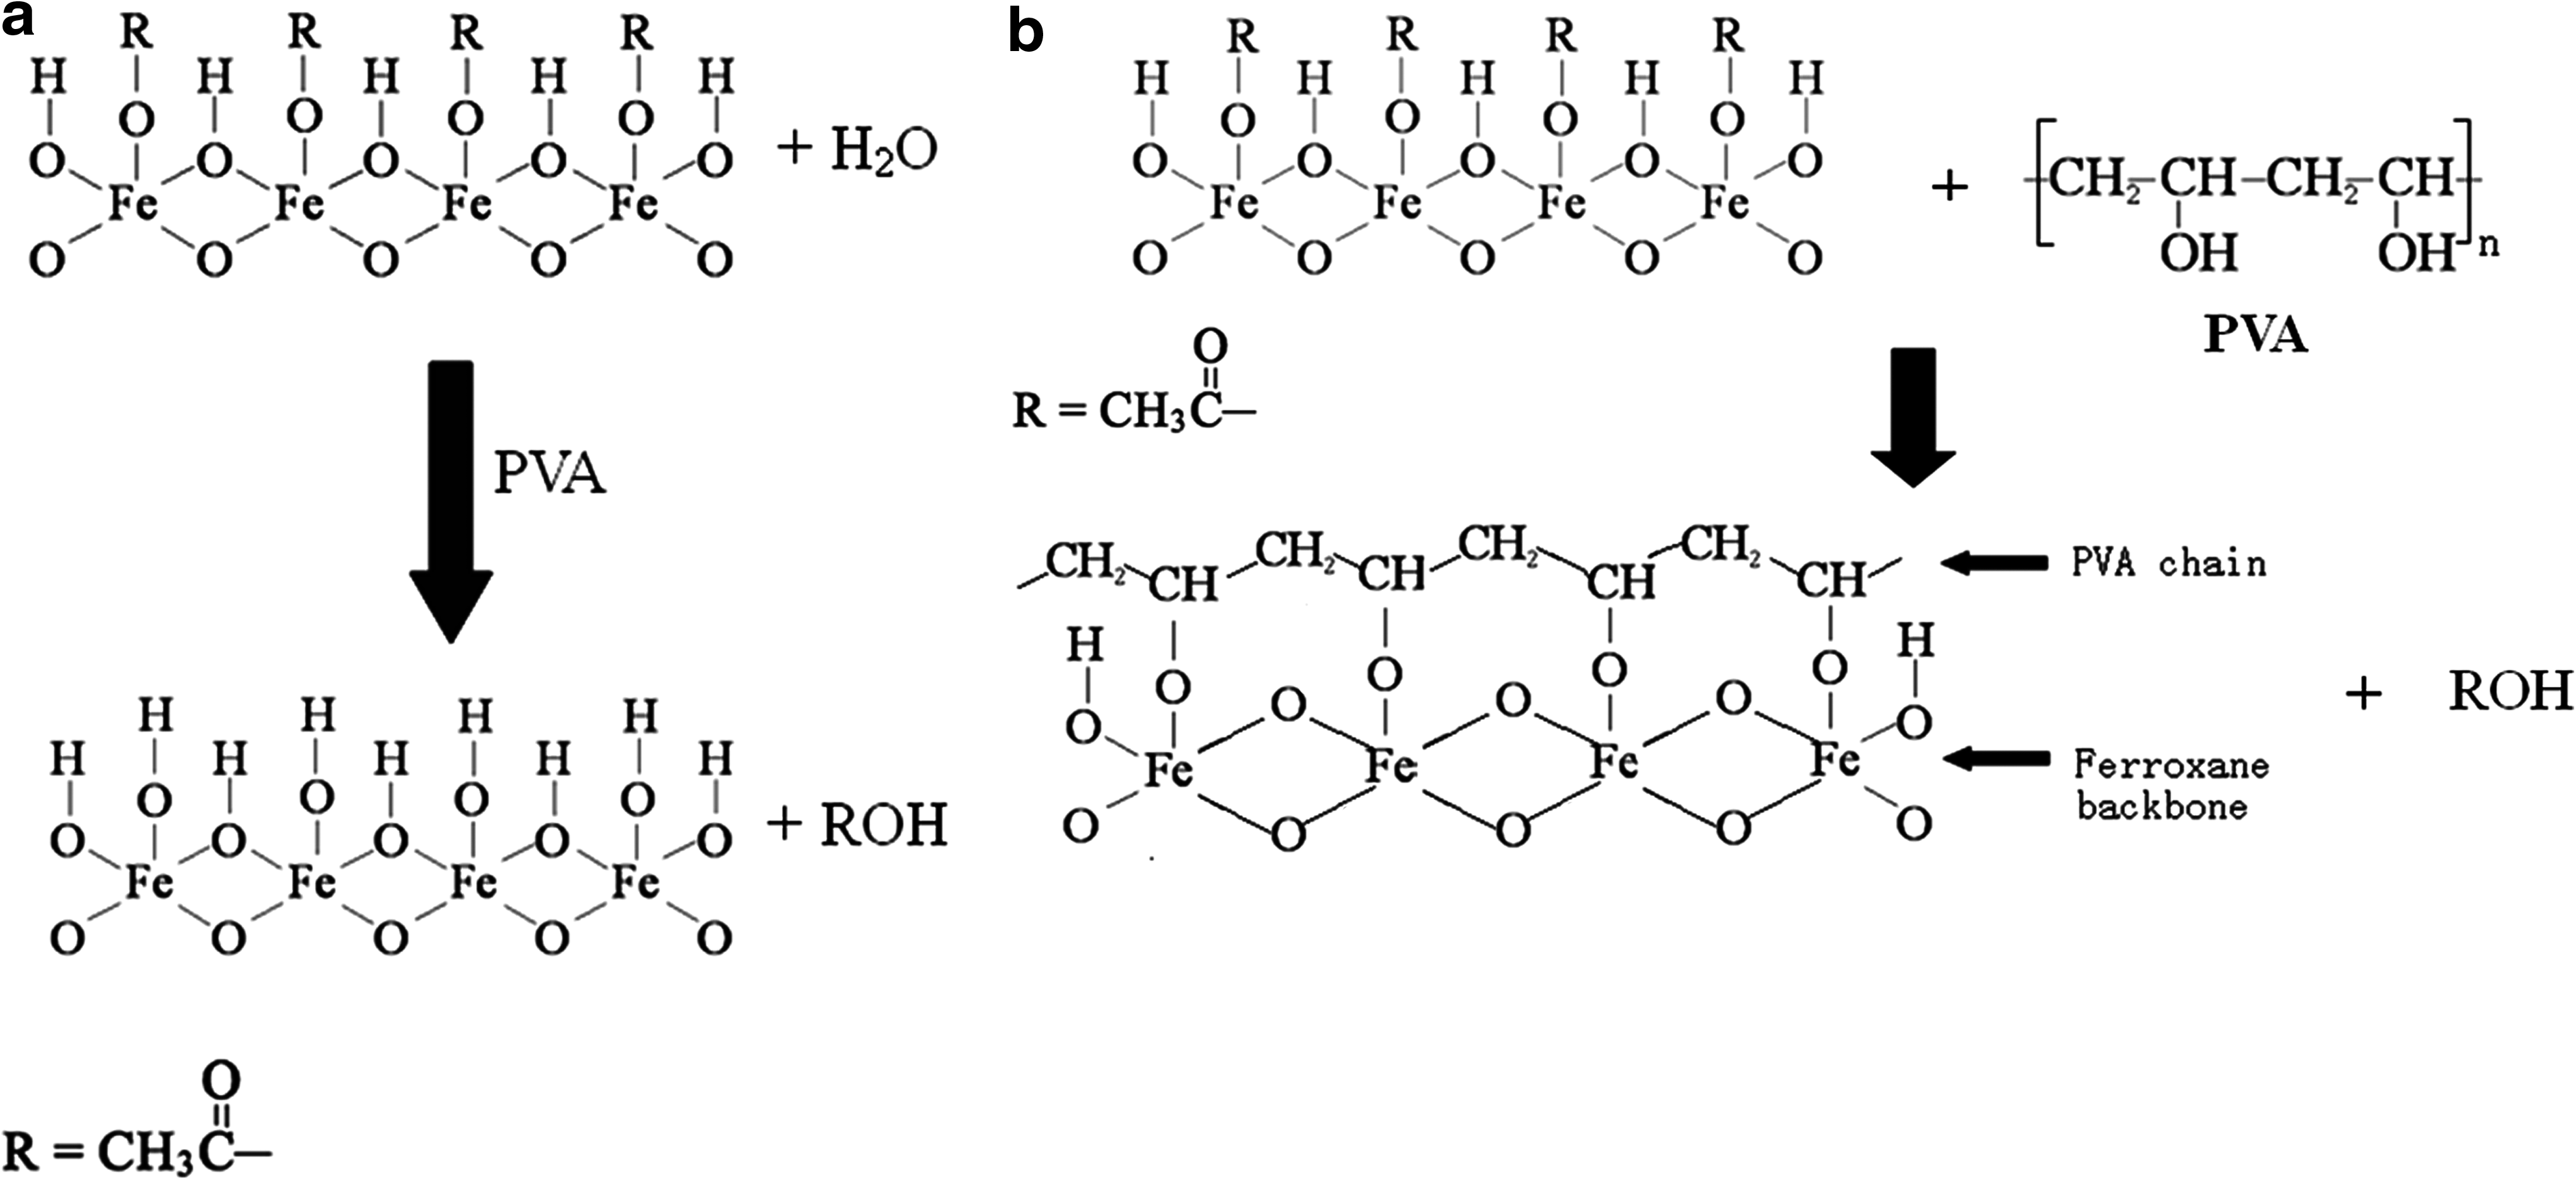
Two possible mechanisms for removal of acetic group from ferroxane surface in the ferroxane–PVA composite membrane.
In the first mechanism (Fig. 4a), PVA acts as a catalyst to promote the reaction. However, if the acetic groups are substituted by hydroxyl groups, the intensity of the absorption band near 3330 cm−1 should have increased, which was not observed. Second, an increase of hydroxyl groups on the ferroxane surface should lead to a higher proton conductivity of the ferroxane–PVA composite membrane compared with the green body, which as discussed below was not the case (please refer to section Proton conductivity). In the second mechanism (Fig. 4b), hydroxyl groups of PVA react with acetic groups on the ferroxane surface to displace the acetic groups. This mechanism would yield new bonds between PVA and ferroxane.
The second mechanism is well supported by our experimental results. First, the ferroxane–PVA composite membrane has a higher ultimate breaking strength than the pure PVA membrane, which is consistent with the formation of ferroxane–PVA crosslinking structure. Second, no significant proton conductivity difference between ferroxane–PVA composite membrane and ferroxane green body was observed, because the substitution reaction between PVA and ferroxane does not change the number of hydroxyl groups on the surface of ferroxane.
Surface morphology of ferroxane–PVA membranes
SEM image of ferroxane green body shows large amorphous deposits on the surface (Fig. 5a), which are no longer present after sintering and appear to correspond to a loss of AA groups during the sintering process (Fig. 5b). Further, during the sintering process, the ferroxane particles are sintered together and the membrane becomes denser than the ferroxane green body. In contrast, the ferroxane–PVA structure shows a PVA base decorated with ferroxane nanoparticles, not only on the top surface but also on the cross-section (Figs. 5c and 6a, b). The ferroxane nanoparticles on the cross-section of the composite membrane are scattered from each other and thus they cannot form integrated channels for proton conduction through the membrane. Some crystals can still be seen in the cross-section of ferroxane–PVA membrane (Fig. 6b), but both the size and quantity of the crystals in the composite membrane are much smaller than those in pure ferroxane green body, which shows a reduction of AA groups during the mixture process of ferroxane and PVA solution.

SEM images of top surfaces of pure ferroxane green body

SEM images of cross-sections of pure PVA membrane
Tensile resistance of ferroxane–PVA membranes
The stress–strain curve of membrane samples is displayed in Fig. 7 and the mean values of ultimate breaking strength (σB), ultimate breaking strain (εB), and tensile modulus (E) of membrane samples are shown in Table 1. It is clear that membranes based on PVA matrix have a larger breaking strength than Nafion membrane and thus display a stronger tensile resistance. A higher content of ferroxane in the ferroxane–PVA composite membrane appears to favor a stronger tensile resistance. To explain that result, we can make a postulation that there is formation of Fe-O-C bonds in PVA–ferroxane composite membranes and the existence of those crosslinked bonds could increase the tensile resistance of the composite polymer. The existence of ferroxane in the composite membrane tend to shift the properties of organic polymer material to inorganic material, which tends to be resistant to tensile force (high σB) and also tends to have a lower elasticity (low εB). However, the elasticity of the composite membrane with highest ferroxane content (PVA:Fe=1:4, εB=0.381) is still comparable to that of a Nafion membrane (εB=0.417).

Stress–strain curve of ferroxane–PVA composite membrane samples, Nafion 117, and pure PVA.
PVA, polyvinyl alcohol.
The content of ferroxane in the composite membrane also helps to reinforce the stiffness of the membrane (Table 1). The value of E (PVA only) is only 120.0 MPa, but values of E for the ferroxane–PVA samples are much higher, with values of 670.2 MPa for PVA:Fe=2:3 membrane and 649.1 MPa for PVA:Fe=1:4 membrane. The stiffness of Nafion membrane is quite low (E=100.4 MPa) and is not comparable to ferroxane–PVA composite membranes. In summary, ferroxane–PVA composite membranes exhibited promising mechanical properties.
Proton conductivity
In the previous study (Tsui et al., 2007), the conductivity of ferroxane sintered at 300°C is 2.7×10⁻² S/cm at an RH of 81% and is comparable to the conductivity of Nafion membrane, which is 2.8×10⁻² S/cm at an RH of 80% (Sone et al., 1996). For the lepidocrocite-derived composite membranes, the proton conductivity of the composite membranes decreased as PVA content in the membranes increased (Fig. 8). The ferroxane–PVA membranes (i.e., PVA:Fe=1:4 or 2:3) had higher proton conductivities than the pure PVA membrane. The PVA membrane with higher ferroxane content (i.e., PVA:Fe mass ratio=1:4) showed higher proton conductivity than the PVA membrane with lower ferroxane content (i.e., PVA:Fe=2:3). Compared with the ferroxane membrane sintered at 300°C (ranging from 1.29 to 2.65×10⁻² S/cm) (Tsui et al., 2007), the proton conductivity of ferroxane–PVA membranes was low and drops significantly as RH decreases. This latter observation is attributed in part to the activity of AA groups on the ferroxane. When the AA groups are present, the transfer of protons among hydroxyl groups will be hindered and proton conductivity is lower. When the ferroxane membrane is sintered at 300°C, AA groups are lost during the sintering process and the hindering effect is extinguished (Tsui et al., 2007). Although these proton conductivity results were not obtained at normal operating temperatures of PEMFC (60°C–80°C) (Barbir, 2005), the composite membrane should have higher proton conductivity at 60°C–80°C than the conductivity obtained at room temperature, because proton mobility can dramatically increase with the increase of temperature. As long as the temperature is below the dehydration temperature (usually around 100°C), the proton conductivity of the PEM would always increase with the increase of temperature (O'Hayre, 2006).

Proton conductivities of membrane samples tested at various relative humidities. (•) PVA:ferroxane (lepidocrocite-derived)=2:3; (○) PVA:ferroxane (lepidocrocite-derived)=1:4; (▾) ferroxane (lepidocrocite-derived) without sintering; (▵) only PVA without sintering; (▪) PVA:ferroxane (goethite-derived)=2:3.
For the goethite-derived composite membrane (Fig. 8), the proton conductivities of the membrane were extremely low at low RHs. This can be explained by several possible reasons. First, the average particle size of goethite-derived ferroxane is larger than that of lepidocrocite-derived ferroxane. After reacting with AA, the particle size of lepidocrocite-derived ferroxane was averaged on 60.2±1.2 nm, and the average particle size of goethite-derived ferroxane was 234.0±11.9 nm. A larger particle size means a smaller specific surface area for proton conduction. Second, the density of hydroxyl (-OH) group on the surface of goethite is smaller than that of lepidocrocite. The number of -OH groups on unit goethite surface (nm2) ranges from 0.8 to 7.3 (Sigg and Stumm, 1981; Hansmann and Anderson, 1985; Lovgren et al., 1990; Torrent et al., 1990), and the number of -OH groups on unit lepidocrocite surface (nm2) is in the range of 1.68 to 9.6 (Waite and Morel, 1984; Davies and Morgan, 1989). Therefore, the lepidocrocite-derived ferroxane surface may be favorable for the formation of hydrogen bonds and thus promotes the adsorption of water molecules on the surface of ferroxane. Last but not least, the morphology of goethite crystals and positions of hydroxyl groups on goethite-derived ferroxane surface may be favorable for the formation of hydrogen bonds between the hydroxyl groups of ferroxane and PVA, which deteriorates the capacity of those hydroxyl groups to form hydrogen bonds with water molecules and thus decreases the number of water molecules adsorbed on ferroxane and PVA surfaces.
Potential problems associated with the use of the ferroxane–PVA membranes in a PEMFC
Although the composite membrane has shown promising mechanical stability and proton conductivity comparable to that of a commercial Nafion membrane when RH is high, some potential problems that hinder the membrane for commercial applications remain unsolved. First, the addition of PVA greatly reduced the proton conductivity of the composite membrane when RH is low. Because of the existence of PVA polymer, the composite membrane cannot be sintered above 100°C and it hinders improvement of proton conductivity. Second, the addition of PVA sacrifices the thermal stability of FeOOH, because the thermal degradation of PVA usually starts at about 150°C (Rudnik, 2008). Therefore, the composite membrane cannot be used under conditions with very high temperature. Third, PVA polymer in the composite membrane can experience oxidative degradation after long-term exposition to certain oxidant (e.g., hydrogen peroxide) generated in the cathode chamber of a fuel cell. Peroxide mainly forms on the surface of the catalyst via the reaction below (Sethuraman et al., 2008):
PVA may react with H2O2 through several possible pathways, including strong oxidation pathway (final products are AA and carbon dioxide), redox-oxidation pathway (the scission of PVA chain and the production of AA), and weak oxidation pathway (the oxidation of hydroxyl groups in PVA chain and subsequently cleavage of the chain) (Staudinger and Zapf, 1940; Kern and Schulz, 1957; Sakurada, 1985). Strong oxidation and redox oxidation reactions are not likely to occur given the conditions of the cathode chamber and weak oxidation may be a problem to cause integrity failure of the PVA-based membrane.
The amount of H2O2 produced in the cathode chamber of a fuel cell depends on many factors, including the cathode potential, oxygen concentration, temperature, and RH (Sethuraman et al., 2008). The production rate of H2O2 becomes low when the cathode potential is about 0.13 V or exceeds 0.6 V. A decrease of oxygen concentration leads to a reduction of H2O2 production rate (Sethuraman et al., 2008). However, both the cathode potential and oxygen concentration are directly related to the performance of the fuel cell and a favorable condition for H2O2 mitigation (e.g., reduction of oxygen concentration) is not favorable for electricity generation of the fuel cell. Therefore, adjustments of other two factors (i.e., temperature and RH) are more feasible.
A relatively high RH can help to further reduce the formation rate of H2O2. If the operation temperature of PEMFC can be maintained at room temperature, the H2O2 production rate is less than 10−10 mol/(cm2 s) (Sethuraman et al., 2008), which is not high enough to induce significant oxidation of PVA. If the fuel cell system has to be operated at high temperature (around 80°C), the RH needs to be raised, so as to compensate the increase of H2O2 production rate. In summary, appropriate control of operation conditions in the cathode chamber is necessary, so as to minimize the oxidative degradation of the composite membrane in the fuel cell.
Conclusions
Significant improvements in the physical properties of a ferroxane-derived membrane were obtained through the addition of PVA to form a composite material. However, the PVA addition results in a decrease in proton conductivity and a loss of the independence of conductivity with decreasing humidity observed for the sintered ferroxane-derived membranes. Appropriate control of operation conditions in the cathode chamber of PEMFC is necessary to reduce the oxidative degradation of PVA when using the composite membrane in a PEMFC. As to the performance of different FeOOH crystal forms in the composite membrane, the proton conductivity of lepidocrocite (γ-FeOOH)-derived composite membrane is much higher than that of goethite (α-FeOOH)-derived composite membrane. At current stage, the proton conductivity of the ferroxane–PVA composite is lower than that of commercial Nafion at low RH and potential approaches to further raise the proton conductivity of the ferroxane–PVA composite need to be specified and tested in the future. Moreover, the operation condition of the cathode chamber needs to be appropriately monitored and controlled when using the ferroxane–PVA composite as PEM in a fuel cell, so as to minimize the oxidation of PVA polymer at cathode side.
Footnotes
Acknowledgments
The authors thank Mr. Yao Xiao and Mr. David Jassby for providing lots of useful information and valuable recommendations, as well as Mr. Matt Brown at Department of BME, Duke University, for providing the tensile force measurement facility and the Shared Materials Instrumentation Facility at Duke University for providing the FTIR, SEM, and Platinum sputtering facilities. This work was supported in part by funding from NSF PIRE program, PERMEANT (OISE-0530174).
Author Disclosure Statement
No competing financial interests exist.