
Abstract
Abstract
Exposure to airborne biological particles, termed bioaerosols, can have adverse effects on human health, such as infectious diseases, acute toxic reactions, and allergies. The search for ways of preventing and curing the harmful effects of bioaerosols has created a strong demand for the study and development of efficient methods of monitoring and controlling them. The ultraviolet aerodynamic particle sizer (UVAPS) system is a promising monitoring device for the real-time detection of airborne microorganisms. Fundamentally, it is an airborne particle counter and spectrometer capable of measuring the fluorescence emitted by living microorganisms measuring 0.5–15 μm. Fluorescence sensitivity of a UVAPS is influenced significantly by the settings of the pulsed UV laser and the photomultiplier tube detector. To measure bioaerosols more precisely using the UVAPS system, the fluorescence baseline should be checked occasionally using nonfluorescent test particles, such as polystyrene latex (PSL) particles. In this research, we demonstrate the adjustment process for obtaining optimized UVAPS fluorescence sensitivity to distinguish between viable particles related to microorganisms and nonviable environmental particles. Using the optimized UVAPS fluorescence settings, the aerosol and fluorescence characteristics of various particles, including viable microorganisms (e.g., Escherichia coli, Bacillus subtilis, and Staphylococcus epidermidis) and nonviable aerosols (e.g., NaCl, multiwall carbon nanotubes, PSL, and fluorescent PSL), can be determined. In addition, the biological culturability of the sampled bacterial particles is compared with their fluorescence percentage measured by the UVAPS.
Introduction
A real-time technique for the rapid detection of airborne microorganisms would find numerous applications in public health problems, military defense systems against bioterrorism, and other biological and environmental issues associated with these microorganisms (Roszak and Colwell, 1987; Chen and Li, 2007; Jung et al., 2010), because such a technique would eliminate the traditional time-consuming processes involved in sampling and particle characterization. Applicable real-time methods for the detection of bioaerosols can be broadly subdivided into three categories: (1) single-particle Raman spectrometry (Chadha et al., 1993; Maquelin et al., 2000; Rösch et al., 2005), (2) single-particle mass spectrometry (Stowers et al., 2000; Fergenson et al., 2004; Czerwieniec et al., 2005; Tobias et al., 2005; Van Wuijckhuijse et al., 2005), and (3) fluorescence spectral analysis (Hill et al., 1995; Pinnick et al., 1995, 1998; Chen et al., 1996; Nachman et al., 1996; Hairston et al., 1997; Cheng et al., 1999; Pan et al., 1999, 2010, 2011; Seaver et al., 1999; Kaye et al., 2000).
The ultraviolet aerodynamic particle sizer (UVAPS, model 3314; TSI) is an airborne particle counter and spectrometer, capable of measuring the fluorescence emitted by living microorganisms. The instrument measures aerodynamic size, number concentration, and fluorescence of airborne particles in the size range of 0.5–15 μm (Fig. 1). Excitation of particles via a pulsed UV laser beam with a wavelength of 355 nm produces fluorescence detected between 420 and 575 nm (Li et al., 1991). Under these conditions, the fluorescence signals of sampled airborne particles arise from biochemical molecules produced by all living cells, specifically nicotinamide adenine dinucleotide, nicotinamide adenine dinucleotide phosphate [NAD(P)H], and riboflavin. Thus, these fluorescent signals are regarded as particular to living microorganisms (Li et al., 1991; Hairston et al., 1997; Ho et al., 1999). Since NAD(P)H is involved primarily in the energy-producing respiratory processes of actively growing cells and in protein biosynthesis (Andersen and Meyenburg, 1977), the fluorescence signals from these molecules could be used to distinguish viable particles (i.e., those related to microorganisms) from nonviable environmental particles. Although the UVAPS cannot be used to identify biological particles at the genus and species levels compared with standard PCR or culture assays, the use of a UVAPS could offer promising real-time information for the rapid detection of airborne microorganisms. The greatest advantage of the UVAPS system is its rapid response to continuously passing aerosols.

Ultraviolet aerodynamic particle sizer (UVAPS) particle measurement.
The feasibility of using a UVAPS to detect viable bioaerosols has been demonstrated in previous studies. UVAPS performance and characteristics have been primarily evaluated in a laboratory setting for aerosols containing marker biological molecules (Agranovski et al., 2004; Agranovski and Ristovski, 2005), and in the real-time measurement for bacteria (Brosseau et al., 2000; Agranovski et al., 2003a, 2003b; Jung et al., 2010) and fungal spores (Kanaani et al., 2007, 2008a, 2008b). In a recent field study of the UVAPS for longer-term ambient measurements, Huffman et al. (2010) investigated the detection and sizing of fluorescent biological aerosol particles in urban and rural continental aerosols.
The fluorescence sensitivity of a UVAPS is influenced significantly by the settings of the pulsed UV laser and the photomultiplier tube (PMT) equipment. At high fluorescence sensitivity, the UVAPS internal fluorescence baseline may include fluorescence measurements from particles that do not contain a fluorophor (Jung et al., 2010). Therefore, the fluorescence baseline should be checked occasionally using nonfluorescent test particles, such as polystyrene latex (PSL) or pure salt (NaCl) particles. However, most previous studies have only reported baseline settings related to UVAPS fluorescence sensitivity in the context of their own experimental purposes, without providing a detailed explanation of the UVAPS sensitivity adjustment process. To arrive at a broader insight into the accurate quantitative evaluation of UVAPS fluorescence signals, it is important to evaluate the contributions of individual fluorescence signals obtained from test microorganism samples under optimized fluorescence sensitivity settings.
In this study, we demonstrate the adjustment process for obtaining optimized UVAPS fluorescence sensitivity settings to distinguish between viable particles related to microorganisms and nonviable environmental particles. As a first step toward UVAPS sensitivity adjustment for real-time detection of bioaerosols, we measured differences in the fluorescence intensity of pure Escherichia coli bacteria and PSL particles under UVAPS conditions obtained with various values of the UV pulse laser power and PMT gain. Using the resulting optimized UVAPS fluorescence settings, physical/biological characteristics, including particle size distribution, fluorescence percentage, and bacterial culturability from cultures of various viable microorganisms (e.g., E. coli, Bacillus subtilis, and Staphylococcus epidermidis) and nonviable aerosols (e.g., NaCl, multiwall carbon nanotubes [MWCNT], PSL, and fluorescent PSL [FLPSL]), were investigated.
Materials and Methods
Test aerosol particle preparation
For the experiments, two types of test aerosol (E. coli and PSL particles) were used to adjust the UVAPS sensitivity. The physical/biological characteristics of various test aerosols were investigated at the optimized UVAPS settings.
Bacterial bioaerosols were generated using three types of microorganisms: E. coli (ATCC No. 8739), B. subtilis (KACC No. 10111), and S. epidermidis (KCTC No. 1917). Gram-negative E. coli is representative of sensitive bacteria, and has been evaluated in numerous microbiology and bioaerosol studies (Palaniappan et al., 1992; Huang and Juneja, 2001; Jung et al., 2009; Abi-Dargham et al., 2010; Lee et al., 2010a; Jung et al., 2011b). Airborne E. coli has been found in indoor environments, and one study has suggested that E. coli O157:H7 can be spread in an airborne manner (Varma et al., 2003). Gram-positive S. epidermidis and B. subtilis are commonly found in a variety of environments, and, therefore, are typical airborne microorganisms in bioaerosol research with Gram-negative E. coli (Agranovski et al., 2003a, 2003b; Jung et al., 2009; Lee et al., 2010a). Staphylococci are common parasites in humans and animals, and occasionally cause serious infections. S. epidermidis is commonly found on the skin or mucous membranes of humans (Madigan et al., 2003). B. subtilis has often been used as a test bacteria particle in biological aerosol studies, because it is representative of microorganisms that are robust against environmental stress (Yao and Mainelis, 2006; Jung et al., 2009, 2011a).
Each bacteria culture was grown in tryptic soy broth (Becton Dickinson) and nutrient broth (Becton Dickinson) at 37°C for 18 h (Jung et al., 2009). The bacteria were harvested by centrifugation (5000 g, 10 min). The pellets were washed twice with sterile deionized water (SDW), which was also used to dilute the cells to obtain an optical density of 0.89–0.91 at 600 nm (Lin et al., 2000; Jung et al., 2009). A 30 mL aliquot was taken, and placed in a one-jet Collison nebulizer (BGI, Inc.). The cell concentration was ∼108 colony-forming units (CFU) per milliliter by the culture plate method, which is explained in greater detail in the next section.
NaCl, FLPSL particles, normal PSL particles, and MWCNTs were used as the nonviable test particles. To generate the MWCNT aerosols, a commercial MWCNT solution (1.0 wt% Hollow CNT 50 in SDW as a base solution, with purity >95%) was purchased from Nano Karbon. According to the manufacturer's data sheet, the MWCNTs were 40–60 nm in diameter and 20 μm in length (Lee et al., 2010b). For the NaCl aerosol, 10 wt% aqueous NaCl solution was used. A suspension of monodispersed PSL and blue FLPSL (1% solid content, density 1.05 g/cm3; Duke Scientific Corporation) with a 1-μm diameter were prepared for the nebulization process. The suspensions of PSL and FLPSL were each obtained by diluting one drop of stock solution in SDW to a concentration in the order of 107 particles/mL.
Experimental method and measurements
The experimental setup, illustrated schematically in Fig. 2, included three major components: (1) a system for generating aerosols, (2) a UVAPS aerosol measurement system, and (3) a sampling system for culturability analyses of the bacterial bioaerosols. The test particles in the liquid suspensions were aerosolized by dry, filtered, and compressed air passing through the nebulizer at a flow rate of 1 L/min. The aerosolized particles were then passed through a diffusion dryer to remove all moisture and an electrostatic charge neutralizer (two 210Po radioactive sources, each with an activity of 500 μCi) to minimize the electrostatic removal of particles by the inner surfaces of the test system. After generation, the aerosol streams were diluted with additional airflow to obtain a specific particle concentration of about 10–15 particles/cm3, in accordance with the upper limit (about 60 particles/cm3) of detection of the UVAPS (Agranovski et al., 2003b). The UVAPS measures the aerodynamic size of airborne particles in the size range of 0.5–15 μm. The aerosol sampling time of UVAPS was set at 20 s. The airflow rate in the nebulizer and the dilution were held constant by using mass flow controllers (FC-280S; Mykrolis).
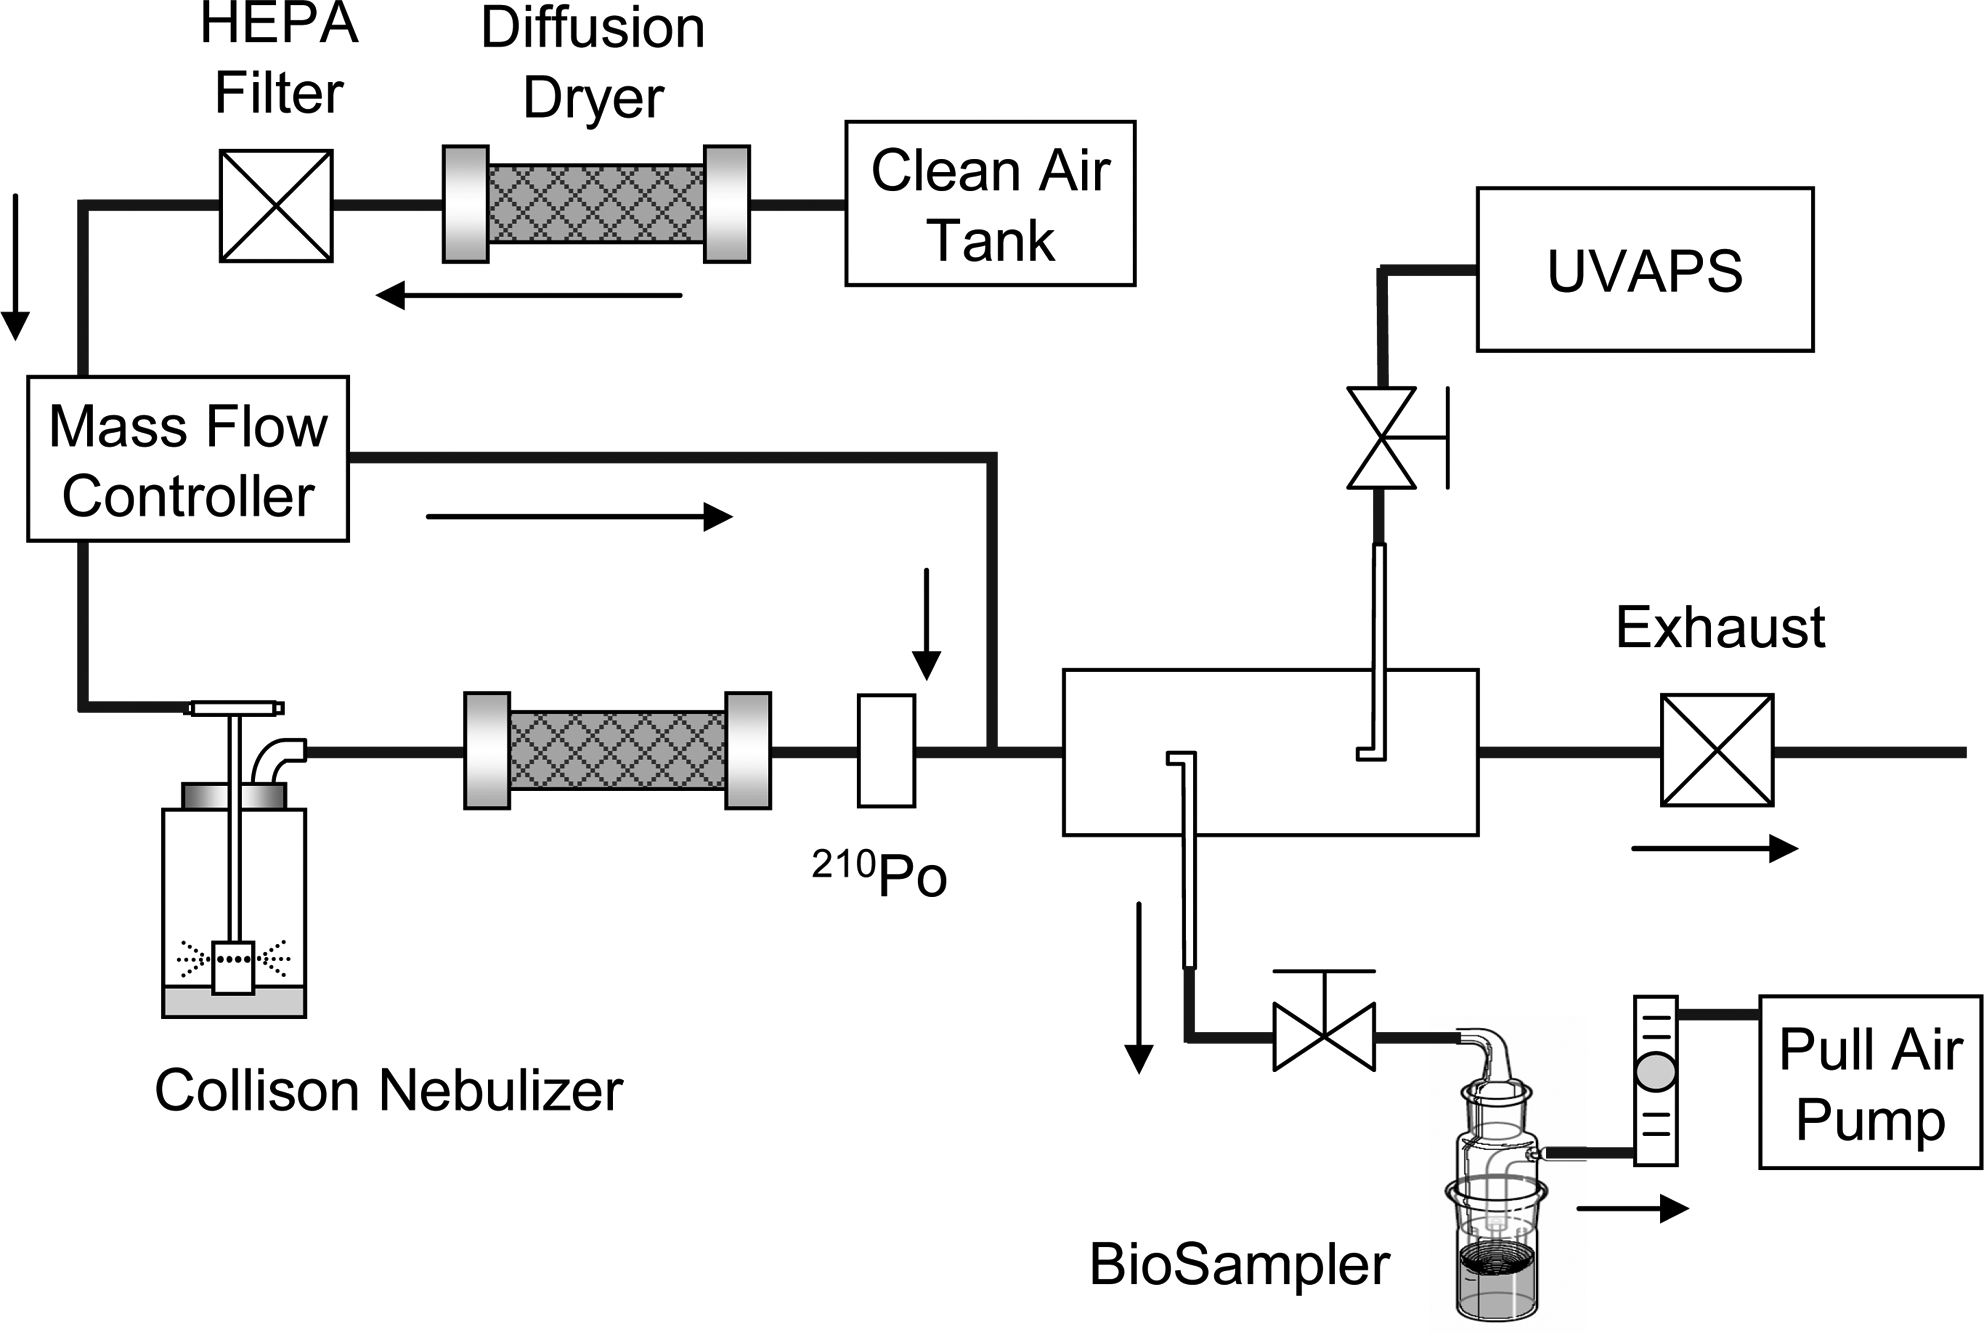
Experimental setup. Aerosolized test particles were sampled by the UVAPS and the BioSampler in sequence.
After aerosol generation and dilution, the aerosol stream was passed through a sampling chamber to measure the aerosol and fluorescence characteristics. A UVAPS measures three values for each particle in its target size range: the aerodynamic size, determined from the time-of-flight (TOF) measurement, the amplitude of the light scattered by the particle, and the particle fluorescence for the specified excitation wavelength and emission waveband, as described in the Introduction (Fig. 1). This study was concerned with the TOF and fluorescence measurements of the individual particles. The aerodynamic particle diameter, which is equivalent to that of a standard-density spherical particle with the same gravitational settling velocity (Hinds, 1989), is represented by 52 size channels on a logarithmic size scale, with respective concentrations recorded in particles/cm3. Since the UVAPS does not provide nominal values for the fluorescence intensity of single particles, the fluorophore intensities can only be evaluated relatively. The fluorescence emission of each individual particle is registered in one of 64 channels of the UVAPS system, where higher channel numbers indicate greater intensity. Nonfluorescent particle data are registered in the first channel, whereas fluorescent particle data are placed in channels 2–64. The fluorescence percentage (%) is calculated as the ratio of the total number of fluorescent particles (channels 2–64) to the total number of particles (channels 1–64) (Agranovski et al., 2003a, 2003b; Jung et al., 2010):
Bacterial culturability, defined as recovery from culture, was determined by culturing samples of bacterial suspensions obtained under various experimental conditions. A BioSampler® (SKC) operated by a pull vacuum pump with a flow meter (Gast IAQ pump; EMS) was used to collect the samples. Aerosolized bacterial particles were collected for 10 min at a nominal flow rate of 12.5 L/min in 20 mL of phosphate-buffered saline solution (PBS, pH 7.4). The overall particle collection efficiency (η) of the BioSampler is defined as
where Cdown and Cup are the particle concentrations (particles/cm3air) of the bioaerosols measured downstream and upstream of the BioSampler, respectively. In this study, the physical collection efficiency of the BioSampler was about 89.8% for E. coli particles, 90.5% for B. subtilis particles, and 89.1% for S. epidermidis particles.
Aliquots (0.1 mL) of the BioSampler suspensions were diluted with PBS, then plated on tryptic soy agar (Becton Dickinson), and incubated at 37°C for 12 h in the case of E. coli, and plated on nutrient agar (Becton Dickinson) and incubated at 37°C for 20 h in the case of B. subtilis or S. epidermidis. After incubation, the number of colonies on each plate was counted.
The concentration of culturable bacteria (Cculturable bacteria) was determined by converting the number of CFUs into an aerosol concentration (CFU/cm3air). To calculate bacterial culturability, the concentration of culturable bacteria was divided by the concentration of total bacterial particles measured using the UVAPS:
UVAPS particle measurement principles
The UVAPS overlaps two beams from a diode laser with a maximum of 30 mW of power and a wavelength of 655 nm, producing one double-crested beam profile. Each particle creates a single, continuous signal with two crests (Fig. 1). This signal is recorded and converted into TOF information, which is related to the velocity of the particle, as well as its aerodynamic size. After a particle passes through the two red laser beams, its fluorescence is measured by illuminating it with a pulsed UV laser beam slightly below the red beams. A PMT located behind a UV blocking filter detects any fluorescence emission from the particle and converts it to an electrical signal. The UV laser triggering logic of the system electronics adjusts the time for firing the UV pulse on the basis of the particle velocity obtained from the TOF information. This UV triggering calibration is necessary, because different sized particles travel through the flow field at different velocities. Ultimately, the UVAPS presents the particle measurements as a three-dimensional array of number counts versus particle sizes and fluorescence intensities. The UVAPS is operated with custom software (Aerosol Instrument Manager; TSI), installed on an external computer. This software provides computer-controlled operation, as well as data interpretation and management.
Parameters for fluorescence sensitivity adjustment of a UVAPS
The capability of a UVAPS to detect fluorescence from aerosol particles is primarily used to differentiate between particle types via the intensity of their fluorescence. To accomplish this, it may be necessary to set the UVAPS fluorescence sensitivity in a range that reveals fluorescence differences for the particles of interest. The sensitivity is adjusted by setting two parameters: (1) the UV laser pulse energy and (2) the gain of the fluorescence-sensing PMT. The UV light source is a 355-nm pumped neodymium-doped yttrium aluminum garnet (Nd:YAG) diode laser (TSI) with 30 mJ/pulse at 2 kHz. The pulse emission is controlled by an electro-optic Q-switch.
The values of the UV laser and PMT gain parameters can be set and read using the terminal interface of the AIM software to send commands and receive responses directly. In particular, the UV laser pulse power can be set as a value in a range of 1–255, which is not directly related to the pulse energy unit. However, as long as the fluorescing material is not near saturation, these values are linearly related to the actual UV pulse energy according to the manufacturer's UVAPS manual (Model 3314; TSI), and can be converted into energy units using the calibration data supplied with each UVAPS. The UV pulse energy setting is regulated by the slow feedback control of UVAPS electronics. Each second, the instrument takes a reading of the UV laser pulse energy, and adjusts the pump diode current to maintain the pulse energy setting. The fluorescence PMT gain voltage can be set in the same way, but the relationship with PMT gain is exponential. According to the instructions accompanying the UVAPS, about 350–600 V is the recommended useful operating range for the PMT.
Results and Discussion
Adjustment of the fluorescence sensitivity of a UVAPS
We used the PSL and E. coli aerosols to adjust the UVAPS fluorescence settings. A previous study showed that PSL particle size had no effect on the instrument settings related to fluorescence sensitivity (Agranovski et al., 2003b). Nevertheless, to eliminate the effect of number concentration and particle size (except on the fluorescence differences between biological and nonbiological aerosols under similar aerodynamic particle conditions), we selected the PSL size (which is similar to that of E. coli), and the number concentrations of both aerosols were adjusted to ∼10–15 particles/cm3. Figure 3 shows the size distributions of both test aerosols. The geometric mean diameter (GMD) and geometric standard deviation (GSD) were 0.85±0.003 μm and 1.16±0.010 for E. coli, and 0.87±0.004 μm and 1.15±0.013 for PSL; thus, the size distributions of the two types of generated particles were very similar and monodispersed.
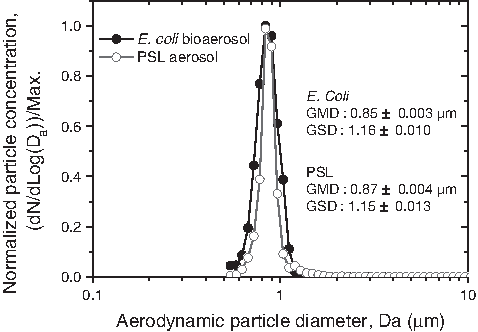
Size distributions of the test aerosols. GMD, geometric mean diameter (μm); GSD, geometric standard deviation.
During the fluorescence measurement of each test particle, both the UV laser pulse intensity and the PMT gain voltage settings were increased gradually, using the terminal interface of the AIM software. As described in the Materials and Methods section, the fluorescence of each particle detected by the UVAPS was registered in 1 of 64 channels, depending on the intensity of the signal. Increasing channel numbers correspond to increasing particle fluorescence intensity. Thus, by analyzing the concentrations of the particles in each channel, it is possible to determine the relative fluorescence intensity of a particular fluorophore. Table 1 shows the fluorescence percentages (%) of the PSL and E. coli aerosols for various settings related to the UV laser pulse power and the PMT gain voltage. Overall, the fluorescence percentage exhibited a steadily increasing tendency with regard to increases in both parameters. Using the fluorescence data in Table 1, we were able to determine the optimal settings for the sensitivity adjustment of the UVAPS. Figure 4 shows the methodology for optimizing UVAPS fluorescence sensitivity. The purpose of this sensitivity optimization process is to find the settings for the fluorescence-adjusting parameters that maximize the fluorescence difference between PSL and E. coli aerosols while maintaining the fluorescence of the PSL control aerosols at a level of 1%–2% as the fluorescence baseline (Agranovski et al., 2003b; Kanaani et al., 2008b; Jung et al., 2010). The fluorescence percentages (%) of the PSL and E. coli aerosols were plotted for various values of the UV laser pulse power and PMT gain voltage, with the x-axis indicating fluorescence (%) and the y-axis indicating PMT gain voltage (Fig. 4). We found the PMT gain voltage corresponded to the fluorescence (%) of the PSL aerosols at 1%–3% for various values of the UV laser pulse power. We were then able to determine the settings for the UVAPS fluorescence-adjusting parameters that maximized the fluorescence (%) of the E. coli aerosols among the PMT gain voltages for the PSL aerosols just mentioned. Using the optimization procedure and fluorescence data (Table 1) for the PSL and E. coli aerosols measured in this study, a UV pulse power of 130 and a PMT voltage gain of 431 V were obtained as the optimal settings. Under these conditions, the fluorescence (%) of the PSL and E. coli aerosols were 2.6%±0.43% and 7.0%±0.23%, respectively. Figure 5 shows the three-dimensional UVAPS spectra of the PSL and E. coli aerosols. The particle number concentration of the PSL control (Fig. 5a) was confined to the first fluorescence channel, while the greatest particle concentration of the E. coli aerosols was distributed over the relatively broad range of fluorescence channels 1–3 (Fig. 5b).
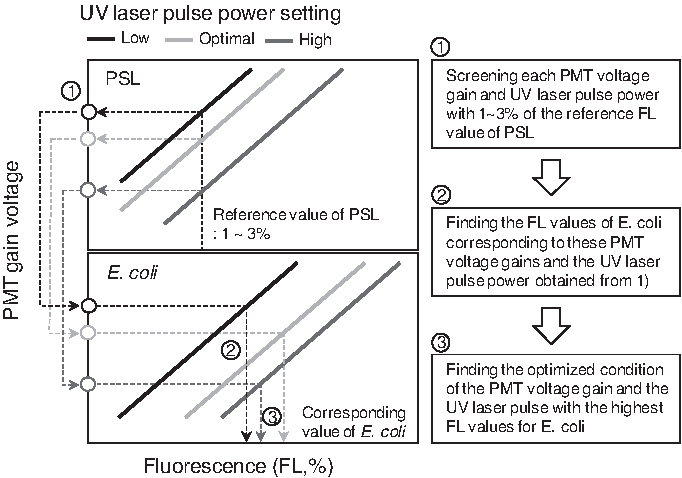
Optimization of UVAPS fluorescence sensitivity.
Three-dimensional fluorescence graphs:
Fluorescence percentage calculated as the ratio of fluorescent particles (channels 2–64) to total particles (channels 1–64), and reported as average±standard deviation.
Values are set in a range of 1–255. They have a linear relationship with the UV pulse energy, and can be converted to energy units by using the calibration data supplied with each UVAPS.
PMT, photomultiplier tube; PSL, polystyrene latex; UVAPS, ultraviolet aerodynamic particle sizer.
Aerosol and fluorescence characteristics of the test aerosols
Using these (optimal) UVAPS settings, comparative tests were performed with nonviable aerosols of NaCl, FLPSL, and MWCNT, and bacterial aerosols of B. subtilis and S. epidermidis (Table 2). The particle number concentrations for all tested aerosols were in the range of 10–15 particles/cm3, which is less than the upper detection limit (about 24 particles/cm3) of the UVAPS system, as previously reported (Agranovski et al., 2003b). The GMD and GSD of the bacterial particles were 0.84±0.005 μm and 1.23±0.012 for B. subtilis, and 0.85±0.005 μm and 1.19±0.011 for S. epidermidis. Although the GMD and GSD of the FLPSL particles were measured as 0.968 μm, the GMD and GSD of NaCl and MWCNT could not be exactly obtained, because these aerosols have a broad particle size range (from several tens to several hundred nanometers), which is not detectable by UVAPS. In this study, thus, only particles in the size range of 0.5–20 μm were taken and analyzed.
Data reported as average±standard deviation.
Measured as the total aerosol particle concentration in the size range of 0.5–20 μm.
Calculated as the ratio of fluorescent particles (channels 2–64) to total particles (channels 1–64).
Calculated as the ratio of culturable bacterial particles to total particles.
MWCNT, multiwall carbon nanotubes.
In particular, the fluorescence of NaCl and MWCNT was ∼0.5%–1.6% lower than that of the PSL aerosols, even though all of them are nonfluorescent and nonviable materials. This fluorescence difference between nonfluorescent particles may be caused by the chemical composition of the materials. It is unclear, however, which characteristics of these particles may affect UVAPS sensitivity.
The fluorescence percentages and bacterial viabilities of the tested materials are listed in Table 2. The fluorescence percentages of the bacterial aerosols were 7.0%±0.23% for E. coli, 8.7%±0.62% for B. subtilis, and 8.8%±0.55% for S. epidermidis. The fluorescence difference between E. coli and PSL was nearly 4.4%. If the fluorescence of PSL aerosols is used as the background fluorescence from general environmental particles, we believe that only 4.4% of the E. coli fluorescence percentage was produced by viable bacterial aerosols. The fluorescence percentage of each bacterial aerosol measured by UVAPS was comparable to its culturability, obtained by the culture method. Although the fluorescence percentage for E. coli was the lowest among the tested bacterial aerosols, its viability was the highest (nearly 6.3%±2.80%).
The BioSampler served as a conventional means of sampling the test microorganisms, whereas the UVAPS system was used to obtain real-time data. When sampling with the BioSampler, physical stresses on microorganisms, such as impaction, can decrease the culturability of bacterial cells (Stewart et al., 1995; Lin et al., 2000). In addition, we assumed that a bacterial cell was dead when it was no longer able to grow on standard culture medium, although this assumption is simplistic (Amann et al., 1995). There are many situations in which a cell loses culturability but remains viable and potentially able to regrow, defined as a “viable but nonculturable” state (Garcia-Armisen and Servais, 2004). Therefore, the conventional culture plate technique more precisely reflects the culturability of a microorganism, rather than its viability (Kell et al., 1998; Oliver, 2005). In this case, the measured culturability could be lower than the fluorescence emitted by living microorganisms (Jung et al., 2011c). Additional studies are necessary to explain the relationship between the fluorescence percentage and viability of bacterial aerosols for different bacterial species.
Conclusions
The UVAPS system offers a promising real-time method for the rapid detection of airborne microorganisms, as a part of public health monitoring and military defense against biological attacks. In this study, we demonstrated the adjustment process for obtaining optimized fluorescence sensitivity of a UVAPS to distinguish between viable particles related to microorganisms and nonviable environmental particles. Using the sensitivity optimization process, we were able to determine the values of the fluorescence-adjusting parameters that maximize the difference between the fluorescence percentages of nonviable particles (e.g., PSL) and viable microorganism aerosols (e.g., E. coli), while maintaining the fluorescence percentage of the nonviable control aerosol at the minimum level of the fluorescence baseline. The fluorescence percentage and culturability measured by UVAPS and conventional culture plate methods gave similar values by optimizing this UVAPS setting. This sensitivity adjustment process of UVAPS optimization could help obtain more precise and quantitative information related to bioaerosol detection, which is useful for discriminating bioaerosols from atmospheric particles.
Footnotes
Acknowledgment
This research was supported by the Converging Research Center funded by the Ministry of Education, Science, and Technology (2011K000750).
Author Disclosure Statement
No competing financial interests exist.