
Abstract
Abstract
To investigate the environmental behavior of volatile organic compounds (VOCs) in urban areas, their concentrations were measured at four urban monitoring sites (namely, N, S, E, and W) in Seoul, Korea (February to December 2009). A total of 27 compounds were quantified that consist of four chemical groups: aromatic (AR), halogenated aromatic, halogenated paraffin, and halogenated olefin. Results were evaluated by focusing on these four functional groups just mentioned and their summation term as total VOC (TVOC) along with several individual species (mainly AR species, that is, benzene, toluene, ethylbenzene, and xylene). The highest concentration of chemical groups was found from AR (71.1±42.1 ppbC), while that for individual species confirmed the dominance of toluene (7.48±3.88 ppb). The analysis of spatial distribution indicated that high TVOC levels were recorded at sites N and W, while it was not so significant such as S and E in terms of TVOC budget. Seasonal variation of these VOCs was characterized by the peak values in December to reflect the combined effects of pronounced source activities and meteorological conditions. Analysis of spatial variations in VOC levels between the four urban sites indicated that their distributions are tightly affected by local source processes in each area.
Introduction
VOCs are one of the most detrimental pollutants emitted from anthropogenic activities. Among VOCs, benzene, toluene, and xylene are well known as major AR components with a potential health risk (Lawryk and Weisel, 1996; Leung and Harrison, 1999). Monitoring of their concentration levels has, thus, been conducted routinely to help establish the proper maintenance of air quality in urban/rural area.
In Korea, the capital city, Seoul is well known for a highly dense population with a number of industrial zones. There are around 3 million registered vehicles in the city according to the statistics of Korean Ministry of Land, Transport and Maritime Affairs (MLTM, 2007). As the number of vehicles increases gradually, the level of VOC emission can be an important parameter that assesses ambient air quality in urban environments (Na et al., 2001). In this study, the concentrations of VOCs were measured from four monitoring sites within the Seoul city boundary from February to December 2009. The results of our preliminary study conducted up to summer period (July 2009) were reported elsewhere (Anthwal et al., 2010b). In this study, the VOC data collected from these four monitoring sites from February to December 2009 were analyzed to describe their occurrence patterns in terms of both temporal and spatial scales. Based on our analysis, we attempted to explore the basic factors controlling the distribution of VOCs in a typical urban setting.
Experimental
Field site and sampling
In this study, the measurements of VOCs in ambient air were undertaken at four residential locations in Seoul: Jong Ro (JR), 37°34.19′ N, 127°00.18′ E; Gwang Jin (GJ), 37°32.40′ N, 127°05.44′ E; Yang Jae (YJ), 37°27.51′ N, 127°01.55′ E; and Gang Seo (GS), 37°32.11′ N, 126°50.18′ E (Fig. 1). To facilitate the recognition of each sampling site, they were also assigned to and named as N, E, S, and W, respectively by considering their geographical directions within the city boundary. Being highly urbanized, Seoul, the capital city of Korea, records one of the highest population densities in the world. The city with a total area of 605.5 km2 has a population of about 10.45 million with about 4.097 million households (Seoul Metropolitan Government, 2009). The vehicular densities in Seoul are large with a sum of about 2.9 million, while a number of man-made sources (e.g., livelihood waste incineration facilities) occupy about 12% of the city area (MLTM, 2007). All of the four sampling sites represent air quality monitoring stations in residential areas, where the basic air quality criteria are monitored on a routine basis. The site characteristics of these stations can be described briefly as follows. Site E has been affected moderately by adjacent roads as a pollution source and is characterized by a huge water purification plant nearby. Site W is also near the road side and known for an old landfill that was closed over a decadal period. Hence, site W can be affected by those conditions. In contrast, there are no specific point sources around site N or S. General aspects of these sampling sites have been described in our previous report of polyaromatic hydrocarbon (PAH) study (Anthwal et al., 2010a).
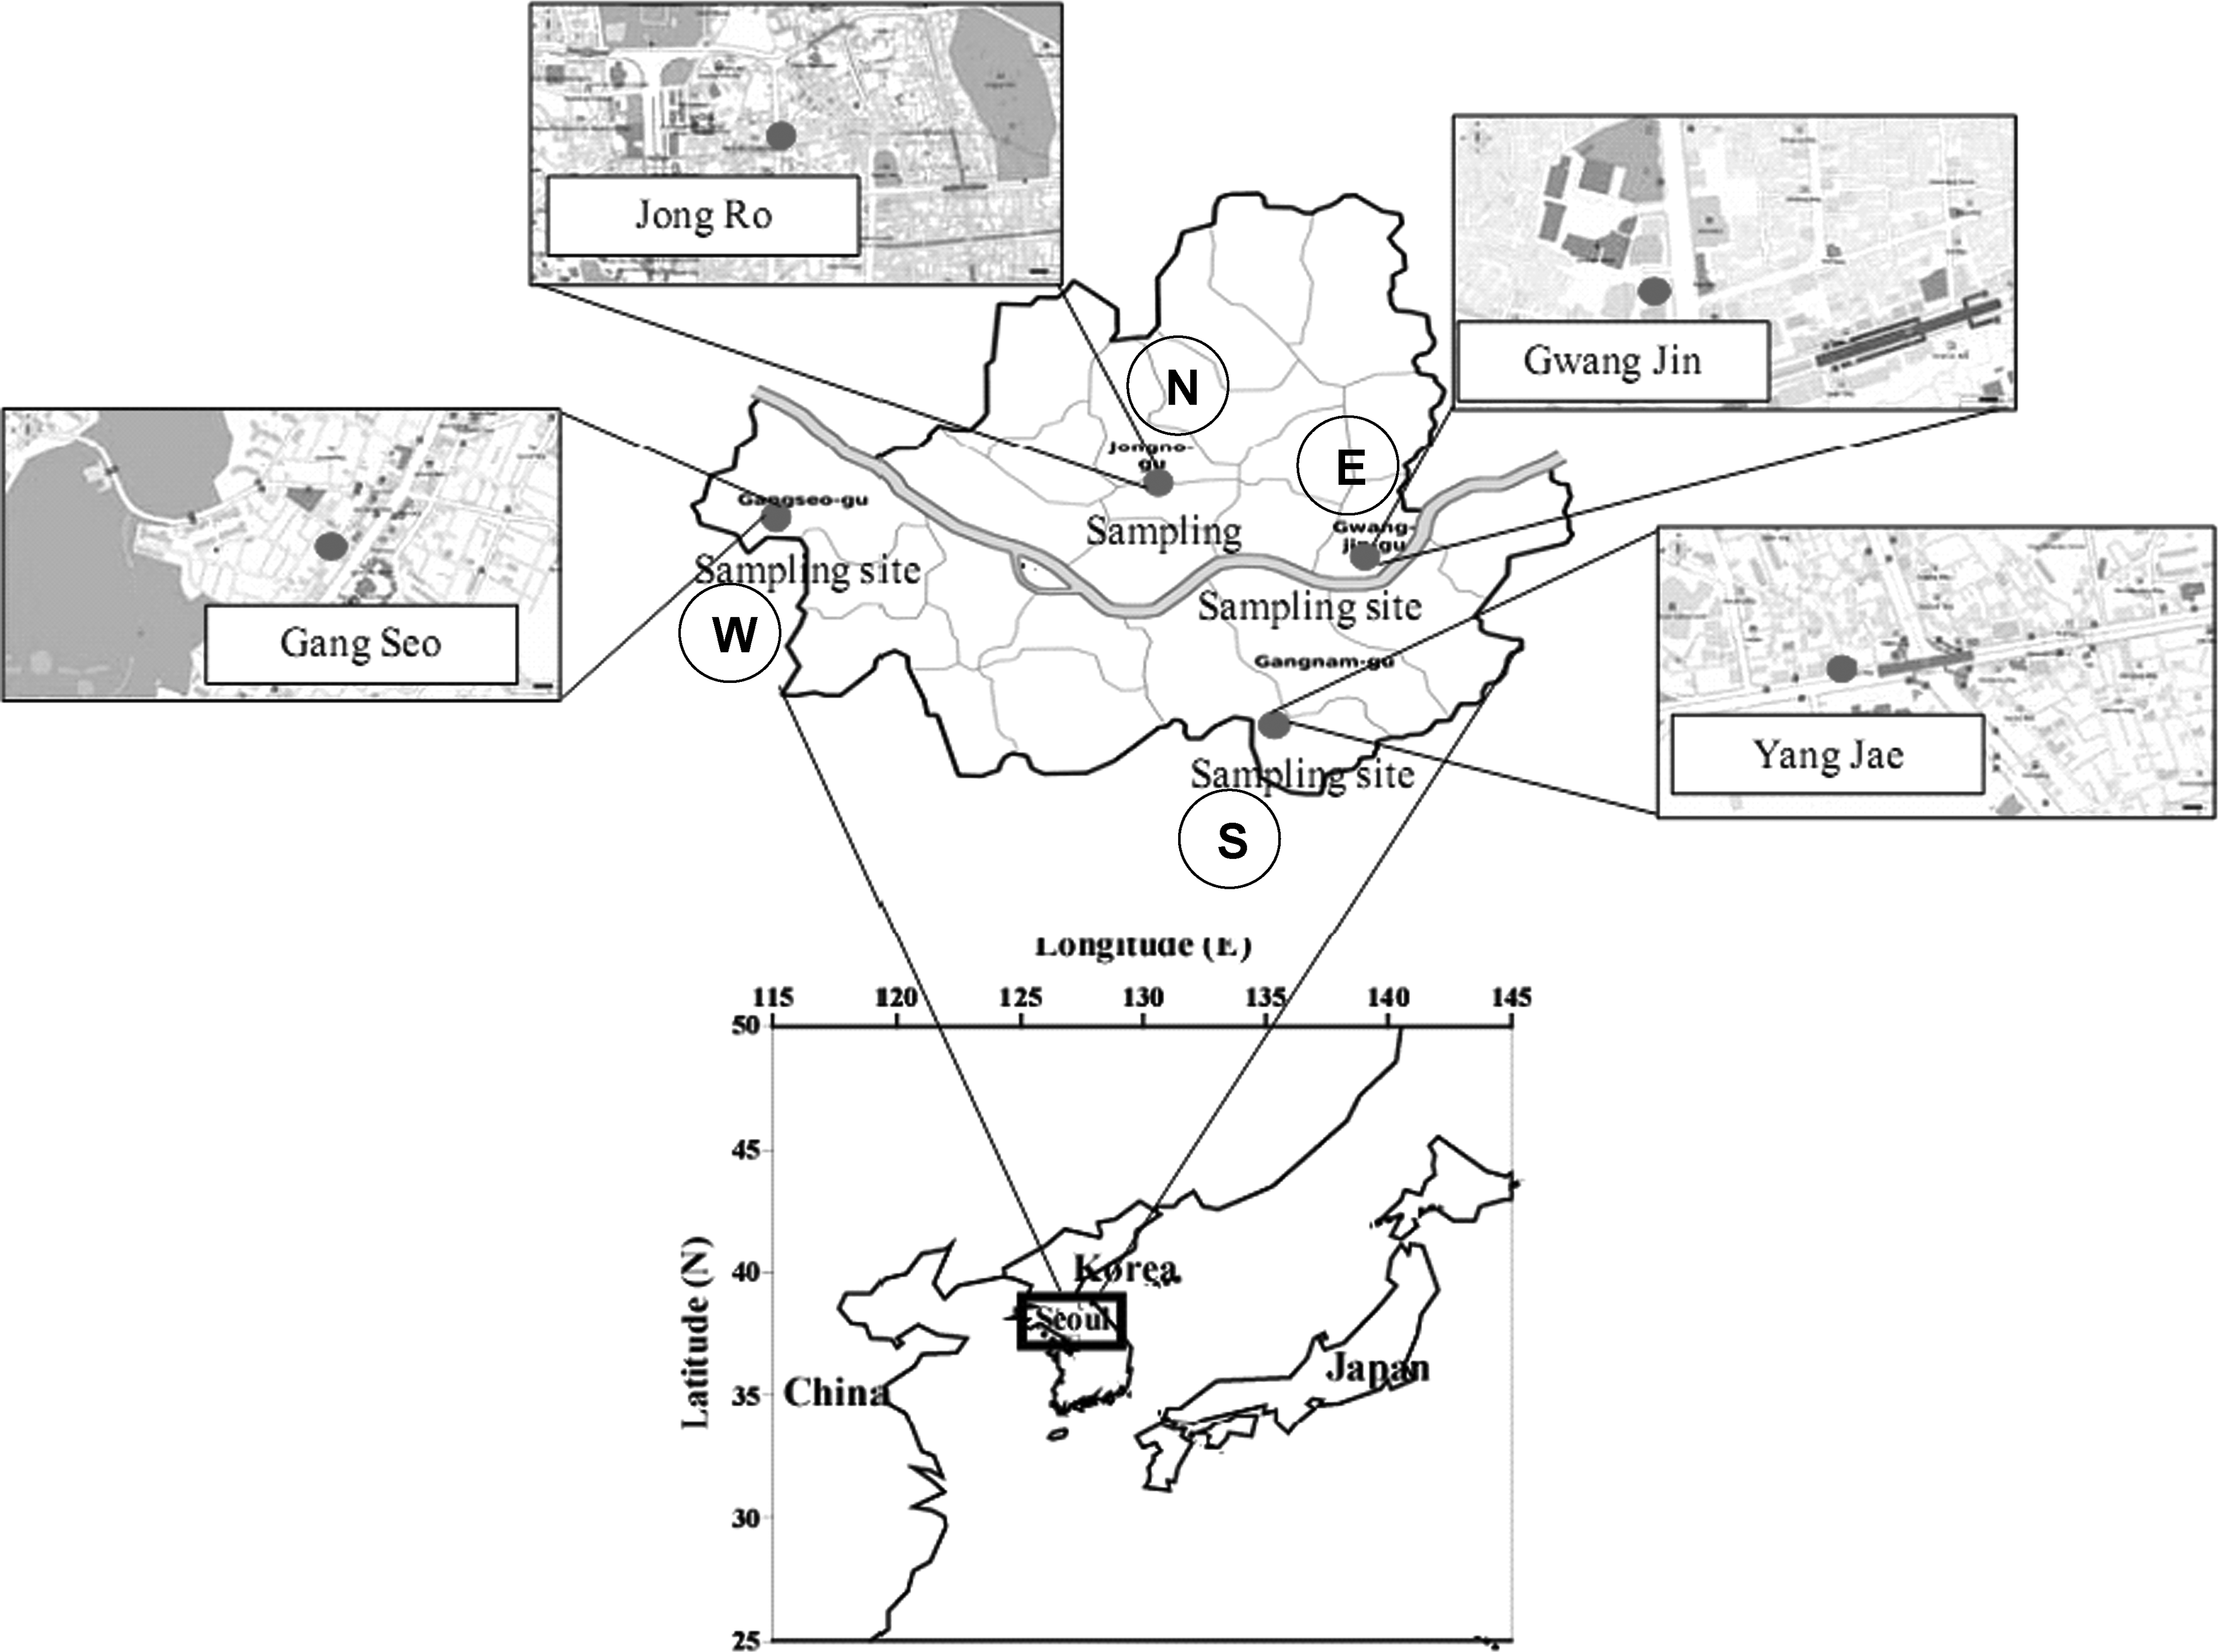
Geographical location of four study sites in Seoul, Korea: Jong Ro (site N), Gwang Jin (site E), Gang Seo (site W), and Yang Jae (site S).
In order to interpret the environmental behavior of VOC, the analysis of environment parameters (e.g., wind direction [WD]) was made in a number of respects. As shown in Fig. 2, there is a predominant difference in WD between the four study sites. At JR station (site N), frequency of wind occurrences is mainly dominated by easterly, while site E is affected by winds from both East and West. Although site S is affected dominantly by winds from NW, the pattern for site W is rather complicated. Hence, the different observations in wind occurrence patterns may cause variable patterns across sites for the selected VOCs.

Relative frequency distribution of wind rose patterns at the four sites in Seoul, Korea, from the study period (February to December 2009).
Collection of air samples and VOC analysis
The collection of VOC samples was carried out from four different location in Seoul from February to December 2009. In each month, the field campaigns for each month were made to cover 3 consecutive days: (1) February 23–25, (2) March 9–11, (3) April 6–8, (4) May 11–13, (5) June 9–11, (6) July 6–8, (7) August 11–13, (8) September 14–16, (9) October 12–14, (10) November 9–11, and (11) December 7–9. From each monitoring site, each daily sample was collected for 30 min duration (between 3:00 and 3:30
MW, molecular weight (g mol−1).
The VOC samples collected in adsorption traps were analyzed with the gas chromatography-mass spectrometry (GC-MS) system (Agilent GC/MSD, model 6890/5975B) combined with thermal desorption unit (Markes Unity Ltd.). The sequence of VOC analysis can be summarized as follows: (1) thermal desorption of tubes at 280°C for 10 min, (2) focusing of VOCs on cold trap at −10°C, and (3) subsequent transfer of VOCs into the GC-MS system (at 150°C). The separation of VOC was then made by a capillary column (DB-1, 60 m×0.25 mm×1 μm film thickness). The MS detector was operated in electron impact mode (70 eV). The GC-oven temperature was programmed as follows: 40°C for 5 min, 40°C–230°C ramping at 7°C min−1, and 230°C for 10 min. The flow rate of carrier gas (helium) was maintained at 1.3 mL min−1. These sampling traps were conditioned for 1 h at 350°C with the constant supply of N2 at 50 mL min−1. They were then sealed by both Swagelok fitting and polytetrafluoroethylene (PTFE) ferrules. The collection of VOC samples on the Carbotrap 300 was made from 3:00
Results and Discussion
General view of VOCs measurements at four monitoring stations in Seoul
In Table 1, the basic information is provided for 27 target VOCs measured in this study. In addition, Table 2 gives a statistical summary of VOC concentration data measured at each study site. As shown in Table 1, all 27 compounds were classified into four chemical groups: AR, halogenated aromatic (HAR), halogenated paraffin (HPR), and halogenated olefin (HOL). The summary shown in Table 2 reflects the dataset of the whole study period of February to December 2009 (except 3 months of August, October, and November). The concentration unit of part per billion by volume (ppb) is conventionally used for all individual VOCs. However, when we describe them as a group, the concept of part per billion by carbon (ppbC) can be used to assess the quantity of mixed hydrocarbon components on a parallel basis (Schubert et al., 1999; Na et al., 2001; Arriaga-Colina et al., 2004). The results shown in Table 2 indicate that the mean concentration levels of all individual VOCs are below 0.5 ppb at all four sites with an exception of toluene. The highest values (in ppb unit) of individual compounds were recorded for toluene, such as N (13.7±23.4), W (7.69±12.6), E (5.71±4.15), and S (3.40±2.51). In contrast, the lowest values were recorded by vinyl chloride.
Data (in ppb) are reported as mean±SD (median) and min–max [number of data above detection limit].
A total of 24 data, if measured continuously during the study: there are 3 months without measurements.
AR, aromatic; HAR, halogenated aromatic; HOL, halogenated olefin; HPR, halogenated paraffin; TVOC, total volatile organic compounds; SD, standard deviation.
In compliance with this study, many authors routinely found toluene as the predominant VOC component in the municipal region (Mohamed et al., 2002; Son et al., 2003; Odabasi et al., 2005; Nian et al., 2008; Nguyen et al., 2009; Matsumoto et al., 2010). A serious health concern of toluene (e.g., birth defects) can be suspected depending on its intake amount, exposure duration, genetic susceptibility, age, etc. The maximum concentration of toluene observed at site N exceeds a strict guideline value of 80 ppb set for its minimum risk level of chronic duration (ATSDR, 2000). However, such an occurrence is not observable from any other sites. Benzene, although not as abundant as toluene, is well known for a human carcinogen (ATSDR, 2006). As seen in Table 2, the maximum benzene levels seen in this study did not ever exceed a guideline value of 3 ppb set for minimum risk level of chronic duration (ATSDR, 2006). A slight variation in the distribution patterns of VOCs across different studies can be ascribed to different source properties and different sampling site characteristics.
For a meaningful comparison, the data sets of the four chemical groups (i.e., AR, HAR, HPR, and HOL) were also evaluated by assessing their relative significance. Among the AR VOCs, BTEX were dealt with separately by considering their abundance and human health impacts. Table 2 shows a statistical summary of these major VOC groups. To allow a simple comparison of VOC levels across study sites, the total concentration of VOCs (TVOC: ppbC unit) was also computed by summing concentrations of 27 individual species: For this derivation of TVOC, the concentration of each individual compound initially computed in ppb was multiplied by its carbon number (e.g., 7 for toluene) for conversion into ppbC. Although the definition of TVOC is not unanimous, it is a potential indication of atmospheric pollution, including many low-chemical-reactive substances that cause chemically induced sensory irritation (e.g., Mølhave and Nielsen, 1992). The results of this analysis showed that TVOC levels were generally enhanced at site N and W relative to site S and E. The highest mean of all chemical groups was constantly recorded by AR followed by HPR and HOL (Fig. 3). In fact, the individual components of the HAR group rarely exceeded detection limit, regardless of the sites. In contrast, AR group constantly exhibited fairly high concentrations among four VOC groups, which is also reflected by toluene. The other VOC groups (i.e., HPR and HOL) belong to chlorofluorocarbon (CFC), which is commonly used for refrigeration, propellants in aerosols, blowing agents in foam manufacturing, etc. The impacts of CFC are well known for their ozone depletion potential (USEPA, 2010). Due to the limited number of HAR components, our assessment of VOC groups mainly focused on three chemical groups (AR, HPR, and HOL). The analysis of the HPR data indicates that their maximum concentrations are found at site W (2.14 ppbC), although they are generally low (e.g., below 1.0 ppbC). Likewise, HOL data were also detected at low concentrations to show maximum of 1.46 ppbC at site W (Table 2). The concentrations of HPR and HOL groups in our study are found at fairly low levels. However, their impacts cannot be ignored, if one considers their long lifetimes in the atmosphere.
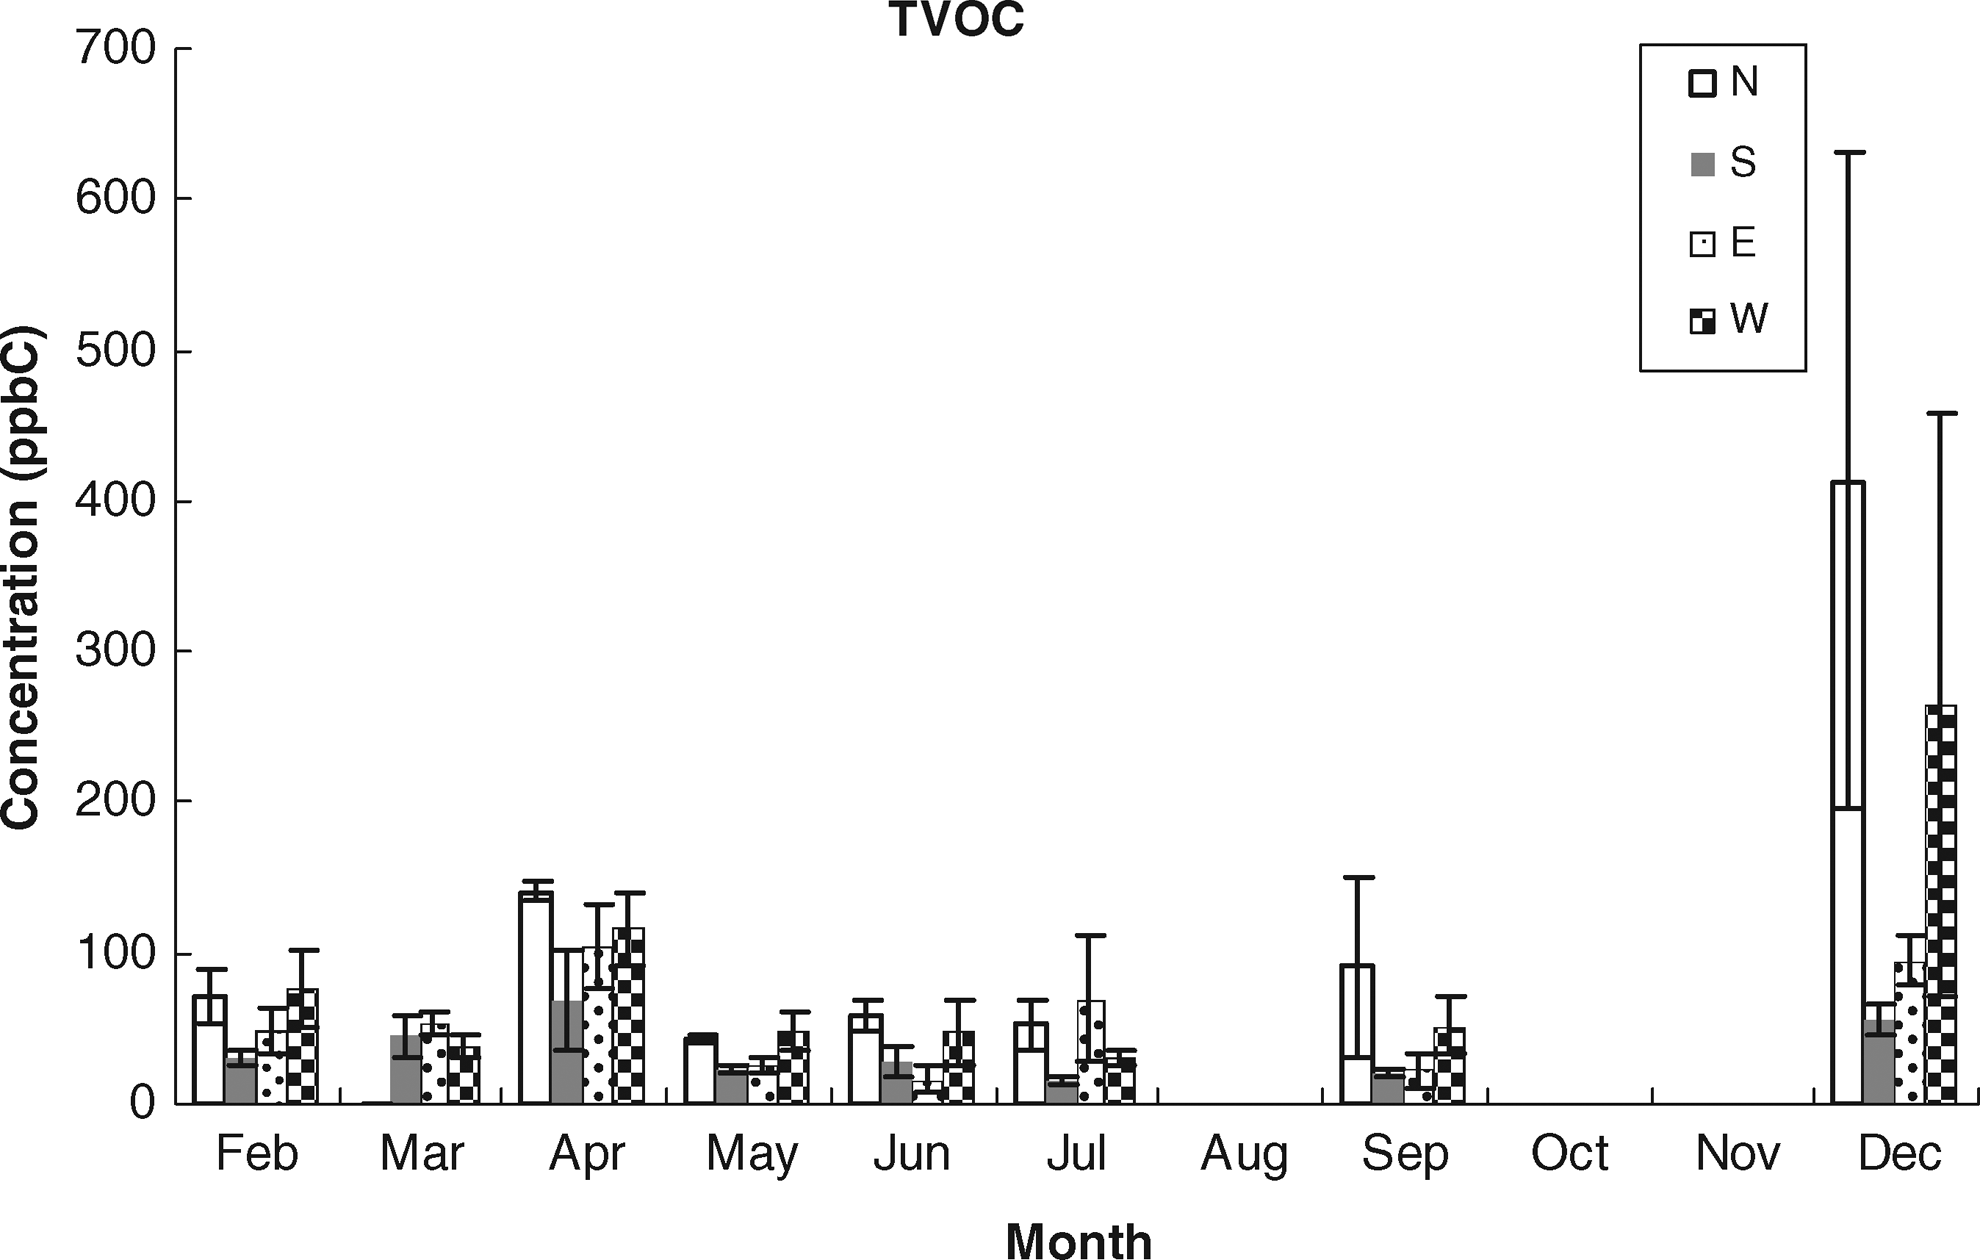
Comparison of total volatile organic compounds (TVOC; ppbC) measured at four sites (N, S, E, and W) from February to December 2009.
Spatiotemporal variation pattern of VOCs
To investigate the spatial variation of VOCs between four monitoring locations, t-test was carried out for all possible matching pairs of study sites using their concentration values derived over the entire study period. The data for each individual component (BTEX) and chemical group were used concurrently for this analysis. The results indicate that differences in their concentration levels are generally insignificant except in two cases. The concentrations of toluene and AR group were distinguished statistically between site N and S (at 95% level of significance). The observed similarities in their distribution may be sought for by such possibilities as the presence of local sources with the similar characteristics (between different sites) or by the lack of prominent point sources in each study area.
In Fig. 3, the TVOC data are plotted to allow comparison of the mean values at each site at monthly intervals. As shown in Fig. 3, concentration levels of VOCs peaked most frequently during December at all sites, while they consistently showed the lowest values in July. Although our measurements were not made continuously across all seasons, explanations for the observed monthly trend may be sought for by such factors as enhanced pollutant emissions of vehicles during wintertime due to lower combustion efficiency and high fuel consumption (ETSP, 2010). The low vehicular speed associated with slippery snowy road or frequent idling conditions will also help decelerate operation efficiency. In addition, in cold temperatures, engines usually take a longer time to warm up. Moreover, when the temporal trends of VOC were compared across the study sites, the results were, in general, compatible with each other. It is, however, suspected that the highest TVOC levels at site N should reflect fairly heavy traffic conditions near that site. The seasonal distribution of air pollutants in Korea and Japan is also affected by the long range transport of airborne pollutants (LRTAP) like Asian dust (AD) or yellow sand. AD is known to bring various hazardous pollutants, as it passes through highly industrialized zones in China to reach the receptor area (In and Park, 2002; Lee et al., 2004). The AD event usually occurs in springtime, but it is sometimes observed even in winter (Kim and Park, 2001; Zhang et al., 2002). Although AD did not occur strongly in the study year (2009), the effects of LRTAP on seasonal distributions on VOCs cannot be ruled out.
As shown in Figs. 4 and 5, the temporal patterns of all 4 sites are compared for major functional groups and individual compounds (BTEX), respectively. According to this analysis, AR concentration (ppbC) at 4 sites (N, S, E, and W) steadily peaked in Dec. with the mean values of 409, 52.5, 92.6 and 260, respectively. In case of HPR and HOL, the occurrence patterns of their monthly peak values were rather variable across different sites (Fig. 4). Due to limited abundance of HAR (mostly below detection limit), its trends are difficult to derive. The temporal distribution of individual ARs generally showed a similar pattern (except ethylbenzene) with notable enhancement in December. This type of strong seasonality may also be explained in part by temperature inversion in the winter (Nguyen et al., 2009). In ambient air, VOC concentrations generally reach a maximum in winter due to higher atmospheric stability. Moreover, chemical removal of VOC by OH radicals is faster in summer than in winter, as higher radiation and temperature of the former generally facilitate their removal reaction rates (Ho et al., 2004). In contrast, Cetin et al. (2003) reported that temperature and wind speed can exert important influences on the observed VOC levels (e.g., in a petrochemical complex area).
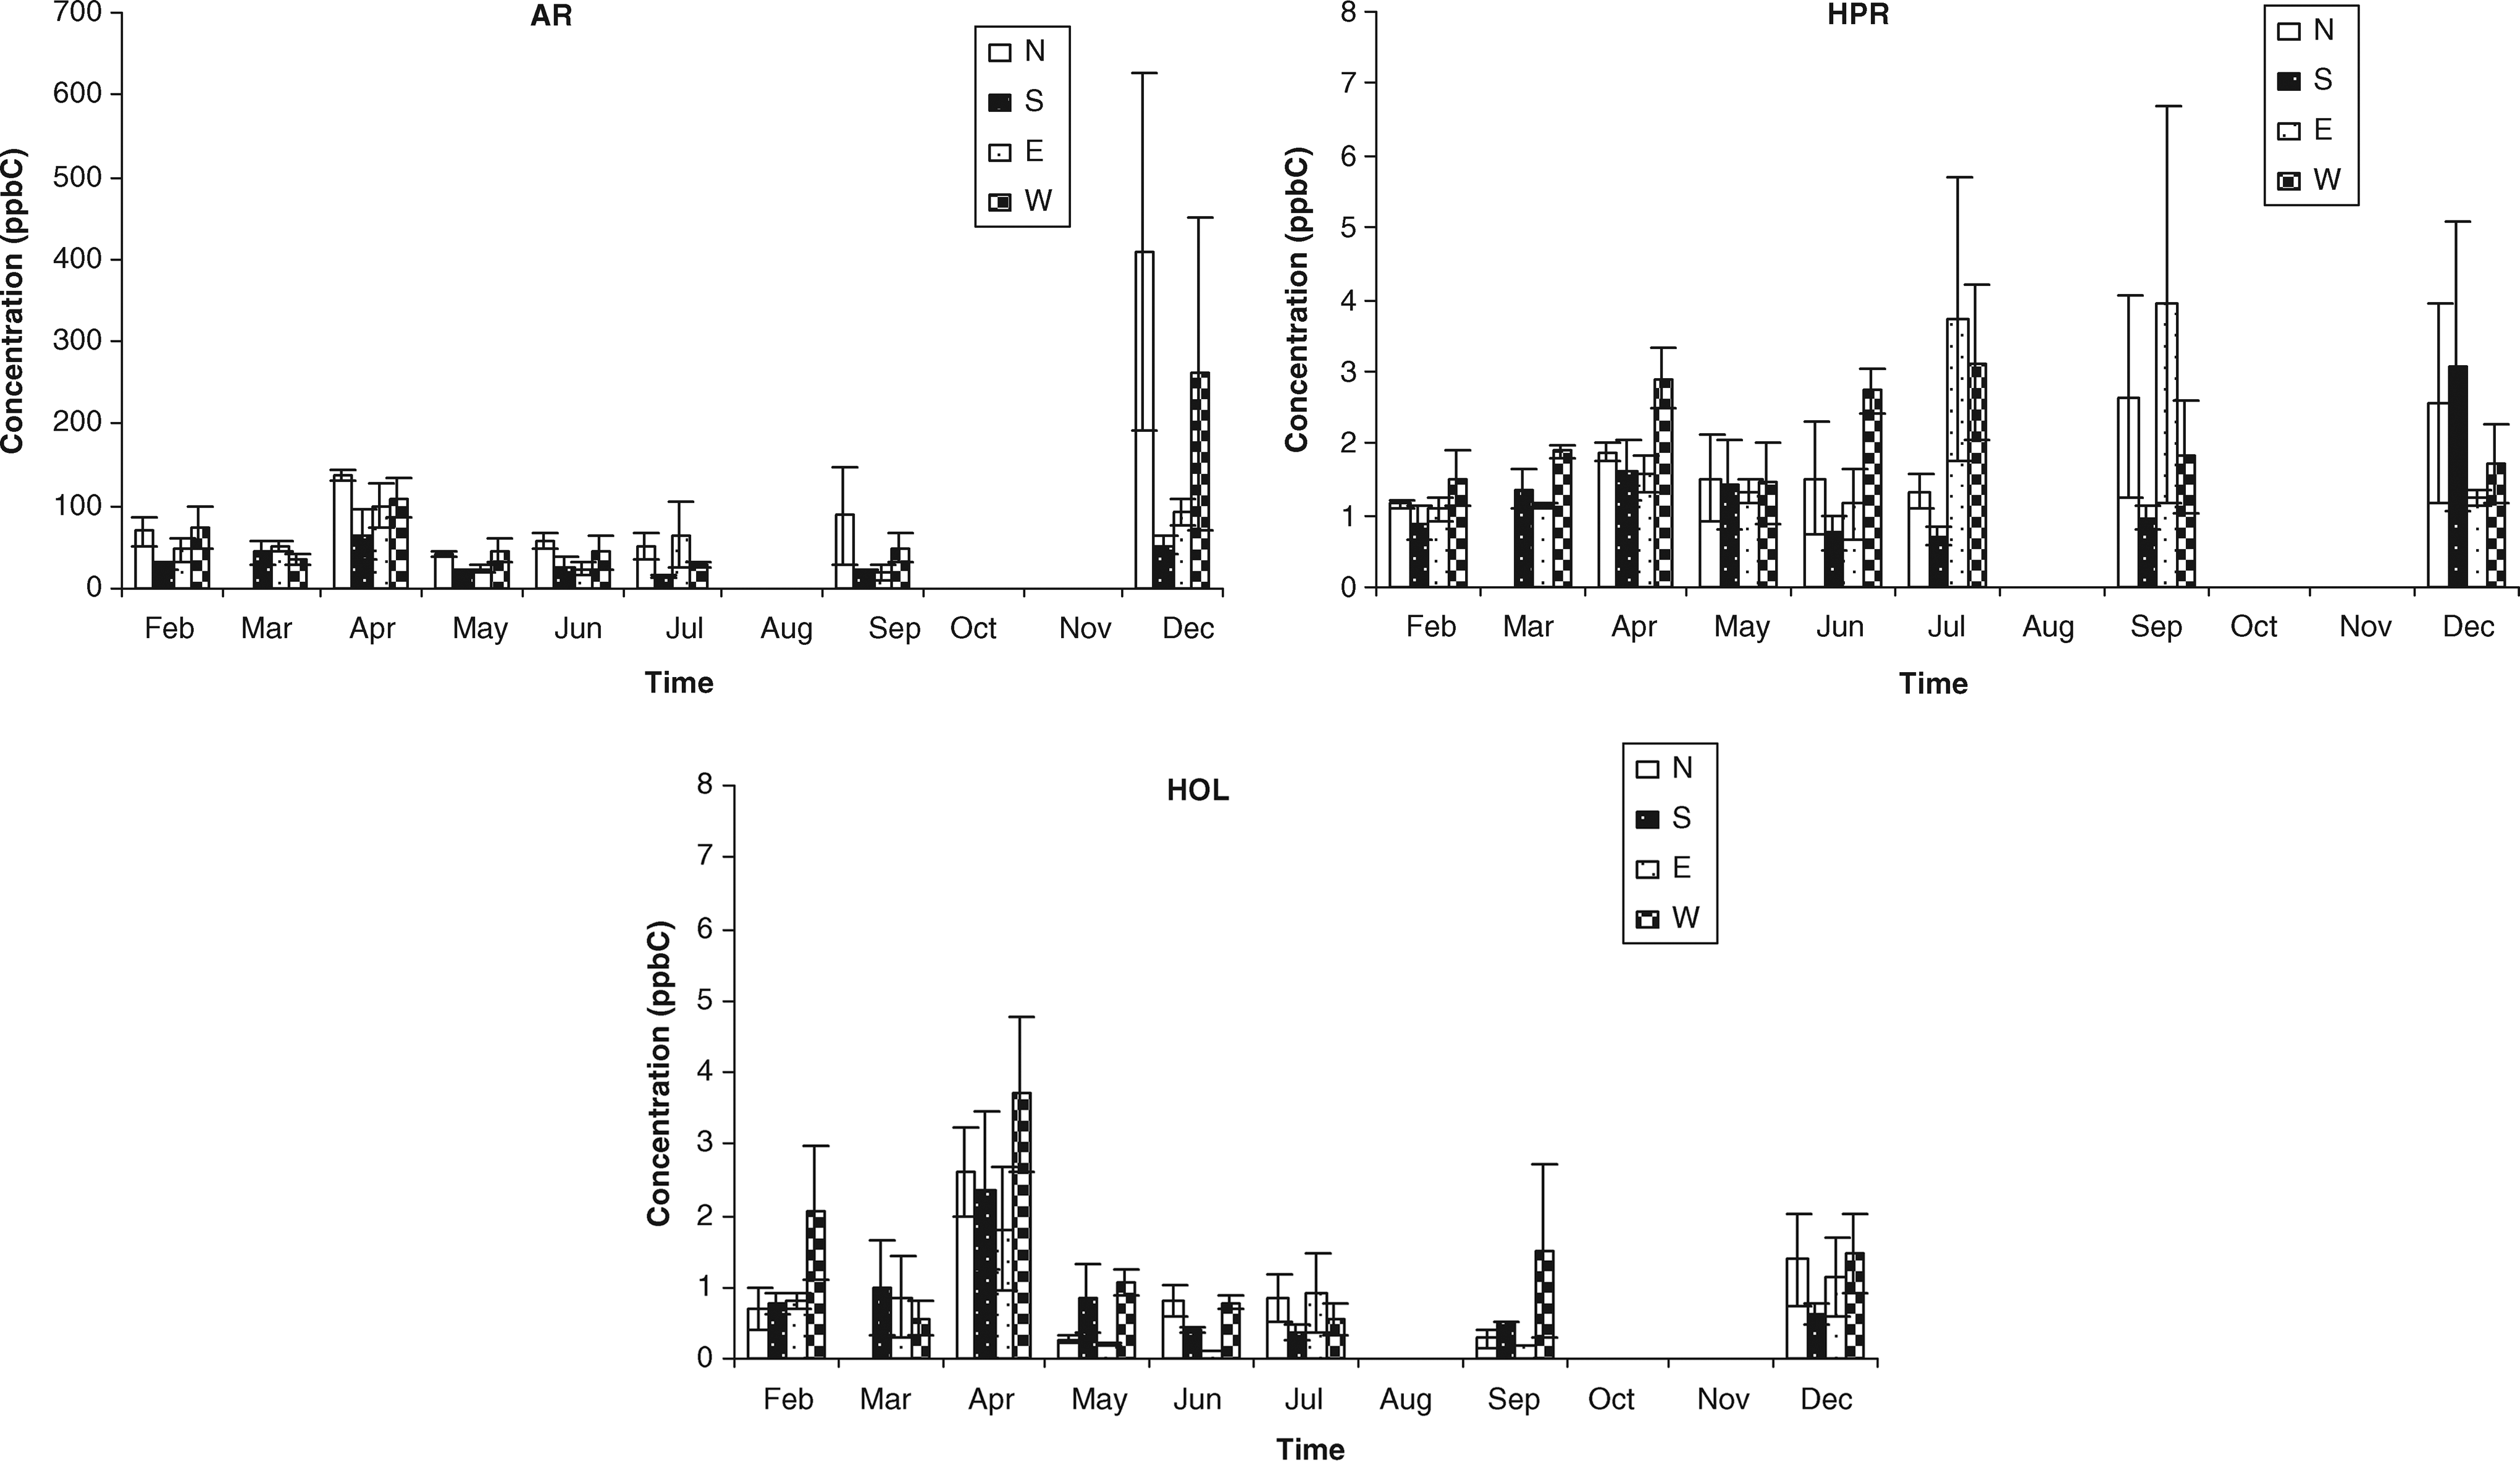
Temporal patterns of the three major VOC groups. AR, aromatic; HPR, halogenated paraffin; HOL, halogenated olefin.
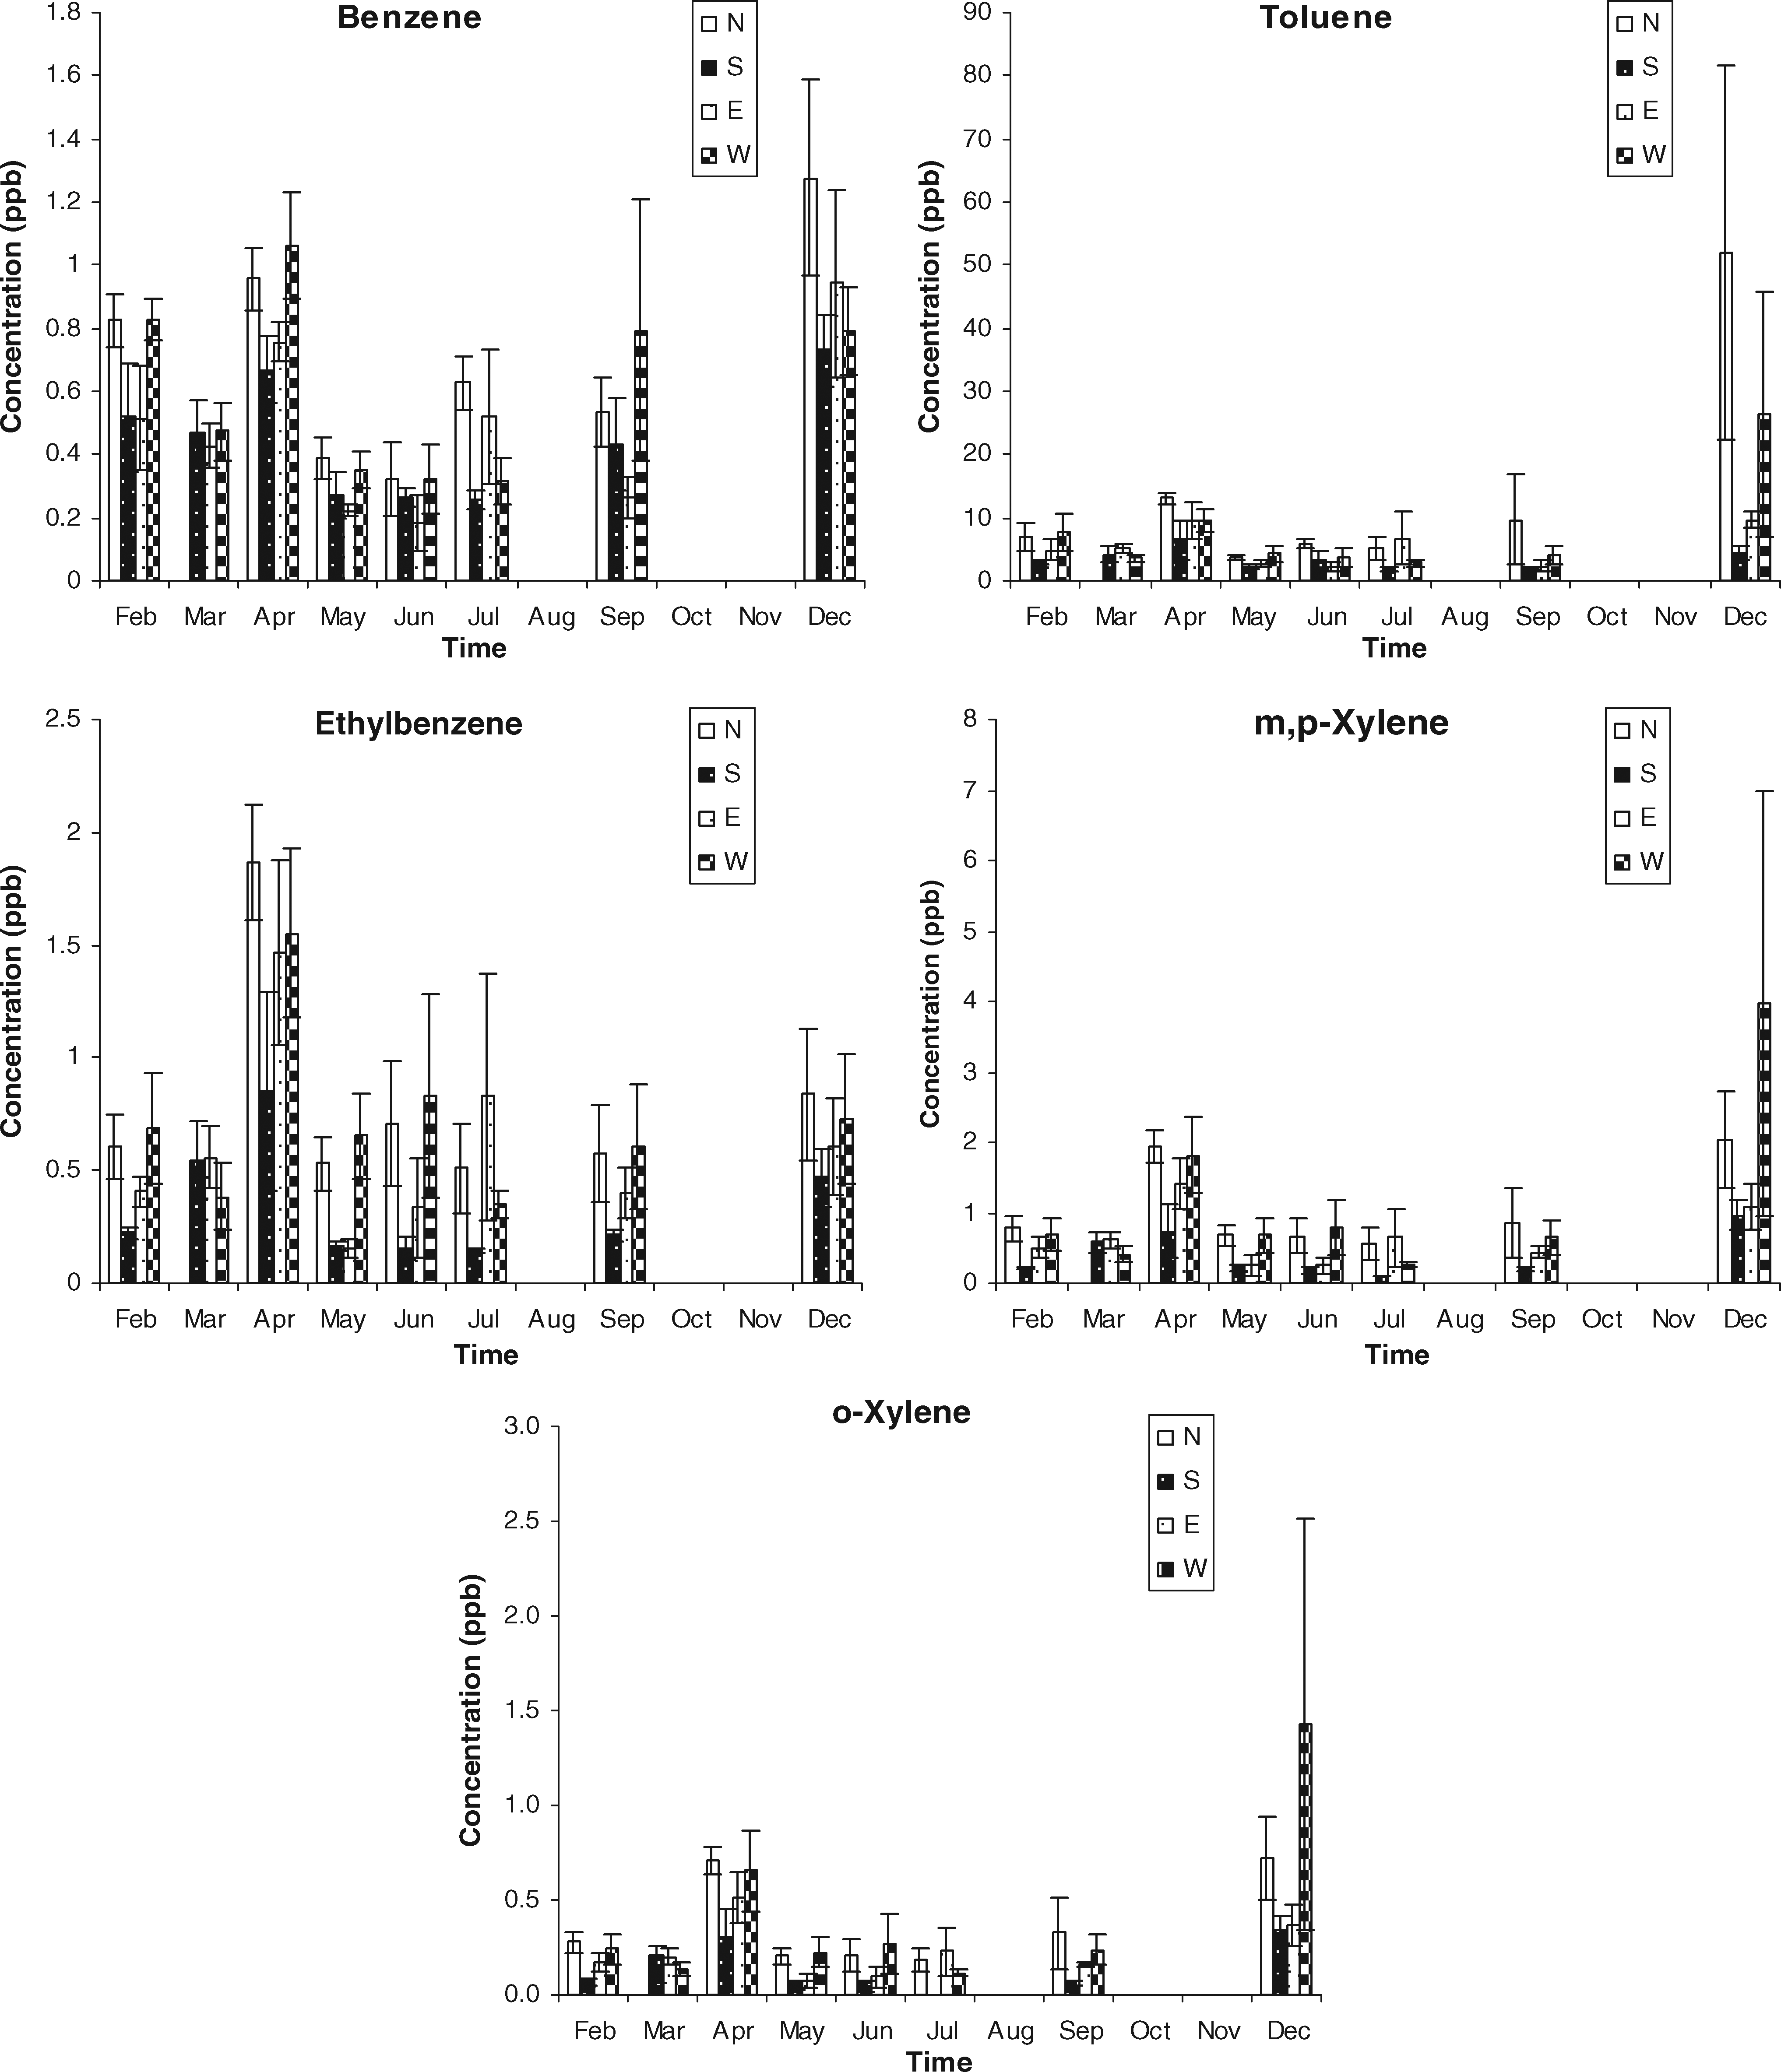
Seasonal patterns of the benzene, toluene, ethylbenzene, and xylene (BTEX) species after normalization by the mean values of each site.
To learn more about the VOC distribution at each site, their frequency distributions are also plotted (Figs. 6 and 7). The comparison was made for both BTEX components and VOC groups. In case of VOC groups, there were quite significant differences in the concentration levels between AR and the other groups. The peak concentration (ppbC unit) of AR is often seen at the range of 30–60 (S and N). In contrast, those of the HPR and HOL were at 1.5 and 0.6–0.9, respectively. The high concentrations of the AR group are expected to come from the burning of fossil fuel in vehicles and outdated vehicle emission controls (Chan et al., 2003; Na et al., 2005). It is also produced during the petroleum refining process and evaporation during handling (Cetin et al., 2003).
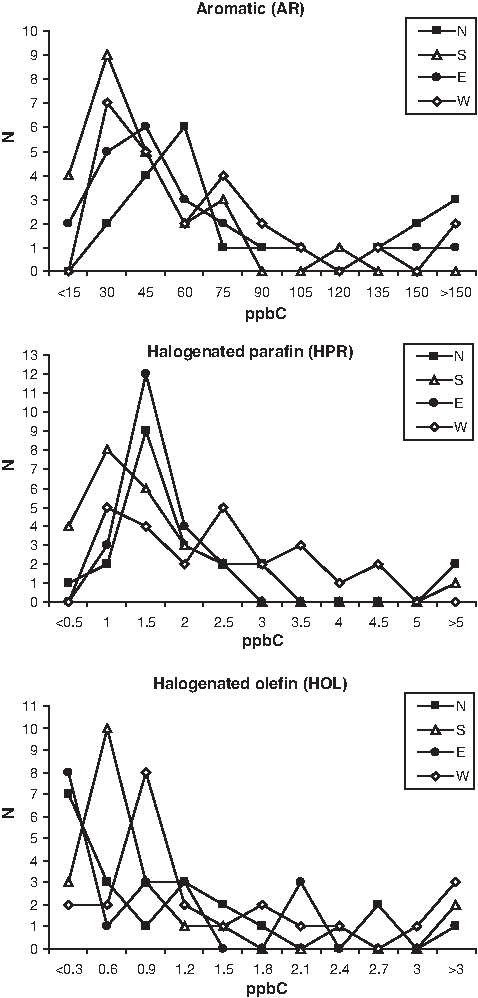
Frequency distribution of major VOC groups measured at the four sites in Seoul, Korea, in 2009.
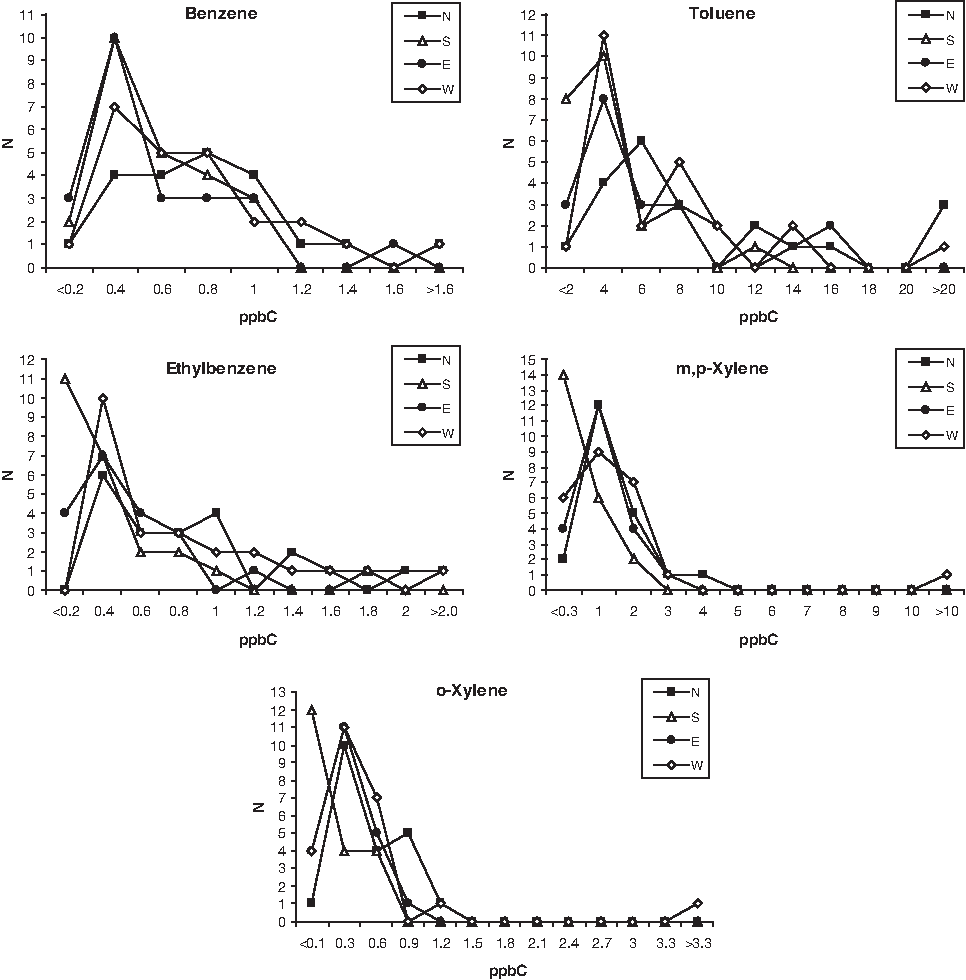
Frequency distribution of individual BTEX measured at the four sites in Seoul, Korea, in 2009.
Factors affecting the distributions of VOC
It is well known that the distribution of VOC can be governed by a number of factors such as source characteristics and their interplay with meteorological conditions. To learn more about the relationship between various factors, a correlation analysis was conducted by using VOC data and relevant environmental parameters collected at each site. For this analysis, their mean values derived from all monthly data were used. As shown in Table 3, the correlation strengths between different data pairs are evaluated in terms of the magnitude of probability (p) value. To allow for a meaningful comparison, the results were divided into three classes based on their strength of correlation as follows: (1) no class (the weakest correlation strength range) p>0.05, (2) class one asterisk (*): 0.01<p≤0.05 and (3) class two asterisk (**): p≤0.01. The presence of strong correlations (categories of class (2) and (3)) and their correlation coefficient (r-value) can also be used to evaluate relationships between different variables.
Probability of no correlation.
Correlation is significant at the 0.05 level (two tailed).
Correlation is significant at the 0.01 level (two tailed).
The total number of matching cases, regardless of correlation strengths.
BTEX, benzene, toluene, ethylbenzene, and xylene.
As shown in Table 3, strongly correlated pairs appear most abundantly between individual components (BTEX; i.e., 9 cases at site N, 10 at S, 10 at E, and 9 at W). Likewise, such a correlation was also observed between four chemical groups and individual components (BTEX; i.e., 11 cases at site N, 10 each at S and E, and 8 at W). The reason for highly abundant (strong) correlations can generally be explained by similarities in their emission sources or by similar chemical properties. In contrast, the correlation patterns derivable between different matching pairs (e.g., between four chemical groups or between VOCs and environmental parameters) did not show such abundance except for a few cases. For instance, temperature tends to occasionally exhibit strong correlations with VOCS. The effect of temperature on VOCs distribution was well known, as it facilitates emission or interacts with photo-degradation of VOCs (Wolkoff, 1998). Otherwise, wind speed can also influence the dispersion patterns of VOC in air (Peng and Lin, 1991). However, the results of the correlation analysis indicated that the possible existence of such relationships cannot be confirmed directly in the present study. There are only three cases of strong correlations between temperature and individual components, as benzene is sporadically tied to temperature (at site N). Such a pattern is also observed in toluene (at site W). According to this analysis, the strong correlation tended to occur more frequently from sites S and E than the other sites. Since site characteristics of sites S and E are characterized by relatively reduced VOC levels, the observed patterns appear to be affected by less pronounced source activities.
Comparison of VOC levels between present and previous studies
In order to evaluate the VOC levels measured in this study, our results were compared with those previously measured at other areas, especially at some urban centers located across the world (Table 4). According to this comparison, the data sets obtained from this study were fairly comparable to the results of other studies. To facilitate a direct comparison between different studies, the VOC concentration data expressed in different units (e.g., mass/volume) were converted into ppb unit by assuming 1 atm pressure and 25°C degree. As shown in Table 4, the concentration levels of most AR components were generally below or ∼1 ppb. The results also indicate that toluene was consistently the most abundant compound among most urban studies. It was also observed that the unusually high concentration of toluene was seen as 67 ppb in Cairo, Egypt (Khoder, 2007). It is found that vehicle fuels used in Greater Cairo are mainly unleaded gasoline and diesel, while few vehicles use compressed natural gas (Khoder, 2007). Likewise, high concentrations of toluene were seen as 39.8 ppb from Sung Su area in Seoul, Korea (Nguyen et al., 2009) and 20 ppb in Changchun, China (Liu et al., 2000). A fairly high concentration of benzene was observed in Birmingham city, United Kingdom (2.29 ppb: Kim et al., 2001), and Nanjing city, China (2.01 ppb: Wang and Zhao, 2008). The results of this analysis suggest that high concentration levels of VOC should be affected by various man-made activities in the center of megacity. Note that those cities have various sources including municipal facilities, manufacturing units, and a large number of apartment complexes by which the local VOC budget can be influenced.
The study was carried out before, during, and after the typhoon.
All data reported as xylene.
To facilitate the comparison of VOC levels between studies, we arbitrarily selected toluence concentration of 10 ppb as a simple criterion of VOC pollution. In this regard, as just discussed, unusually high concentration levels of VOCs were reported from many studies. However, as seen in our measurements, there are also many cases of study in urban areas wherein the relatively low concentrations of VOCs are prevalent: Raleigh, NC, Detroit, MI, and 13 urban locations in the United States (Batterman et al., 2002; Olson et al., 2009); Bilbao, Spain (Navazo et al., 2003); Birmingham in the United Kingdom (Kim et al., 2001); Hong Kong and Nanjing in China (Guo et al., 2007; Wang and Zhao, 2008); Shizuoka in Japan (Ohura et al., 2006) and Hsinchu in Taiwan (Nian et al., 2008). The mean concentration (ppb) of toluene varied in a wide range with minimum of 0.95 (Raleigh, NC) to maximum of 67 (Cairo, Egypt). As seen in Table 4, the high concentration level of toluene was commonly recorded in the Asian countries relative to European countries and America. In addition, moderate reductions in VOC levels are also recognized between studies of different time bands. The observed changes in VOC may be accounted for by a number of factors such as effective VOC controls (reduction in AR composition of fuels and organic solvents) and on industrial emissions, all of which may otherwise contribute as the predominant emission sources. In summary, it is possible to address that VOC concentration levels in most urban environments were comparable but moderately distinguished depending on source types and environmental conditions for a given site.
Conclusions
In order to describe the general pictures of VOCs distribution in urban areas of Korea, VOC levels were measured at four monitoring sites in Seoul between February and December 2009. A total of 27 compounds were measured and examined by both individual (BTEX) and four chemical groups (i.e., AR, HAR, HPR, and HOL). The highest concentrations of VOCs were found from toluene (7.48±3.88 ppb), while the lowest values were derived from vinyl chloride (0.04±0.04 ppb). The comparison of VOC levels indicates that the highest values were recorded from AR (71.1±42.1 ppbC).
The frequency distribution of VOC data showed that the peak concentration of AR group was often seen at 30 to 60 ppb (sites S and N), while those of the HPR and HOL were seen at significantly reduced levels of 1.5 and 0.6–0.9 ppb, respectively. In the case of BTEX components, the maximum frequency was generally seen in the following concentration range (ppb): toluene (4.0), m,p-xylene (1.0), ethylbenzene (0.4), benzene (0.4), and o-xylene (0.3). The components of HAR group were, however, detected only occasionally in some sites. The analysis of VOC data at monthly intervals indicate that VOC levels peaked most frequently in December, while reaching the lowest in July. The combined effects of low combustion efficiency and high fuel consumption of vehicles in winter months were suggested to contribute to the observed temporal trend of VOC. Moreover, their relative reduction in summer months corresponds to periods during which the depletion of VOC proceeds by photochemical degradation. In contrast, comparison of VOC data in spatial scale indicated that their distributions were, in general, moderately variable. However, since VOCs pollution is prevalent in most urban locations, further efforts are needed to effectively control them through development of more refined abatement technologies and the tightening of environmental regulations.
Footnotes
Acknowledgment
This study was supported by a National Research Foundation of Korea (NRF) grant funded by the Ministry of Education, Science and Technology (MEST; No. 2009-0093848).
Author Disclosure Statement
No competing financial interests exist.