
Abstract
Abstract
A novel genetic programming (GP) technique, a new method of evolutionary algorithms, was applied to a small data set to predict the water storage of Wolonghu wetland in response to the climate change in the northeastern part of China. Fourteen years (1993–2006) of annual water storage and climatic data of the wetland were used for model training and testing. Results of simulations and predictions illustrate a good fit between calculated water storage and observed values (mean absolute percent error=9.47, r=0.99). By comparison, a multilayer perceptron method (a popular artificial neural network model) and Grey theory model with the same data set were applied for performance estimation. It was found that GP technique had better performance than the other two methods, in both the simulation step and the predicting phase. The case study confirms that GP method is a promising way for wetland managers to make a quick estimation of fluctuations of water storage in some wetlands under the limitation of a small data set.
Introduction
Grings et al. (2009) have used radar remote sensing to explore the water storage of wetlands of the Paraná River Delta in Argentina. However, the remote sensing techniques and other relative techniques based on gamma-ray (Calder and Wright, 1986) and microwave attenuation (Bouten et al., 1996) are expensive to implement (Liu, 1998), although they are capable of monitoring the water level inside marshes on a regional scale (Bach and Mauser, 2003). Bradley (2002) used the MODFLOW to simulate the annual water table dynamics of a flood plain with a large amount of weekly data. So far, there are still not appropriate physical models used for wetland water storage forecasting for some difficulties. The primary reason rests with factors complexity; that means local natural and social conditions and so on around the wetland will surely influence the amount of water storage to a certain extent, which consequently increases the difficulty of modeling (Bradley, 2002; Kirk et al., 2004). And generally, mathematical models used for hydrological process modeling require a relatively long-term series of historical data (Trivedi and Singh, 2005). However, the availability of a large data set for model training and validation is not a problem in developed countries, as their hydrological data banks are relatively massive. However, in developing countries, such as China, a large hydrological data set is often unavailable, especially in remote rural areas. Therefore, choosing a suitable approach for water storage prediction under the limitation of a small data set will be of much practical utility.
The artificial neural network (ANN) method, due to its good potential of identifying correlations between input data and corresponding target values, has been widely used for hydrological modeling systems (Abrahart and Kneale, 1997; Dawson and Wilby, 1998; Zealand et al., 1999; Imrie et al., 2000; Baratti et al., 2003; Castellano-Méndez et al., 2004; Riad, et al., 2004; Valença, et al., 2005; Aqil et al., 2007). This method has also been shown to perform well with respect to conventional models. However, a large data set is needed for training when setting up an ANN model. A small data set usually led to poor performance. Grey theory model (GM) as a potential tool for modeling with a small data set (as few as four) has been successfully used in hydrological process modeling (Trivedi and Singh, 2003; Hao et al., 2006). But the data quality often influenced the performance of the method.
Genetic programming (GP) (Koza, 1992), a relatively new method of evolutionary algorithms, has been considered as one of the best methods in dealing with modeling for complex nonlinear conditions. It has been successfully applied in many applications (Whigham and Crapper, 2001; Kamal and Eassa, 2002; Duyvesteyn et al., 2005; Muttil and Lee, 2005; Lopes, 2007, Makkeasorn et al., 2008). GP can capture the relationship between the inputs and outputs automatically without the request of prior knowledge of the underlying physics, even when the data set is relatively small (Nath et al., 1997; Muttil and Lee, 2005).
In this study, we applied the GP method for estimating the fluctuations of water storage in the Wolonghu wetland, the biggest inland wetland in Liaoning Province, with a small data set. Two other popular forecasting methods, the multilayer perceptron (MLP) and the GM, a novel GP method, were applied for comparison. The article is organized as follows: first, a description of the study area and data is presented to allow readers to understand the background of the application. Then the key principles of GP are outlined, followed by its application to model annual water storage of the Wolonghu wetland. Subsequently, the results from the GP model are discussed and compared with those from the MLP and the GM methods. Finally, the conclusions are drawn.
Study Site and the Data Set
The research was carried out in the Wolonghu wetland, which is located at the remote north part of Liaoning Province in northeast China. Wolonghu wetland is the largest natural inland-wetland in Liaoning Province, covering an area of ∼112 km2 (Fig. 1). The major functions of the wetland are supporting biodiversity and regulation of water regime. The climate of the region is semiarid. Average annual precipitation and annual pan evaporation are 514 and 1933.2 mm, respectively. The annual mean air temperature is 7.6°C. The total available water resource of the region is 1.71×10⁸ m3, of which 0.43×10⁸ m3 is the surface water resource and 1.28×10⁸ m3 the underground water resource. Due to climate change and limited water resources, the wetland has developed a serious loss of biodiversity in recent years, which has greatly impeded the sustainable development of the ecosystem. To protect this important ecosystem, the local management department must make a plan of adaptive water resource allocation to meet the least water demand of Wolonghu wetland. And therefore, estimation of the fluctuations of the water storage in the wetland is sure to be helpful for the plan-making.
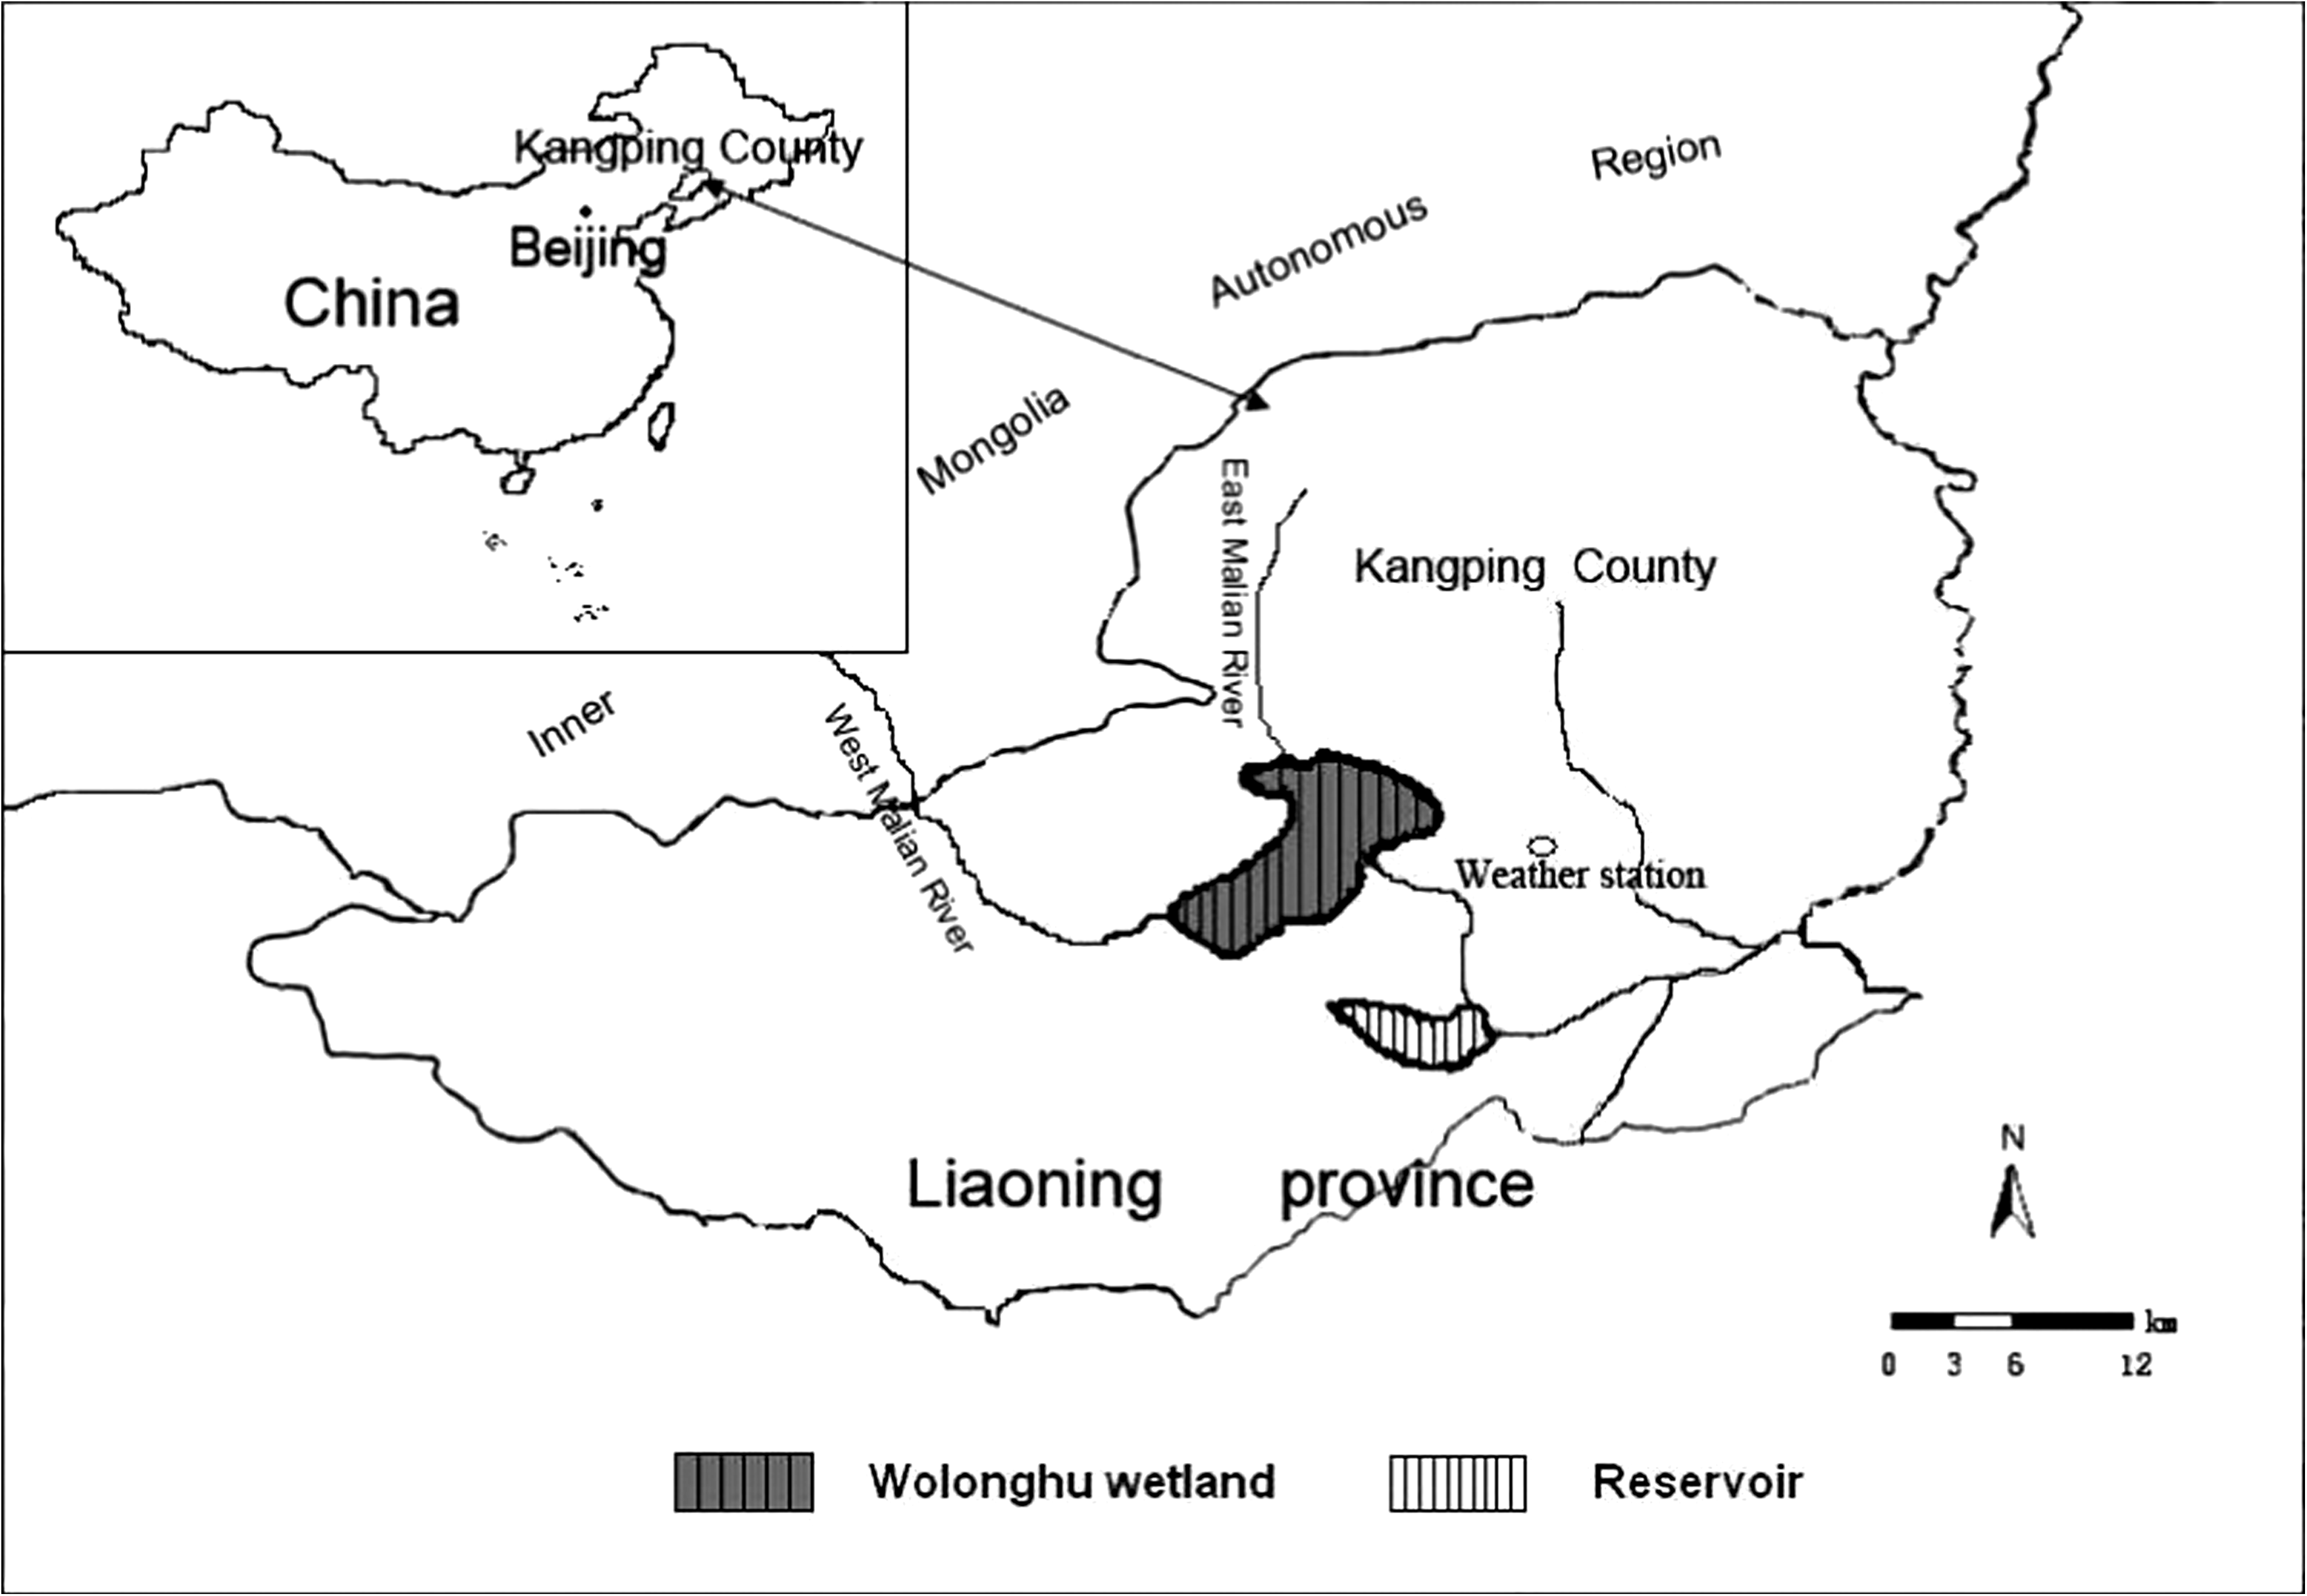
Study area.
In the Wolonghu wetland, precipitation is believed to be the primary source of recharge. Evapotranspiration, underground water recharge, and surface water outflow from the wetland are the main losses of the water in the wetland. In this rural area, gauge stations are sparse and the records of the underground water recharge and surface water outflow data sets needed for model setting are typically small, owing to cost difficulties. Moreover, the earliest annual water storage data of the wetland was recorded in 1993.
Genetic Programming
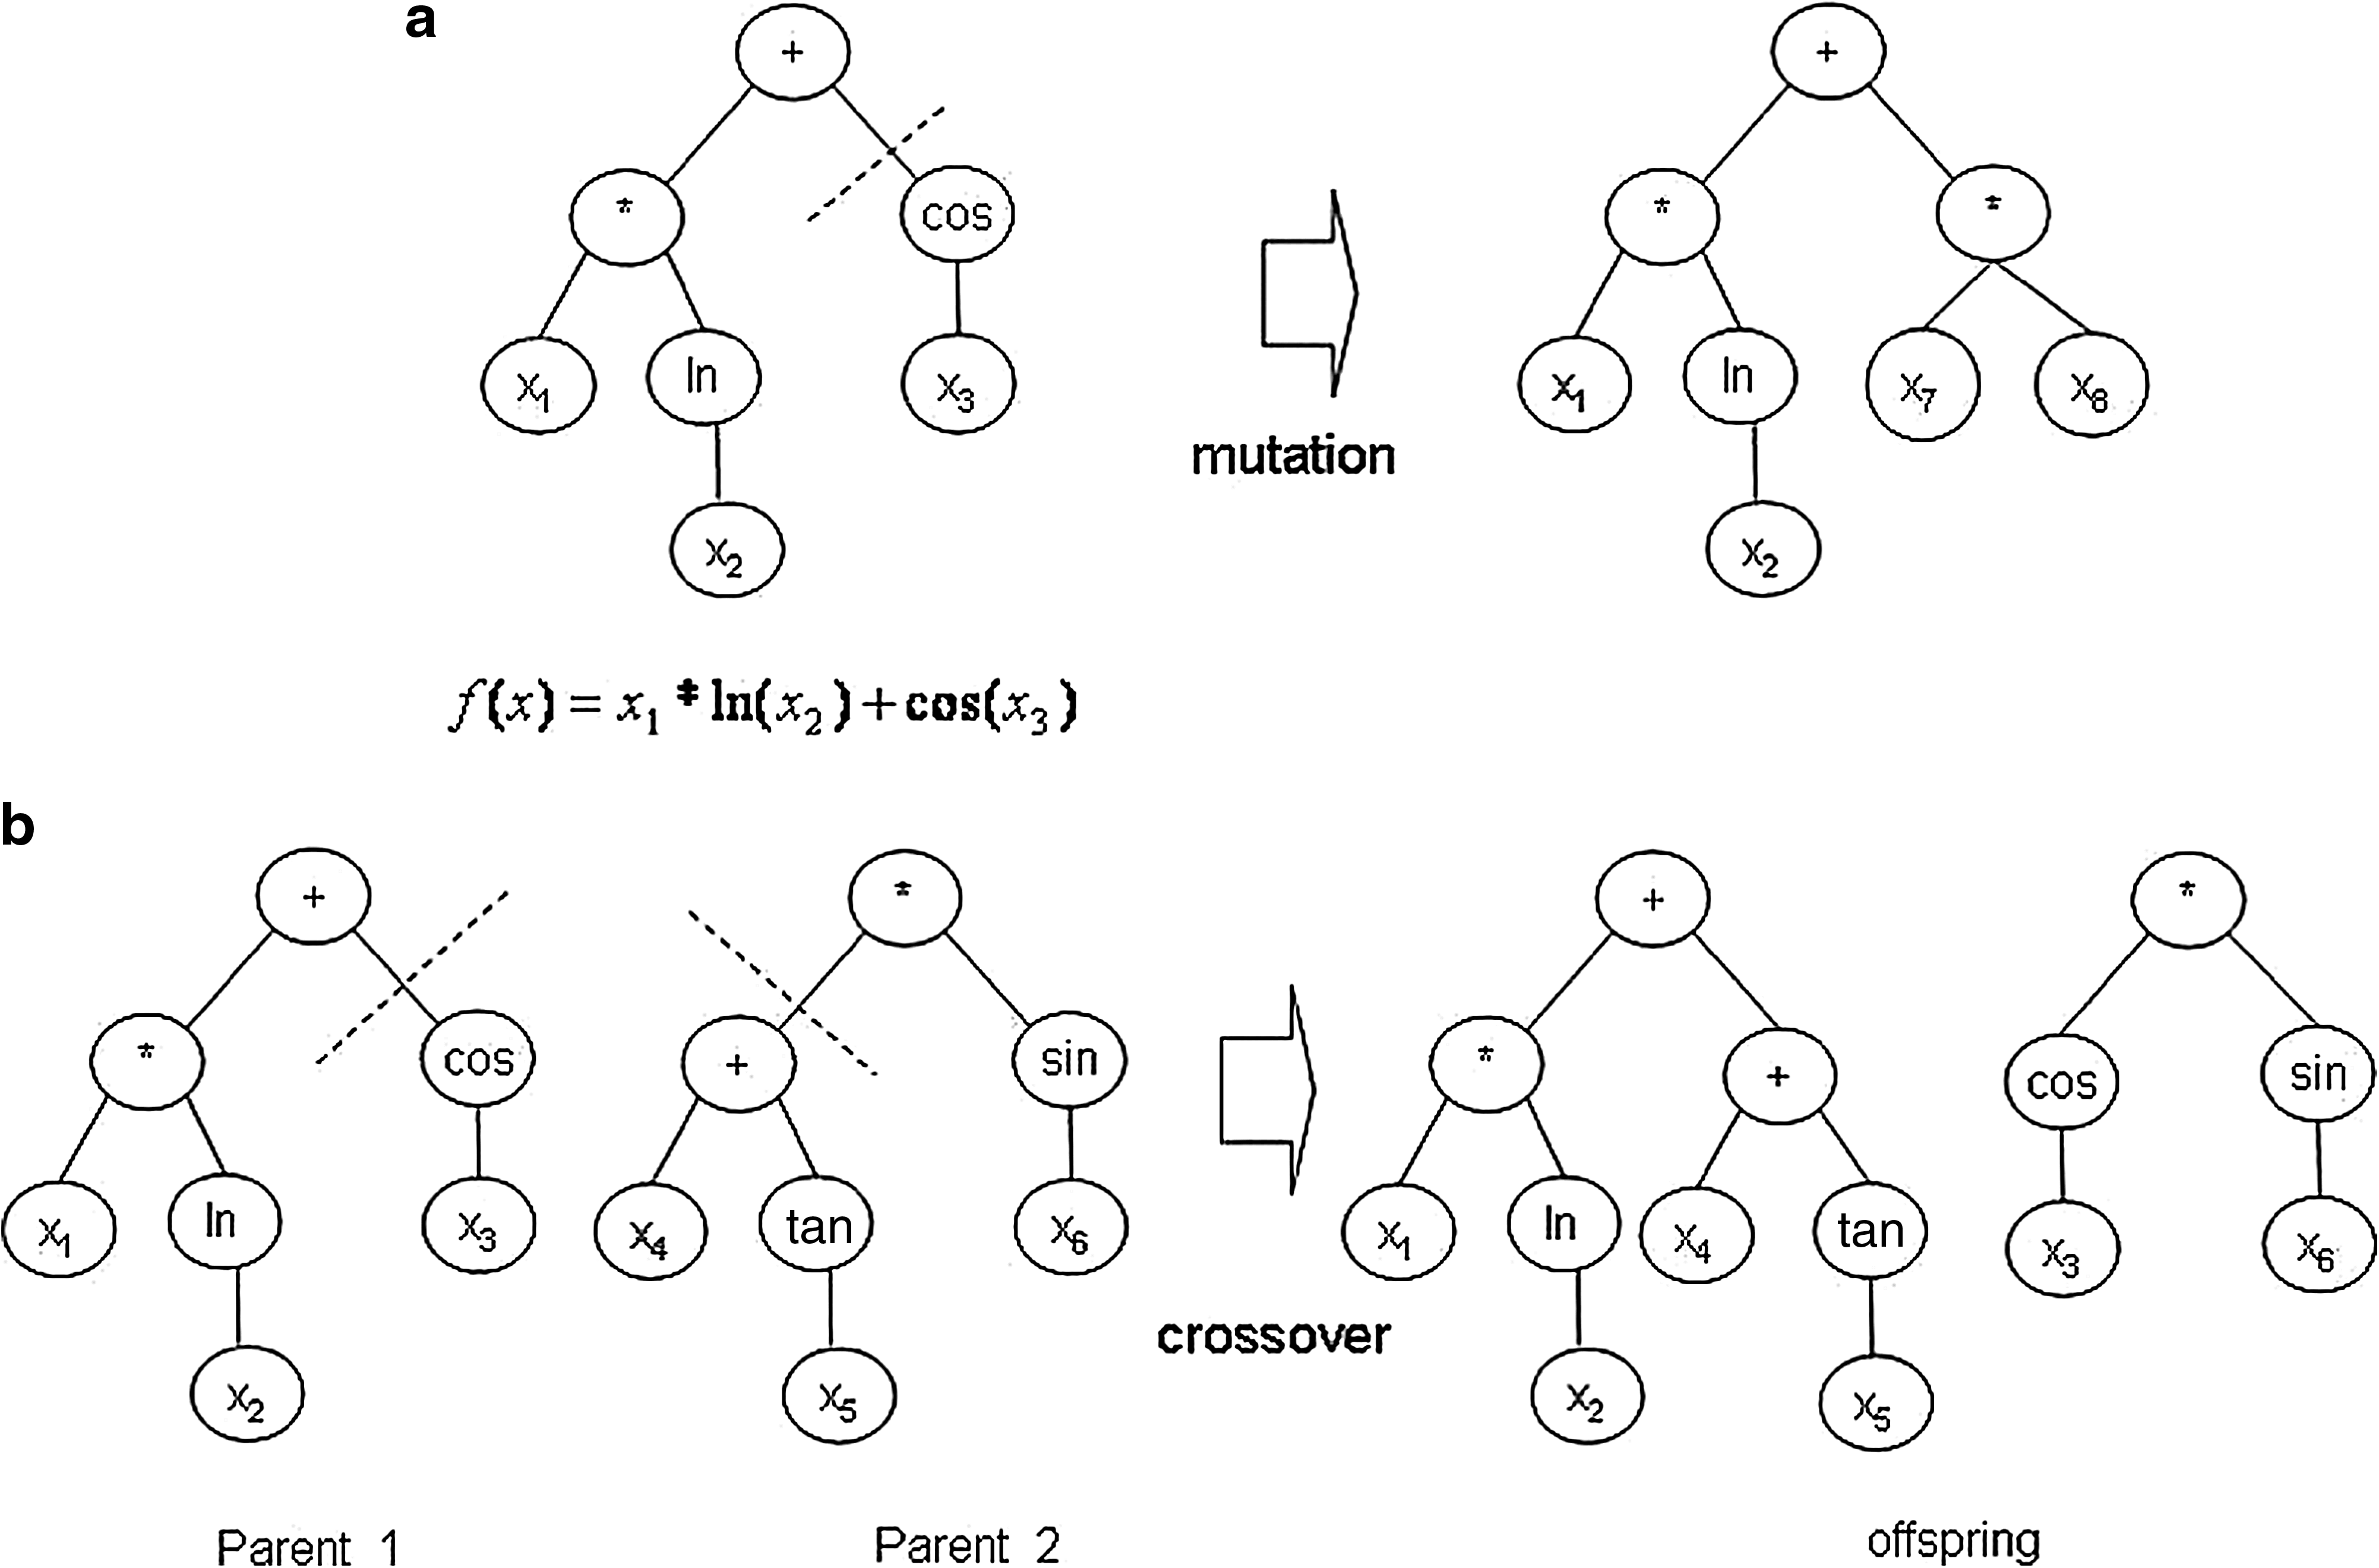
GP (Koza, 1992), an extension of genetic algorithm, is a relatively new approach to automatic modeling. It conducts its research in the space of computer programs (solutions of a problem) whose structure are represented by binary trees of varying size and shape. For example, an expressing of f(x)=x1 ln(x2)+cos(x3) is represented by the program (Fig. 2). The computer programs consist of internal node F={arithmetical functions, relation functions, etc.} and terminal node T={numerical constants, variables, etc.}. GP starts by randomly creating a population of computer programs consisting of the available nodes from F and T, and each population represents a function f(x) of the given data. Then, GP genetically evolves the population by using the Darwinian principle of natural selection in which the crossover and mutation are the main operations. Thus, GP provides a way to find a suitable solution to a problem.
The primary operators in GP are as follows:
(1) Selection: Pairs of parent trees are selected based on their fitness values for reproduction. (2) Crossover: This process is performed by randomly selecting a node and then exchanging the associated subtrees to produce a pair of offspring trees (Fig. 2b). (3) Mutation: This process is performed by replacing a node selected at random with a newly created subtree (Fig. 2a). This process can prevent the GP model from falling into the local optimum. For more information about selection, crossover, and mutation, refer to Wang and Cao (2002).
Before running a GP algorithm, five steps should be performed:
(1) Determine the terminal node set, T; (2) Determine the internal node set, F; (3) Determine the fitness function; (4) Determine parameters and variables for controlling the run; and (5) Determine criterion for terminating the GP algorithm.
Application
GP algorithm for water storage estimation
In this section, a forecasting model for water storage of Wolonghu wetland is to be obtained automatically evolved from the GP algorithm with small amount of data sets. We used the real values as the elements of the terminal node set T. Ten functions were chosen in the internal node set F for the purpose of the complicated nonlinear relationship between the inputs and the outputs. Of the set F, four are arithmetic operators (+, −, ×, ÷) and the rest are functional ones [exp(_), ln(_), cos(_), sin(_), tan(_), cot(_)]. The selection of the appropiate parameters of GP is necessary. Usually good GP performance also requires the choice of a high crossover probability, a low mutation probability, and a moderate population size (Cheng et al., 2002). The parameters for GP running are given in Table 1.
In GP, the fitness function was used to estimate the solutions in terms of the problem. In this study, we used Equation (1) as the fitness function:
where
As in the case studies of Levy Prairie (Kirk et al., 2004) and Narborough Bog (Bradley, 2002), in this study, Equation (2) was used to describe the fluctuations of the water storage of Wolonghu wetland.
where ΔS is the fluctuation of water storage in the wetland, P is precipitation, SWin is surface water flow into the wetland, ET is evapotranspiration, GWout is groundwater flow out of the wetland, and SWout is surface water flow out of the wetland.
Figure 3 is a plot of water storage, precipitation, and evapotranspiration data from 1993 to 2003. The figure indicates that water storage in Wolonghu wetland declined since 1993. The trend of water storage had almost the same trend with precipitation and the opposite trend with evapotranspiration. From these observations, we can possibly conclude that precipitation was the primary charge to the wetland and evapotranspiration mostly influenced the loss of water storage. As mentioned above, owing to cost difficulties of the remote rural region, the data sets of SWin, GWout, and SWout are unavailable. Therefore, we use the GP algorithm to capture the underlying relationships between water storage, P, and ET. According to the correlation coefficient between water storage and precipitation and evapotranspiration
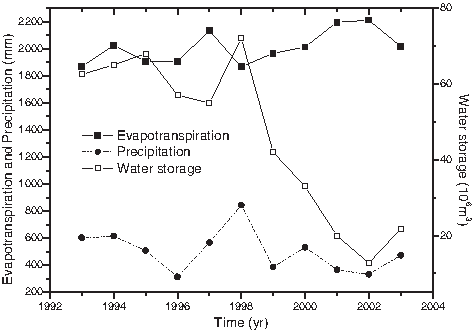
Time series of the estimated water storage and recorded evapotranspiration and precipitation.
where t refers to time of year, and P and ET represent the annual precipitation and annual evapotranspiration of the t year, respectively.
The steps of GP algorithm in this study are as follows:
(1) Randomly generate an initial population of models of the water storage (2) Run a tournament, which randomly picks two models out of the population, and apply the search operators (selection, crossover, or mutation) to produce an offspring (new model) in the following way: (a) With Crossover Frequency, apply crossover operation to produce an offspring. (b) With Mutation Frequency, mutate the models. (3) Compare all the models and remove the loser based on the fitness measure function [Eq. (1)]. (4) Repeat steps 2 and 3 until the termination criterion has been satisfied. (5) Display the model with the best fitness evolved from the GP.
The terminal criterion in this study is that the least fitness function value of Equation (1) is unchanged after 100 repeats of step 4. Otherwise, the program will continuously perform step 4.
Water storage and meteorological data covering the years 1993–2006 were divided into two parts, of which 11 years (1993–2003) of data was used during the training phase and the remaining 3 years of data (2004–2006) in the testing phase. The program of the GP algorithm was developed in language C and was run on a PC with a 2.4 GHz and 1 GB RAM memory, and the running time was <5 min.
The model automatically derived from the GP algorithm is Equation (4):
where x is the input value of |P−ET|, and
Results of simulated water storage by GP.
Boldface values were those used for model testing.
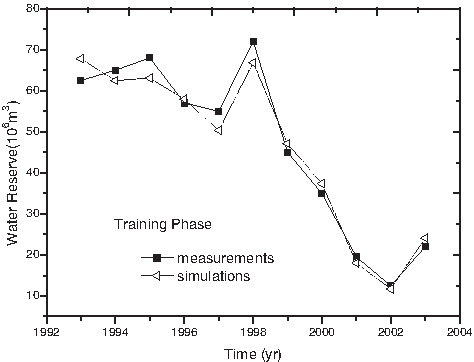
In Table 2, the minimum average relative error is 1.65% in 1996 and the maximum average relative error is 12.2% in 1999 during the training phase. The simulation curve is in substantial agreement with the measured data (Fig. 4).
Using the data of |P−ET| from 2004 to 2006 as input to Equation (4), the predicted annual water storages of Wolonghu wetland were calculated to be 32.20×10⁶ m3, 55.00×10⁶ m3, and 42.00×10⁶ m3, respectively. The relative errors are 8.50%, 9.60%, and 10.30% for 2004, 2005, and 2006, respectively.
Comparison with other methods
In this section, another two popular methods were introduced to do the same estimation of water storage in Wolonghu wetland. One is the MLP method, one of the most popular ANN architectures (Castellano-Méndez et al., 2004) and the other is the GM method (Deng, 1989), which has been applied successfully in hydrological modeling (Chiao et al., 1997; Trivedi and Singh, 2003; Hao et al., 2006).
For the MLP, a three-layer structure (see Fig. 5) with back-propagation learning algorithm was applied. The appropriate number of nodes in the hidden layer was determined by the rule of from 2n1/2+m to 2n+1 (Fletcher and Goss, 1993), which is helpful to prevent the MLP algorithm from being overfitting (Huang and Foo, 2002), where n is the number of input nodes and m is the number of the output nodes.
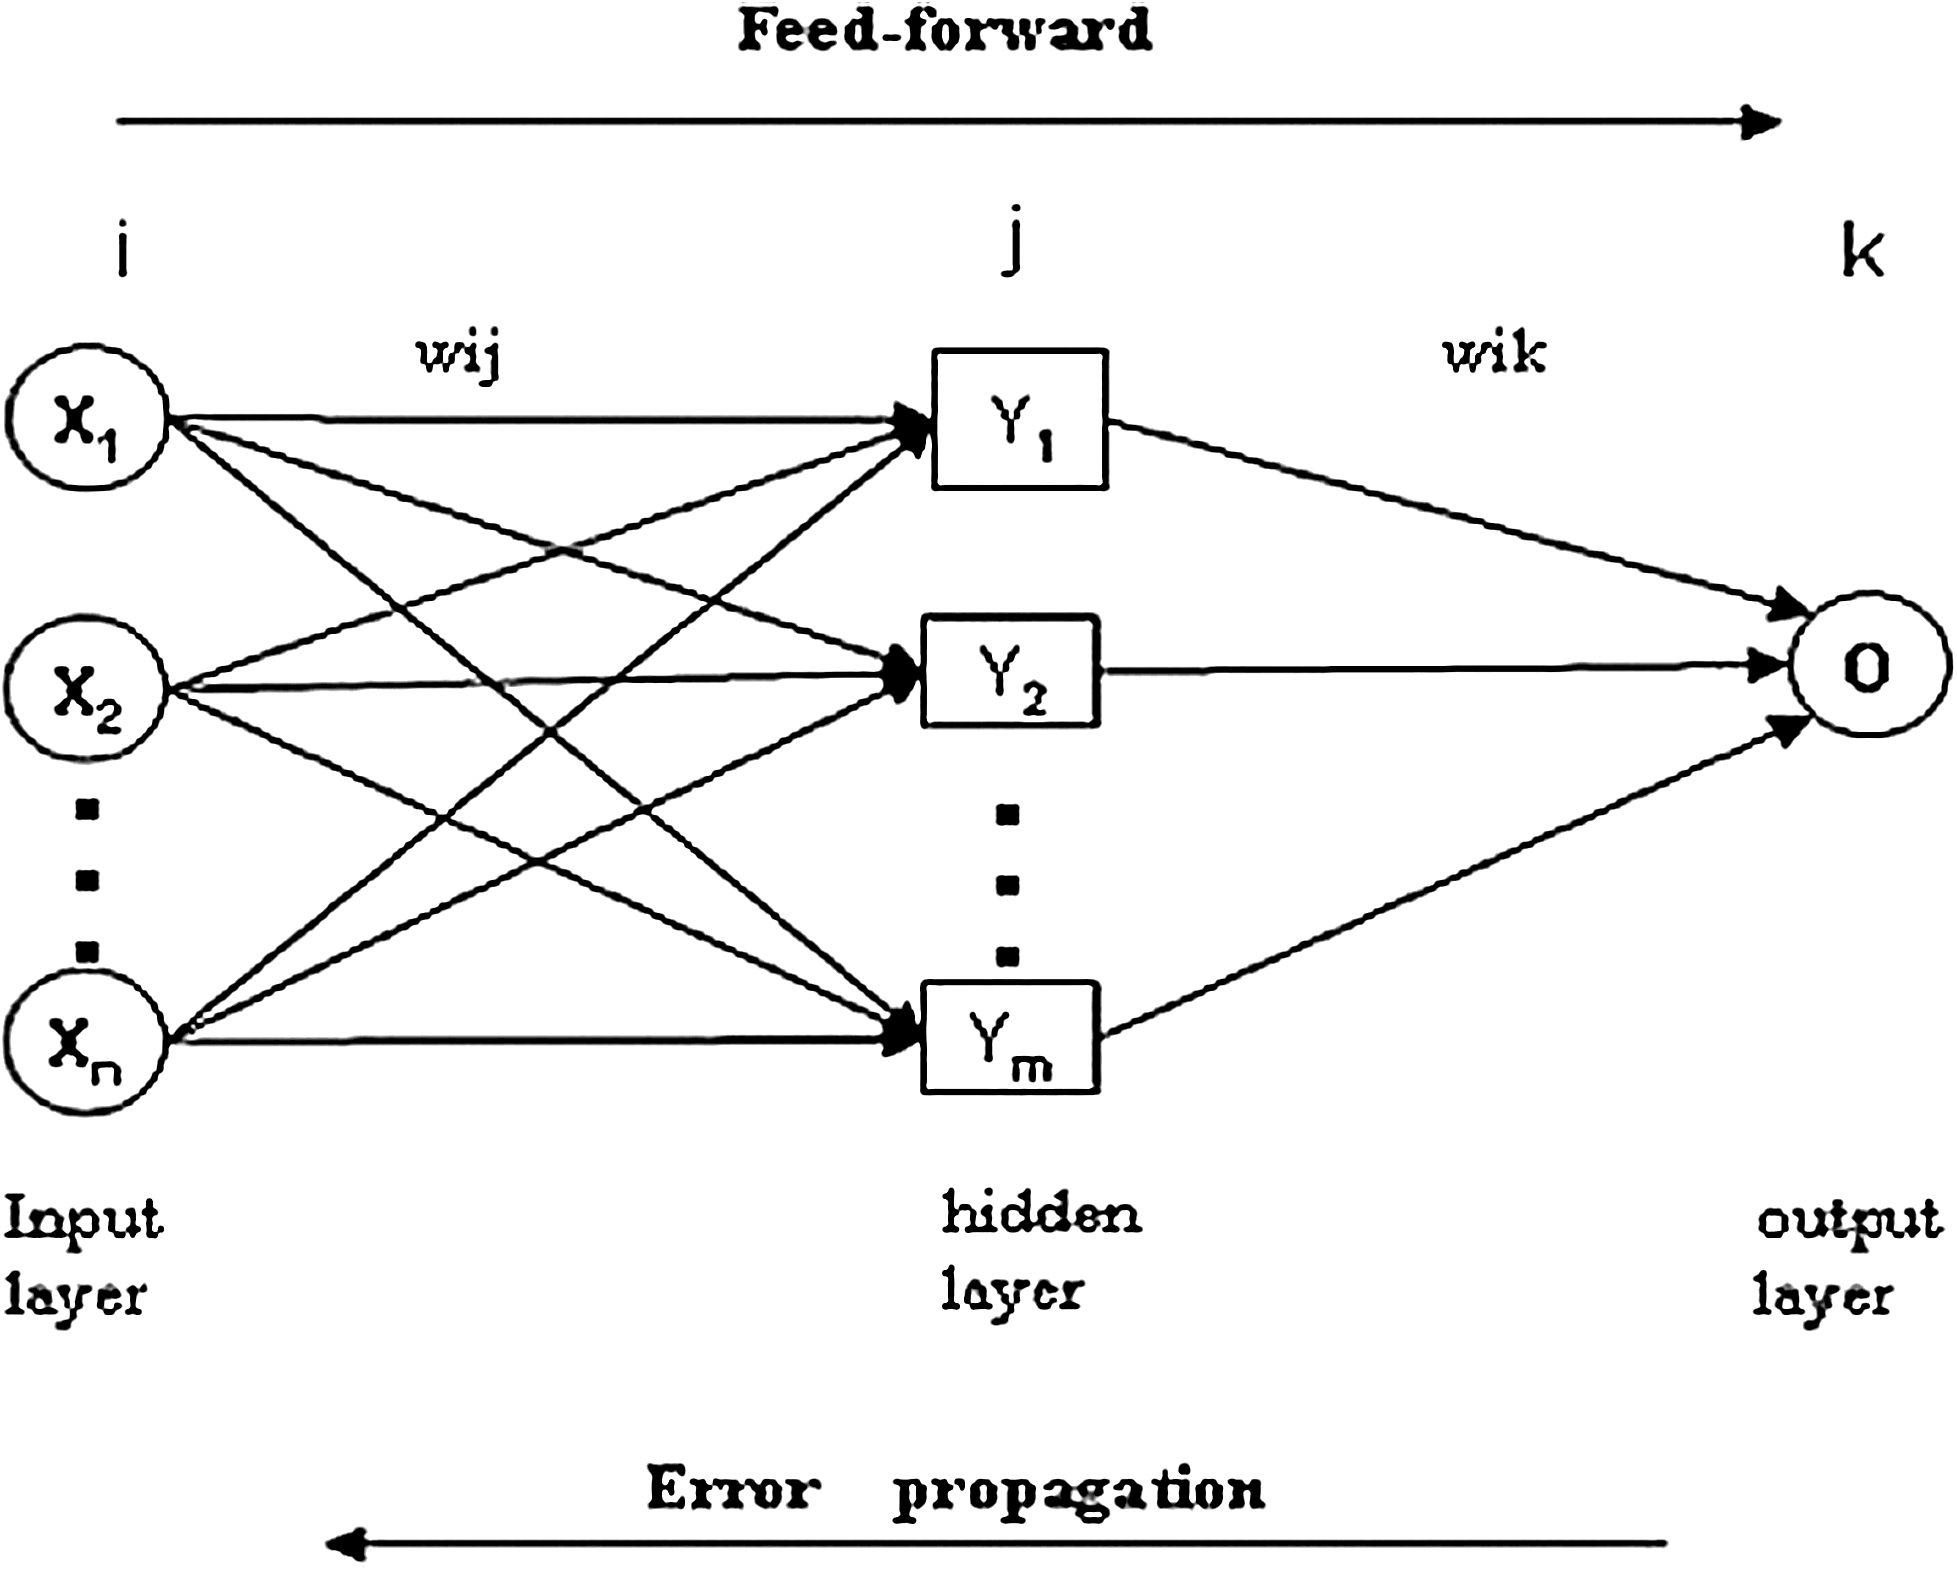
Three-layer feed-forward backpropagation multilayer perceptron (MLP) network.
For the GM method, the GM(1,2) model was set up for water storage forecasting. To get good performance of the GM(1,2) model, two models were set up according to the data division. One was GM(1,2) with data-1, of which data from 1993 to 2003 was used for model setting and data from 2004 to 2006 for model testing. The other was the GM(1,2) model with data-2, of which data from 1999 to 2003 (the data set is smoother than data-1 [see Fig. 3]) was used for model setting and data from 2004 to 2006 for model testing. See Hao et al. (2006) for detailed information of GM(1,2) model construction.
Evaluation
In this study, two criteria were used to evaluate the performances of the forecasting models.
The first measurement is mean absolute percent error (MAPE):
where Pt is the predicted value at time t, At is the measured value at time t, and n is the number of predictions.
The second criterion is the correlation coefficient r. The performances of the models and the comparative results were presented in Table 3 and Fig. 6.
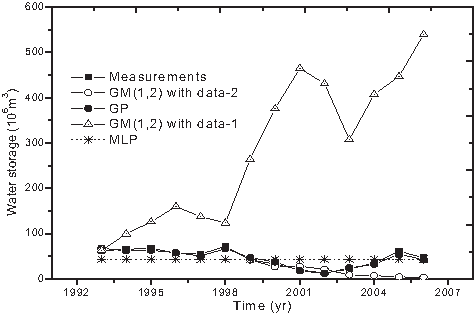
Simulation and estimated of water storage by GP, MLP, and Grey theory model [GM(1,2)].
GM, Grey theory model; GP, genetic programming; MAPE, mean absolute percent error; MLP, multilayer perceptron.
In Table 3, the GP method showed the best performance during both the training phase and testing phase with MAPE=8.25, r=0.98 in the training phase and MAPE=9.47, r=0.99 in the testing phase; whereas, the MLP performed with MAPE=61.64, r=0 in the training phase and MAPE=19.77, r=0 in the testing phase. The GM(1,2) models also performanced poorly compared with the GP model. Between the GM(1,2) models, the GM(1,2) with data-2 was better than GM(1,2) model with data-1.
In Fig. 6, the simulation and estimation curve of the GP model is in substantial agreement with the measured water storage data, whereas the curve of MLP is a straight line which had no correlation with the measured data. For the GM(1,2) models, the GM(1,2) model with data-1 was much different from the measured data, with high error of MAPE (987.85) in the testing phase. The GM(1,2) model with data-2 behaved better than both the GM(1,2) model with data-1 and the MLP model.
Discussion
The GP algorithm was applied to study the responses of water storage to climate change in Wolonghu wetland in the semiarid region of China. By using the GP algorithm, it is possible to simulate the change of water storage in Wolonghu wetland. The simulation and prediction curve matched well with the measured data under the limitation of a small data set. Based on the values of MAPE and r of the GP method (Table 2), we can conclude that the water storage in Wolonghu wetland is positively correlated with the precipitation and evapotranspiration. It therefore seems realistic to reemphasize that climate change is likely to have a significant impact on water storage in Wolonghu wetland in the semiarid region of northeast of China.
In the process of comparison, the reasons for poor performance of the MLP method and GM model are discussed. For the MLP method, the reason is probably that the network of the MLP is not convergent, which usually occurs when the network is not well-trained due to inavailability of large data sets for training, and the straight line of MLP in Fig. 6 confirms this. Moreover, the BP algorithms used in MLP are a researching tool of optimum value in a local area. It always leads to the local optimum and result in failure of network training when encountering the request of global optimum. Moreover, the choice of an appropriate network for a fixed case is another problem which is not well solved so far.
For the GM(1,2) models, the reason for poor performance is probably that there were more peaks in the data sets. We know that GM is a potential tool for modeling with a small data set (as few as four). However, the data quality often influences the performance of the method. In other words, the GM usually performed well when the data series satisfied the Grey exponential law (Li, 1992), and peaks in the data set often led to poor performance. We divided the data set into two parts (data-1 and data-2); in this study, data-2 was smoother than data-1. In contrast, the GP algorithm has the potential to automatically capture the relationship between the inputs and outputs without prior knowledge of the underlying physics, because it takes the errors as its inner motivation and evolves through operation of crossover and mutation, which help it to get as close to the global optimal solution as possible even with a small data set.
Conclusions
Water storage is the key factor for a wetland ecosystem (Kirk, et al., 2004). In this study, the GP method provided a quick and flexible means of creating a model and was successfully applied to simulate water storage of Wolonghu wetland in China. Taking |P−ET| as the input, annual water storage as the output, a simple specific model was automatically obtained from the GP algorithm. By using the model [Eq. (4)], we got the results of predicted annual water storage in Wolonghu wetland to be 32.20×10⁶ m3, 55.00×10⁶ m3, and 42.00×10⁶ m3, in the years 2004, 2005, and 2006, respectively. The relative errors are 8.50%, 9.60%, and 10.30%, respectively. The model predictions are in substantial agreement with the measured data (MAPE=9.47, r=0.99), in contrast with MLP (MAPE=19.77, r=0), GM(1,2) with data-1 (MAPE=987.85, r=−0.83), and GM(1,2) with data-2 (MAPE=88.06, r=−0.74). Results from comparison indicate that the GP algorithm can be used as a cost-effective and easy-to-use alternative tool for managers to evaluate water storage variation, especially for managers of a region where the data set was small. The results also indicated that the climate changes of the area impacted fluctuations of water storage in the wetland.
Footnotes
Acknowledgments
The authors would like to express cordial thanks to the National Key Project of Major Science and Technology Program for Water Pollution Control and Treatment (2009ZX07528-006-2) in China and Chinese College Research Fund on Vital Projects (No. 705011) for the financial support.
Author Disclosure Statement
No competing financial interests exist.