
Abstract
Abstract
This study investigated the influence of polychlorinated dibenzo-p-dioxins and dibenzofurans (PCDD/Fs) in the waste gas from an incinerator on the surrounding environment. A series of air and soil samples were collected at distances from 1.35 to 4.72 km from a typical municipal solid waste incineration plant along the prevailing north wind direction. Concentrations of PCDD/Fs in the ambient air samples ranged from 0.23 to 1.66 pg I-toxic equivalent (TEQ)/m3, with an average of 0.82 pg I-TEQ/m3; while concentrations in the soil samples varied from 0.54 to 1.96 pg I-TEQ/g, with an average of 1.33 pg I-TEQ/g. Principal component analysis and hierarchical cluster analysis showed that the municipal solid waste incinerator has a potential influence on the environmental level of PCDD/Fs, and that emissions from traffic also play an important role.
Introduction
Researches on PCDD/F levels in ambient air and soil have been conducted in many countries in past decades, including Italy (Caserini et al., 2004), Japan (Takei et al., 2000), Spain (Schuhmacher et al., 1998, 2000; Domingo et al., 2001), the United States (Lorber et al., 1998, 2000), Korea (Oh et al., 2001, 2006; Lee et al., 2007), and Portugal (Coutinho et al., 2001). Until now, only limited investigations of atmospheric PCDD/F pollution around MSWIs have been carried out in China. The available data (Cheng et al., 2003; Chao et al., 2004; Yu et al., 2006; Li et al., 2007, 2008a, 2008b; Wu et al., 2009) indicate that PCDD/F levels in some cities such as Shanghai, Guangzhou, and Hangzhou are comparable to or a little higher than those in other areas around the world.
The Cysunrise Municipal Solid Waste Incineration Plant (referred to hereafter as CY) is situated in China and has an annual treatment capacity of about 300,000 tons. This originally agricultural area now coexists with residential areas, in addition to schools and shopping malls, but with no heavy industry. PCDD/Fs emitted from the CY may impose negative health effects upon the surrounding residents. This study is expected to be helpful in estimating the PCDD/Fs released into the ambient environment and answering public concerns over the MSWIs.
Materials and Methods
Stack gas sampling
Three stack gas samples were isokinetically collected from the CY stacks according to the Chinese national guidelines (HJ77.2) for PCDD/F emission analysis. Samples were collected using the ISO BASIC System (Tecora Corp.). The gaseous phase samples were collected by XAD-2 resin and condensed water, while the particulate phases were trapped by a quartz-fiber filter (QFF). After sampling, the probe liners were washed with acetone and the washing solutions retained for analysis. All the analytical samples, consisting of the filter, XAD-2 resin, concentrated water and washing solution, were stored in darkness and analyzed as soon as possible after collection.
Air and soil sampling
Taking CY as the central point, nine sampling sites (A, B to I) were selected, broadly along the prevailing north wind direction, at distances from 1.35 (A) to 4.72 (F) km away. Ambient air and soil samples were collected at the same time from each site during the same period in December, 2010. During sampling the weather was cold and sunny with a moderate north breeze. Figure 1 shows the distribution of the sampling sites. Sampling sites A, B, and C were situated on the windward side of CY, while sites D to I were on the leeward side.

Location of sampling sites around Cysunrise Municipal Solid Waste Incineration Plant.
Air concentration measurements were carried out with a high-volume sampler (Tecora Corp.) in compliance with US EPA Method TO-9A. Each air sample was collected over 48 h, and total column volumes were 600–700 m3.The particulate matter was collected with a QFF and two polyurethane foam (PUF) traps were used to trap dioxins in the gas phase. After sampling, the QFF and PUF were separately wrapped in hexane-rinsed aluminum foil and stored in sealed PE bags. After transport to the laboratory, they were stored at −20°C until analysis.
Each soil sample was collected by mixing five different aliquots on the basis of the five plum distribution method within a 25 m2 area. About 2 kg of soil was collected with a metal hand-operated sampler, to a depth of about 5–15 cm. After drying to constant weight, the samples were ground and homogenized through a 60-mesh sieve and refrigerated before analysis.
Sample preparation and analysis
The PCDD/F analysis was performed according to US EPA Method 1613 and EPA Compendium Method TO-9A. The detailed clean-up procedure is described elsewhere (Li et al., 2008b). Briefly, the sample was spiked with 1 ng of a 13C12-labeled internal standard prior to accelerated solvent extraction (hexane:dichloromethane=1:1). Then, the extract was sequentially cleaned by multilayer silica gel and basic alumina columns. The final extract was concentrated to 20 μL and spiked with 1 ng of the 13C12-labeled injection standard for recovery quantification before analysis using HRGC/HRMS with a DB-5 column. The PCDD/Fs were quantified using Agilent 6890 gas chromatography coupled with an Autospec Ultima high-resolution mass spectrometer with an electron impact ion source. The HRMS was operated in SIM mode at R≥10,000. Field and laboratory blanks were incorporated into the analytical procedure for the purpose of quality control. The recovery range of 17 congeners of 2,3,7,8-PCDD/Fs was between 44.5 and 111.6%, which met the limits of PCDD/Fs analysis.
Results and Discussion
PCDD/Fs levels in the CY stack gas samples
Figure 2 shows the I-toxic equivalent (TEQ) profiles of 2,3,7,8-PCDD/Fs in the stack gas samples.
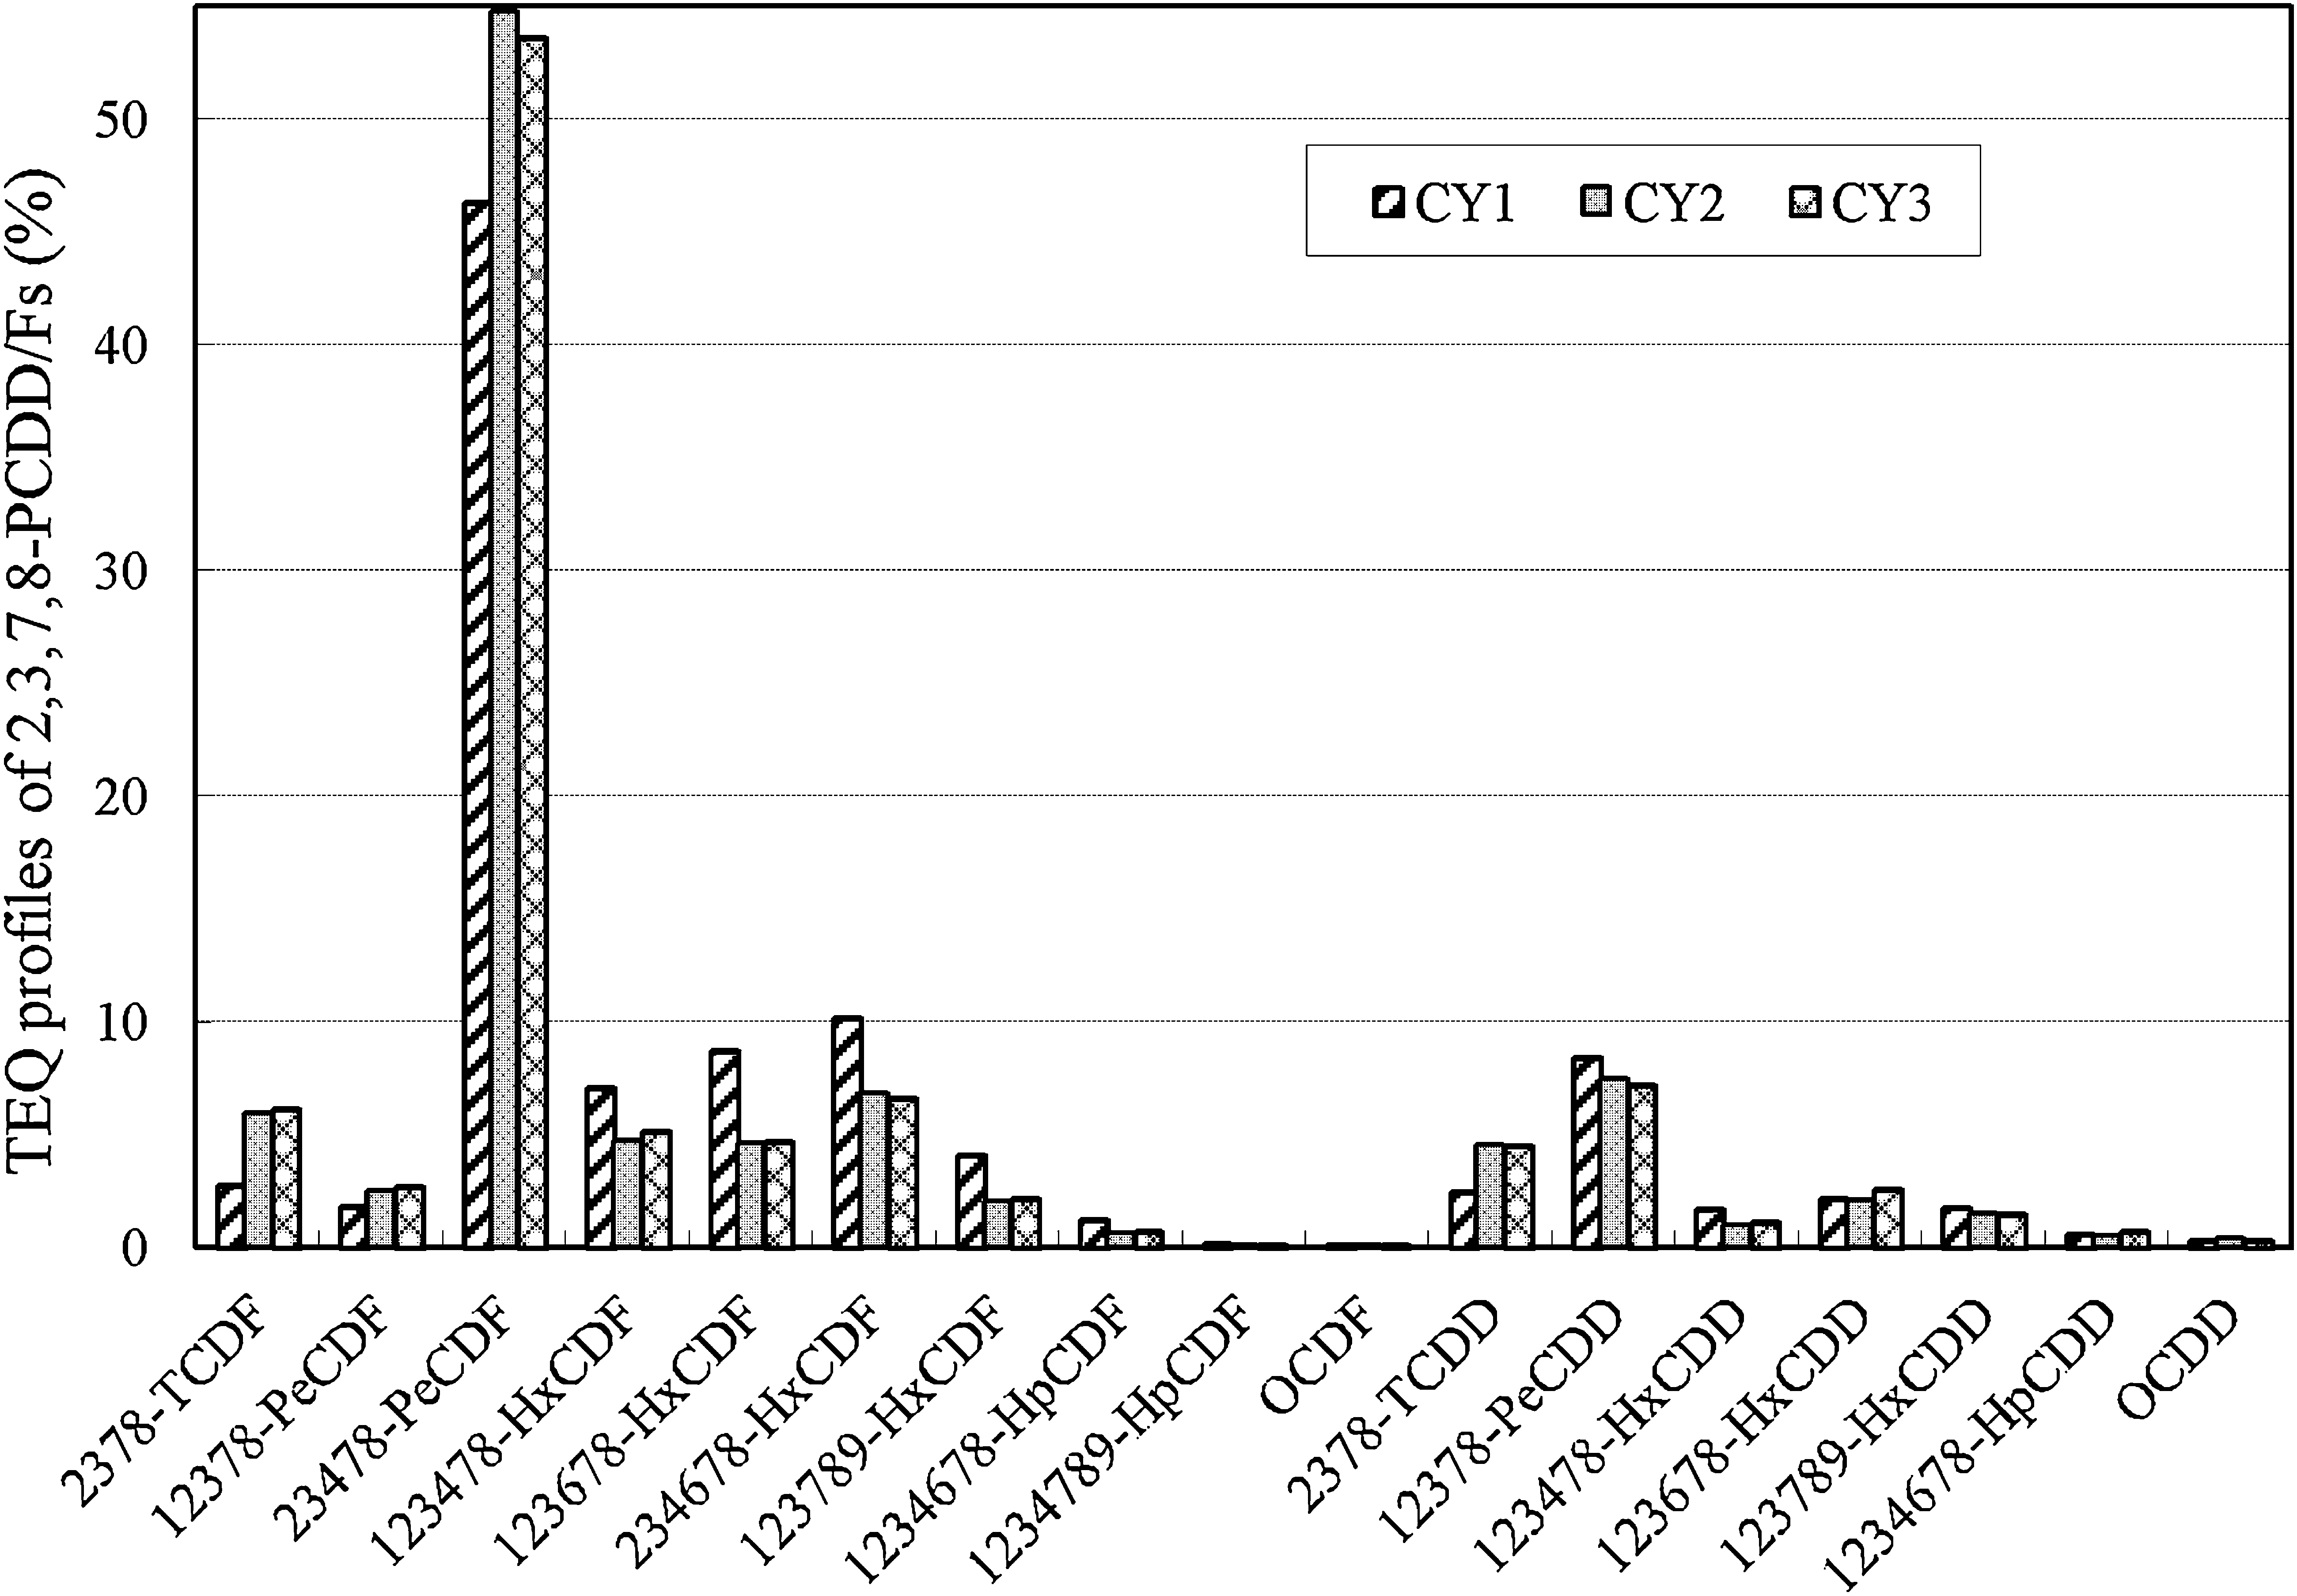
TEQ profiles of 2,3,7,8-PCDD/Fs in the stack gas samples. PCDD/Fs, polychlorinated dibenzo-p-dioxins and dibenzofurans; TEQ, toxic equivalent.
The concentrations of PCDD/Fs in the three stack gas samples were 1525.6, 1134.9, and 587.2 pg/m3, and the corresponding TEQs were 98.5, 79.0, and 55.5 pg I-TEQ/m3, respectively, calculated based on the International Toxic Equivalent Factors (I-TEFs). 2,3,4,7,8-PeCDF, 1,2,3,7,8-PeCDD, and 2,3,4,6,7,8-HxCDF are the three major contributors to I-TEQs, with 2,3,4,7,8-PeCDF being the single most important congener, regardless of the PCDD/F levels, accounting for 51.3% of the toxic equivalents.
It has been reported that homologue patterns are similar among various thermal processes, with PCDF percentages being higher than that of PCDDs (Hagenmaier et al., 1994; Buekens et al., 2000). Therefore, the PCDD/PCDF (D/F) ratio can serve as an indicator of contamination from thermal sources (Aurell et al., 2009a). In this study, the D/F ratios of three stack gas samples were 0.36, 0.57, and 0.77, respectively. OCDD was the dominant homologue, accounting for 25.4% of the total concentration.
PCDD/Fs levels in the ambient air samples
Table 1 presents the levels of 2,3,7,8-PCDD/Fs in the ambient air samples.
TEQ, toxic equivalent; nd, not detected.
The average I-TEQ value of PCDD/Fs in the ambient air samples was 0.82 pg I-TEQ/m3. The lowest was 0.23 pg I-TEQ/m3 at site I, while the highest was 1.66 pg I-TEQ/m3 at site B. Concentrations of 1,2,3,4,6,7,8-HpCDF, 1,2,3,4,6,7,8-HpCDD, OCDF, and OCDD were relatively high in the air samples. However, in terms of TEQ, 2,3,4,7,8-PeCDF and 1,2,3,7,8-PeCDD were the dominant congeners, with average percentages of 31.56% and 10.72%, respectively.
Until now, only limited investigations of atmospheric PCDD/F pollution around MSWIs have been carried out in China and concentrations were higher than measured in this study. Concentrations in air samples from Hangzhou ranged from 0.059 to 3.03 pg I-TEQ/m3 (Xu et al., 2009b), and in Guangdong the average value was 8.77 pg I-TEQ/m3 (Yu et al., 2008). Comparison of PCDD/F concentrations in this study with globally reported values shows that they are at relatively high levels. Ambient air concentrations in three typical sites around different MSWIs in Italy were 0.010–0.337 pg I-TEQ/m3 (Caserini et al., 2004), while concentrations in Oporto, Portugal, were 0.022–0.548 pg WHO-TEQ/m3 (Coutinho et al., 2001). A large variation in PCDD/F concentrations, ranging from 0.071 to 1.161 pg I-TEQ/m3, was observed in Korea (Oh et al., 2006).
PCDD/F homologue profiles in the air at the various sampling sites are shown in Fig. 3. The sum of all homologue concentrations of PCDD/Fs varied between 6.89 and 96.31 pg/m3, with an average of 47.87 pg/m3. The lowest concentration was found at site I, with the highest at site D. Concentrations of PCDDs (range 2.26–31.75 pg/m3; average 14.41 pg/m3) are lower than the PCDFs (range 4.30–75.29 pg/m3; average 33.08 pg/m3). Lower-chlorinated homologues such as TCDD, TCDF, and PeCDF account for most of the total PCDD/F concentrations. The D/F ratios in the air samples were between 0.28 and 0.78, which are consistent with the results of the stack gas samples, showing PCDD/F emission characteristics of thermal processes and suggesting a potential influence of the incineration plant on the surrounding environment.
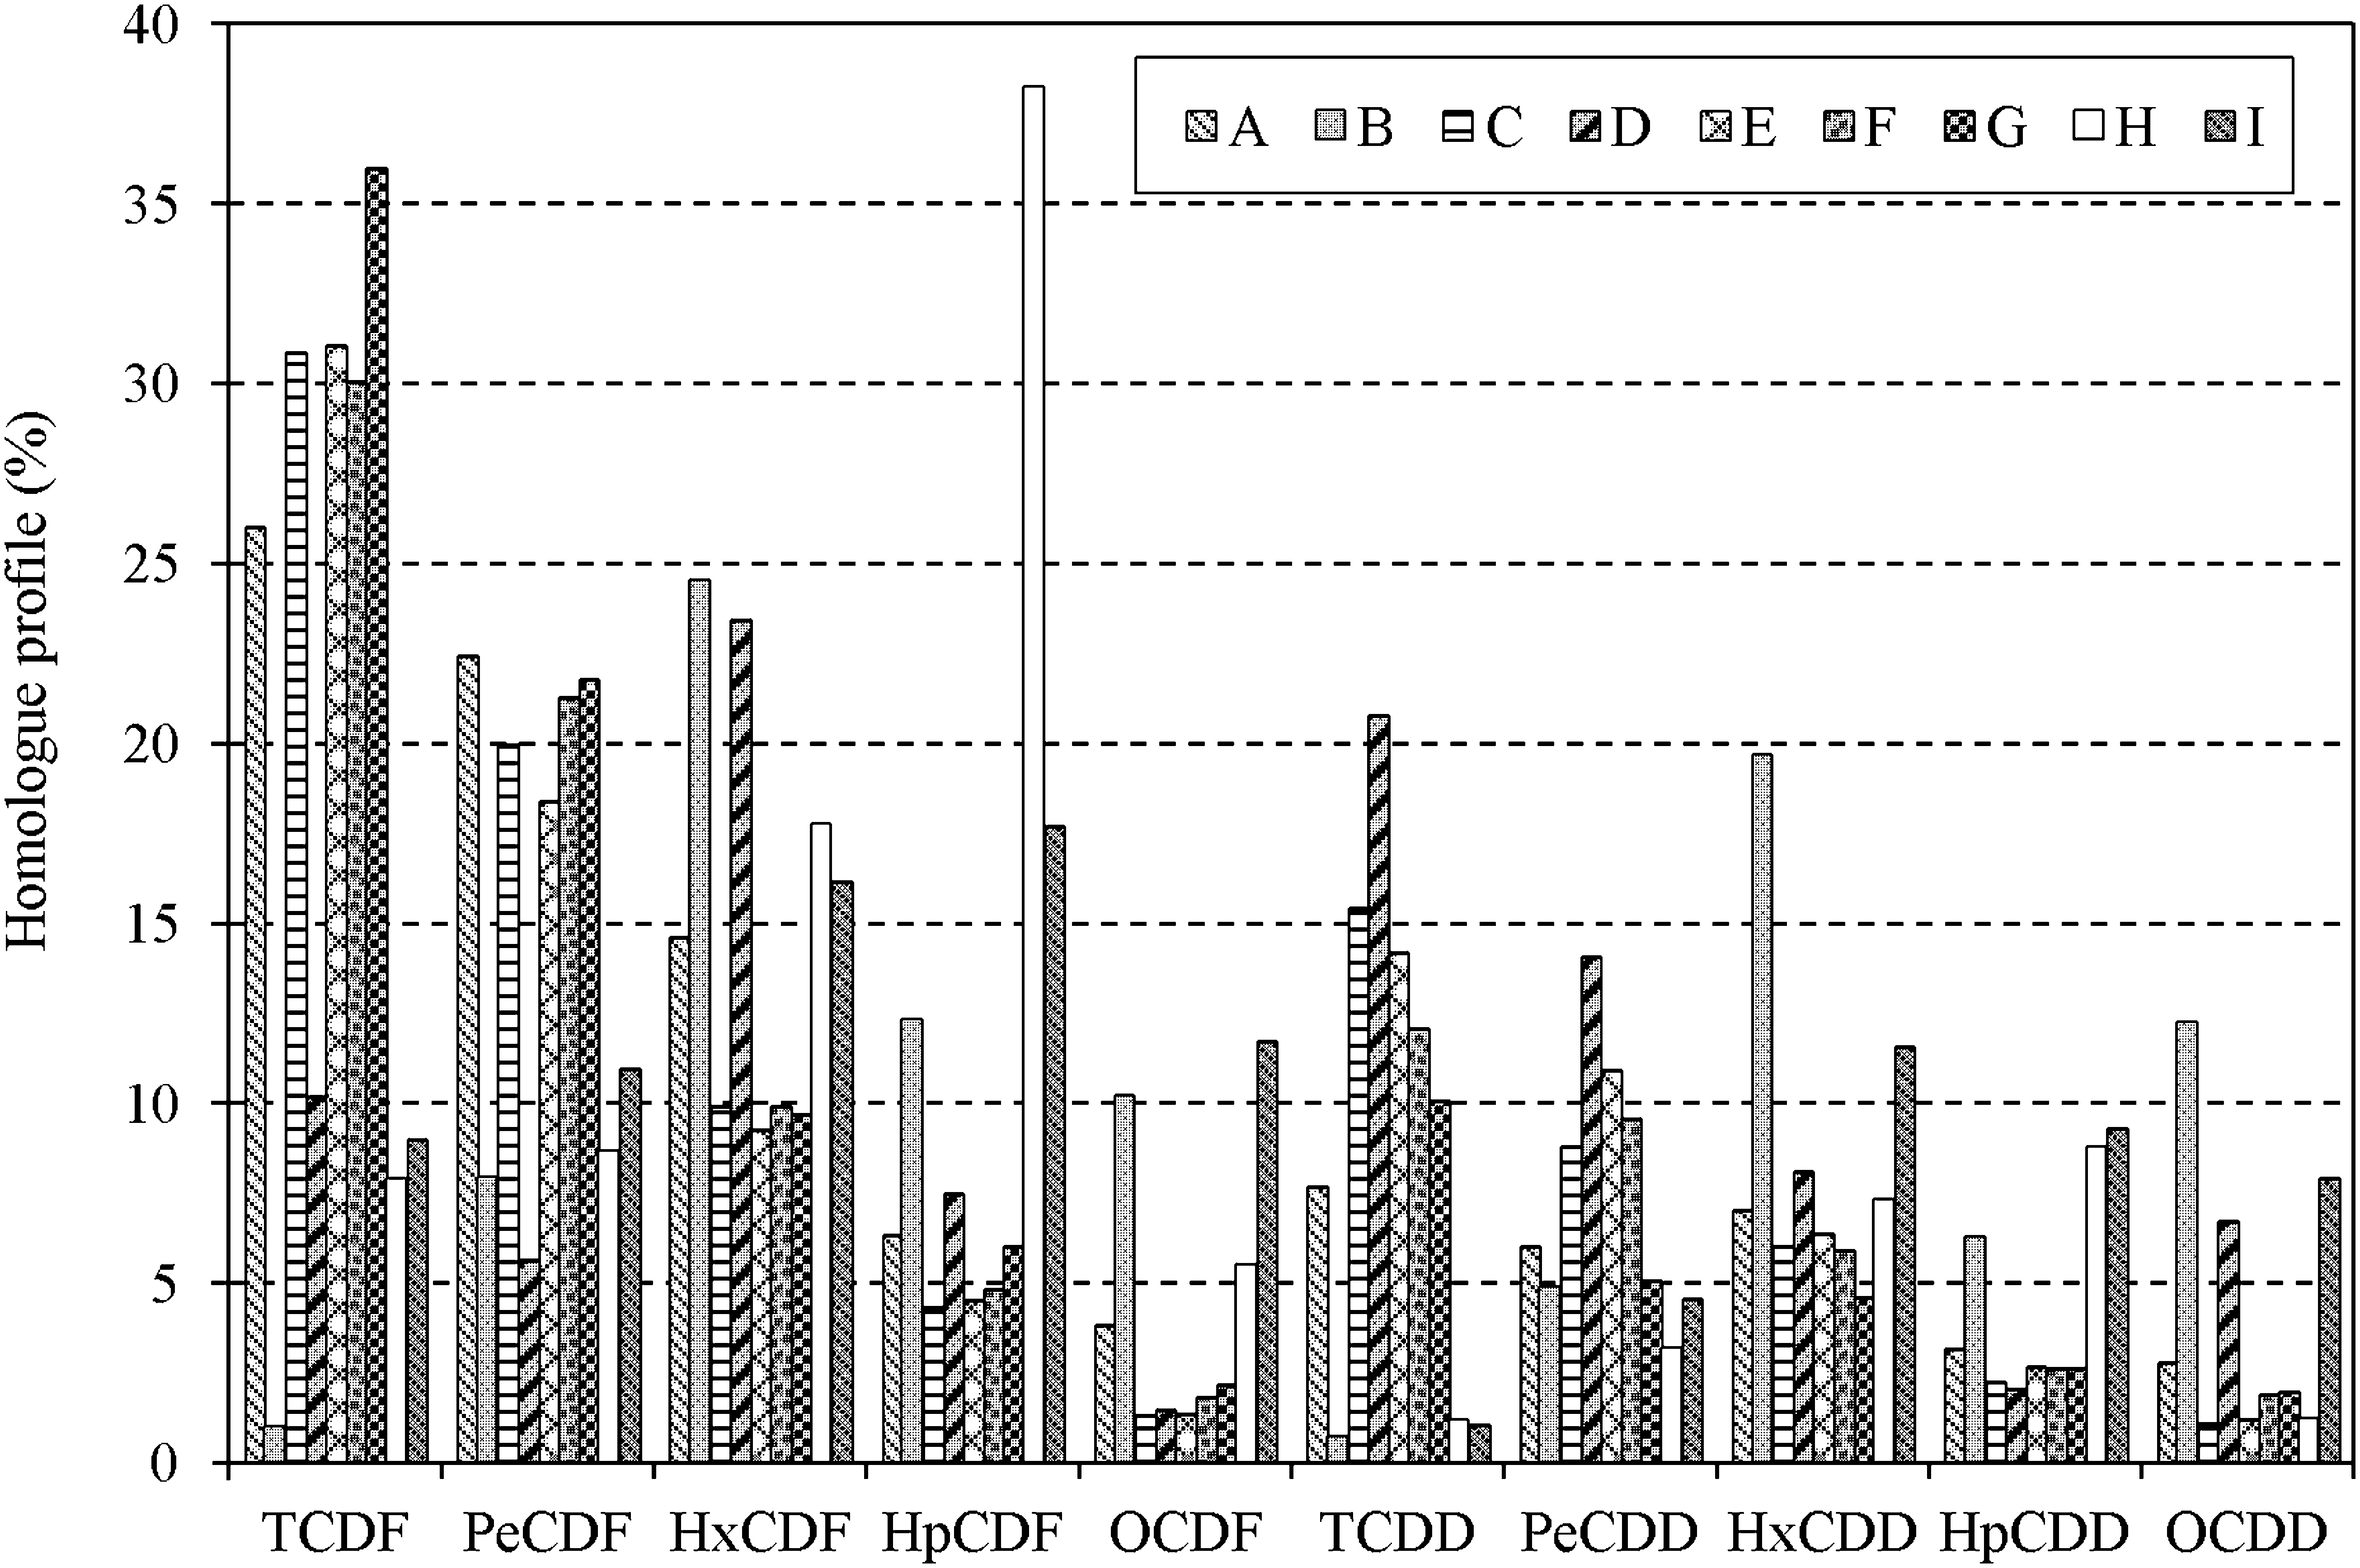
PCDD/F homologue profiles in the air at the various sampling sites.
PCDD/Fs levels in the soil samples
The levels of 2,3,7,8-PCDD/Fs in the ambient soil samples are presented in Table 2.
The average I-TEQ value of PCDD/Fs in the ambient soil samples was 1.33 pg I-TEQ/g. The lowest values was 0.54 pg I-TEQ/g at site I, while the highest was 1.96 pg I-TEQ/g at site A. Low chlorinated congeners were the primary contributors to the total toxic equivalents. The corresponding average percentages of 2,3,4,7,8-PeCDF, 2,3,7,8-TCDD, and 1,2,3,7,8-PeCDD were 29.22%, 12.30%, and 11.21%, respectively.
To gain perspective on the relative levels of PCDD/Fs in soils around the MSWI, the I-TEQ values were compared with those observed in a number of investigations worldwide. These showed large variations. Low concentrations of PCDD/Fs in soil samples, ranging from 0.08 to 1.5 pg I-TEQ/g, were found in Italy (Caserini et al., 2004). Research conducted by Schuhmacher and Domingo in Spain showed similar low PCDD/F concentrations. However, in Barcelona, Spain, PCDD/F concentrations in soils ranged from 1.22 to 34.28 pg I-TEQ/g (Schuhmacher et al., 2000). Data reported in the United States (Lorber et al., 1998, 2000) and Japan (Takei et al., 2000) were at quite high levels, with 4 and 7.1 pg I-TEQ/g as their average values. In Korea, PCDD/Fs in soil samples were between 1.25 and 74.98 pg I-TEQ/g, which are much higher than those reported in other studies (Oh et al., 2006). PCDD/F concentrations in this study were moderate by comparison.
PCDD/F homologue profiles in the soil samples from the various sampling sites are shown in Fig. 4. The average concentration of total PCDD/Fs in the soil samples was 62.45 pg/g. The lowest concentration of total PCDD/Fs was 19.92 pg/g found at site D, with a maximum of 147.26 pg/g at site E. High concentrations of PCDDs were found ranging from 11.99 to 86.89 pg/g with an average of 33.74 pg/g, while PCDF concentrations ranged from 7.93 to 61.23 pg/g with an average of 28.71 pg/g. OCDD, HxCDF, and HpCDD are the major contributors to the total concentration. The D/F ratios in the soil samples were between 1.01 and 2.04, which are different from the air samples, because PCDDs, especially OCDD, are more stable than PCDFs and D/F ratios increased in the soil environment. Similar results were reported by some researches (Caserini et al., 2004; Xu et al., 2009a).
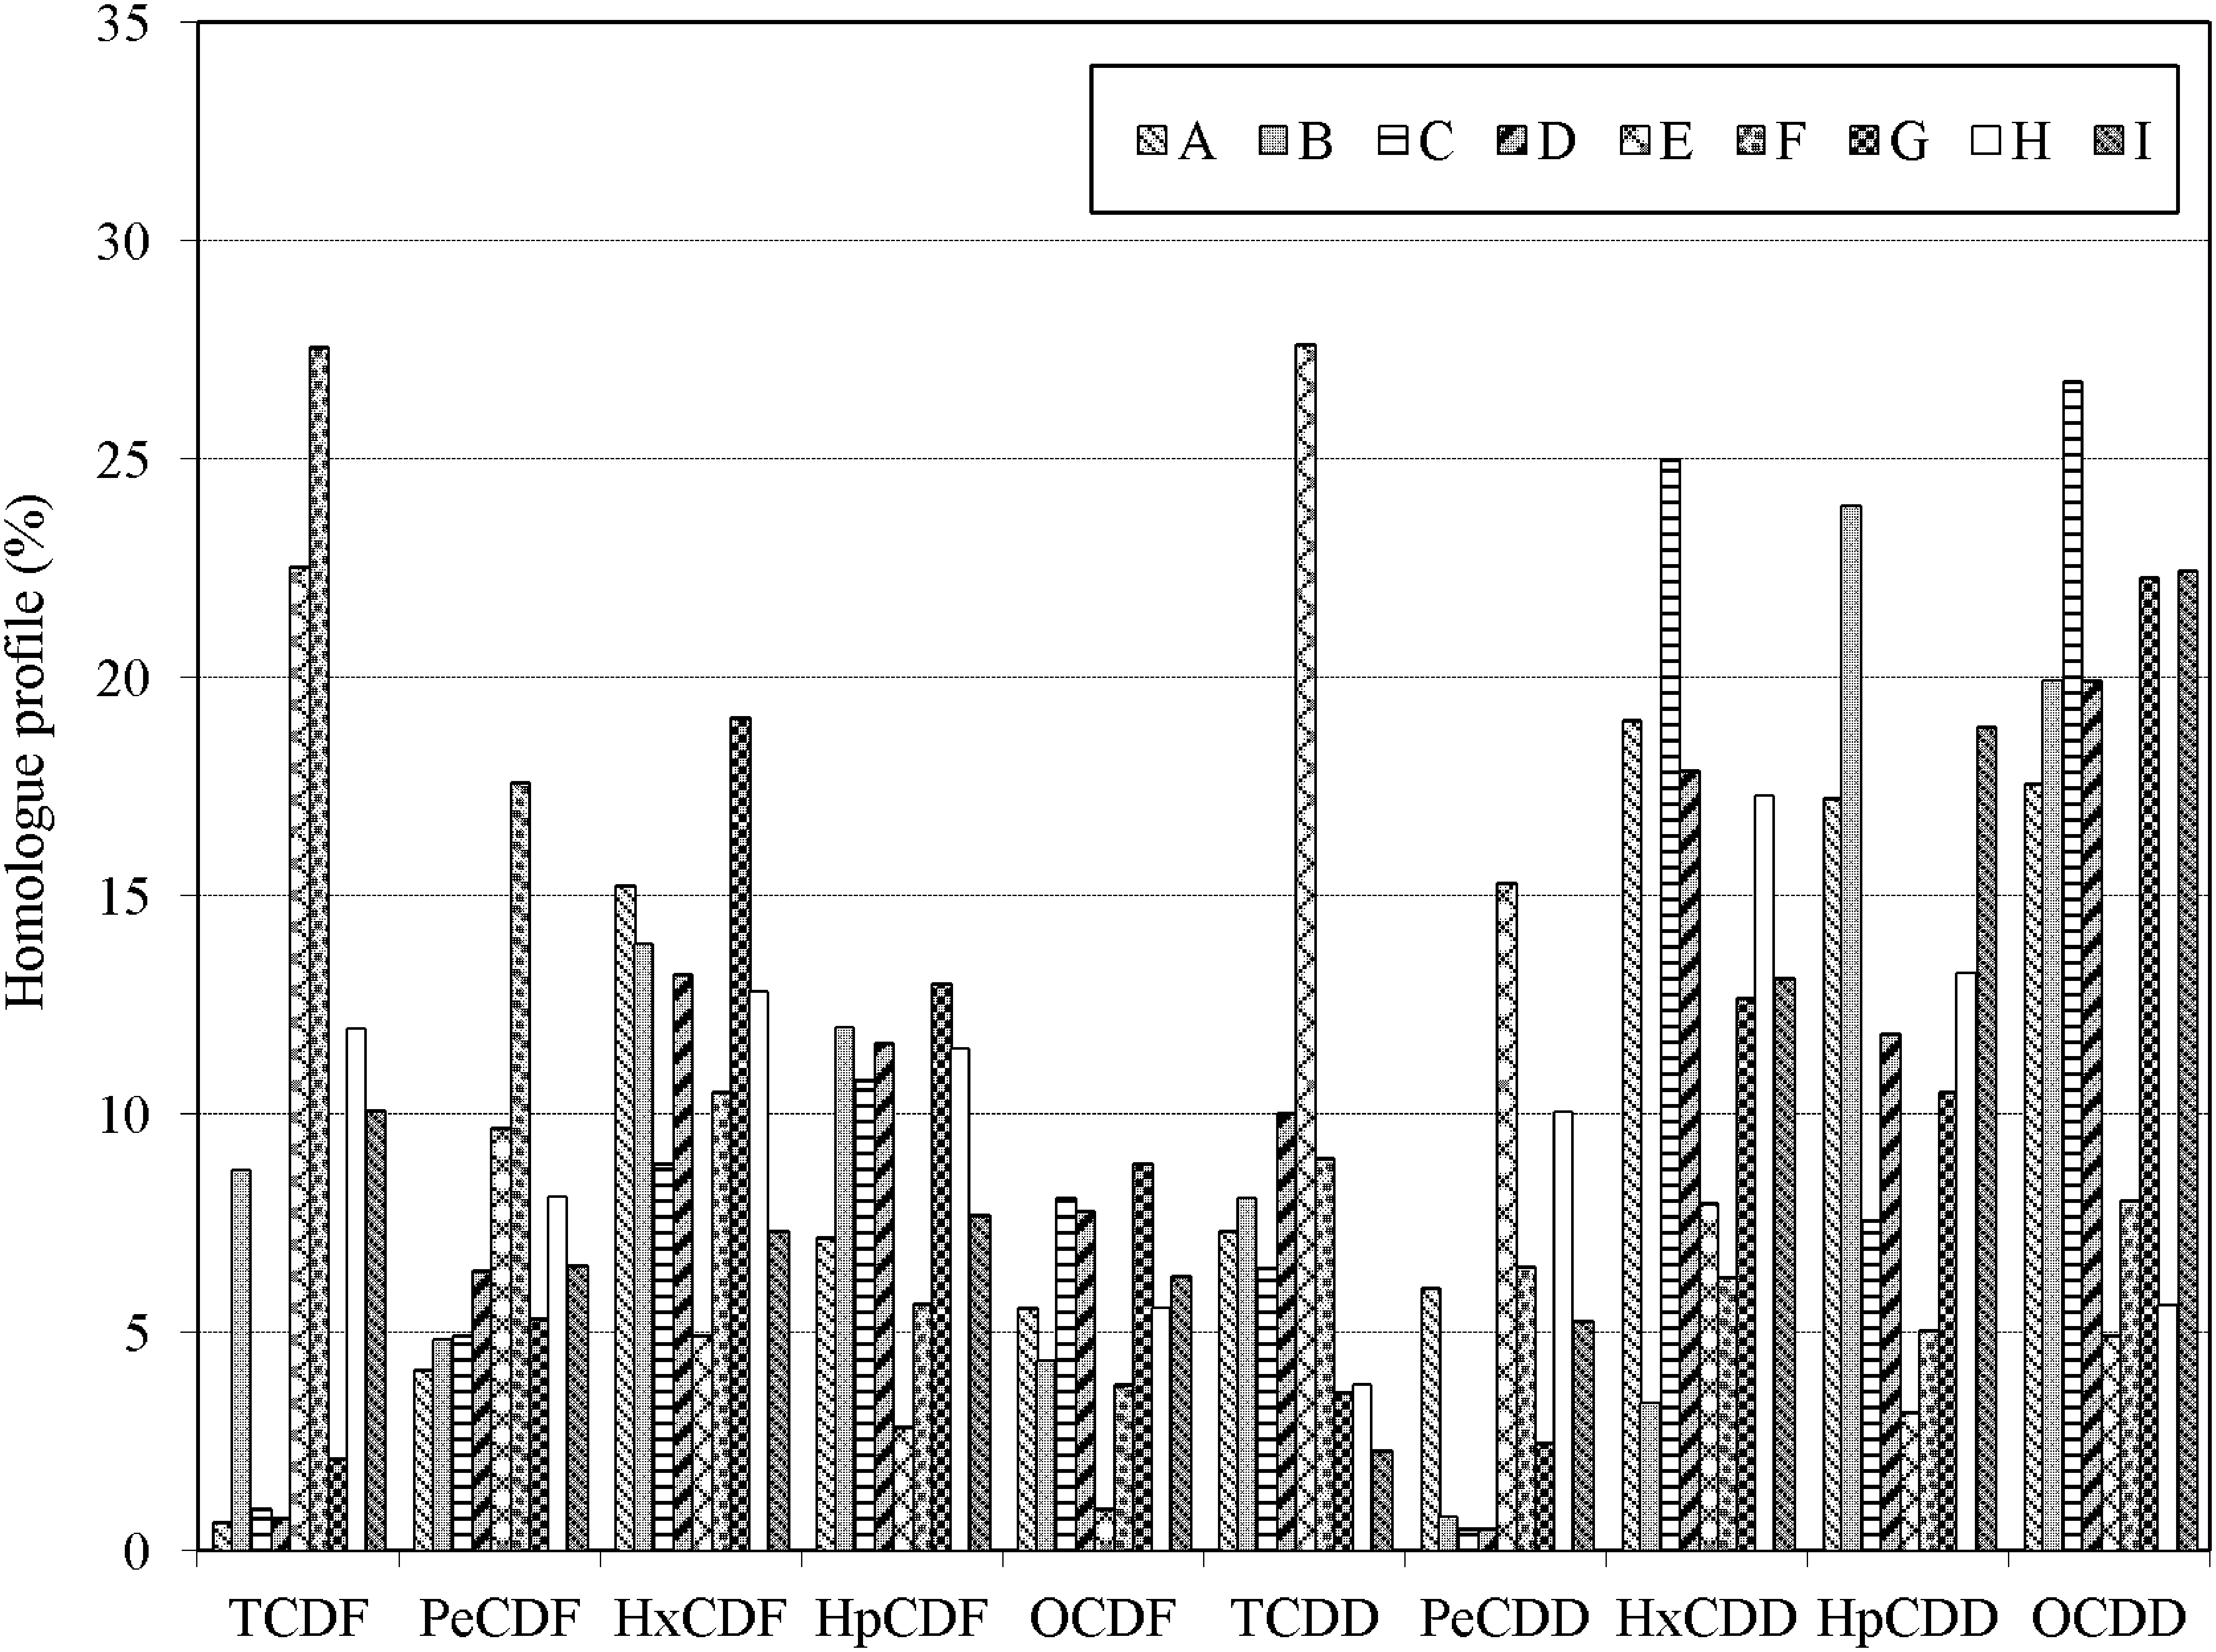
PCDD/F homologue profiles in the soil samples.
PCDD/Fs source identification
To identify the major PCDD/F sources that are responsible for the local environment, multivariate analyses, including principal component analysis (PCA) and hierarchical cluster analysis (HCA), were used in this study, summarizing the systematic information and providing relationships between PCDD/F levels in the various samples and emission sources. Although the CY is a noteworthy source of PCDD/Fs in the area, other potential dioxin emission sources such as traffic also should be taken into account (Anderson and Fisher, 2002; Joung et al., 2009; Xu et al., 2009a, 2009b). A congener-specific factor analysis with 17 congeners was performed using SPSS software, and nine ambient air samples, nine soil samples, and three stack gas samples were selected as the variables. In addition, three gas samples of traffic emissions in Guangzhou, China (Deng et al., 2011) were taken as variables.
The component plot of the factor loading clearly identified two principal components. These first and second principal components explain 75.2% and 15.4% of the total variance, respectively. The dendrogram plot of HCA is presented in Fig. 5. Almost all ambient air samples are clustered into a group except for sites B and D, while all soil samples, air samples in sites B and D, three stack gas samples and three traffic gas samples constitute a main cluster. All the soil samples are clustered into a group in a very small rescaled distance and have a closer relationship with those emission sources than the air samples. In ambient air samples, the quantity and variety of PCDD/Fs were more variable along with atmospheric transportation, such as dispersion and diffusion, while in the soil samples, PCDD/Fs exhibit a relatively stable pattern determined by emission sources. Further, in terms of the relationship between the samples and the presumed emission sources, the incineration has a potential influence on the environmental level of PCDD/Fs and traffic emissions may also play an important role in the environmental contamination.

Hierarchical tree plot of samples of air, soil, stack gas, and traffic. (The first letter represents the categories: A, air; S, soil. The second letter represents the sampling sites. CY1–3, three stack gas samples of CY; TR1–3, three traffic gas samples).
Footnotes
Acknowledgments
This study was supported by the National 973 Program (2011CB201500) and the National Natural Science Foundation of China (20977099, 21077121).
Author Disclosure Statement
The authors declare that no financial conflicts exist.