
Abstract
Abstract
We compared two different approaches available in the literature for first-order sorption kinetics, which constitutes the slow time-dependent part of the two-site sorption model commonly used for solute transport. One approach assumes that sorbed concentrations in the Type-1 site (S1) and the Type-2 site (S2) are directly associated with a solute concentration (C) in liquid phase by forming two-site sorption with a parallel interface; the other assumes that S2 is associated with only S1 at the Type-1 site, resulting in two-site sorption with a serial interface. Application of different kinetics to a batch system where solute mass is conserved resulted in an identical type of liquid and sorbed concentration versus time equation in the form of exponential decay. However, because of the different structure and components used to define the kinetic part (S2), some parameters estimated from observed kinetic sorption data deviated significantly from one another. For instance, the fraction (f) of the Type-1 site varied as much as twofold, which led to different transport behavior. This indicates that choice of the kinetic part in the two-site sorption model becomes important when attempting appropriate transport modeling on reactive solutes.
Introduction
where S1 and S2 are sorbed concentrations at Type-1 and Type-2 sites, respectively. Introducing the distribution coefficient K (L/kg), and assuming that sorption reaches equilibrium instantaneously between sorbate and sorbent, the following equations can be obtained:
In the literature, two different approaches are available for the construction of S1, S2 depending on the way of contact with liquid concentration C. The first is a two-site sorption model with a serial interface (TSSI) (Fig. 1) and the other is a two-site sorption model with a parallel interface (TSPI) for Type-1 and Type-2 sites (Fig. 2). Each model was successfully applied to obtain sorption-related parameters of organic chemicals such as pesticides and toluene showing the dual nature of sorption behaviors in a kinetic batch system, respectively. The objective of this study was to investigate how the two different kinetics differ from each other by comparing sorption parameters of both models estimated from experimental data obtained from the kinetic sorption test and by simulating the breakthrough curves (BTCs) of a reactive chemical using a solute transport equation coupled with sorption kinetics.
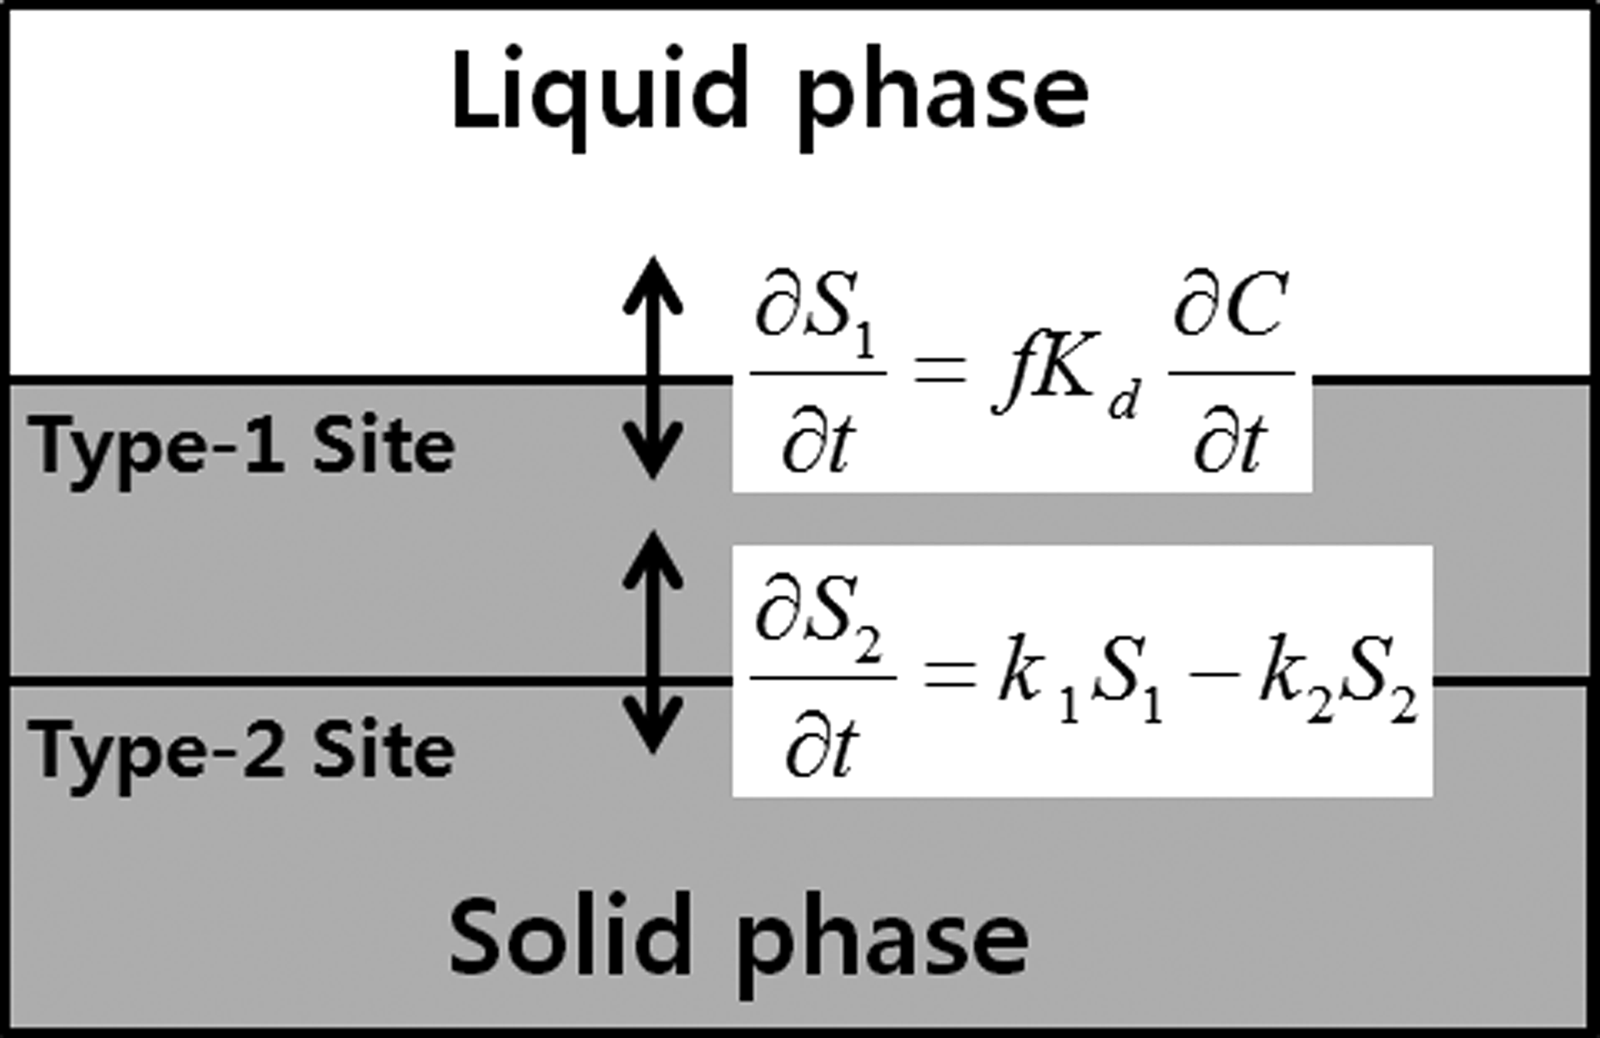
Illustration of the two-site serial interface (TSSI) model used by Nkedi-Kizza et al. (2006).

Illustration of the two-site parallel interface (TSPI) model used by Lee et al. (2009).
Comparison of C–t Relationship
TSSI Model
In the study of organic pesticide sorption (Nkedi-Kizza et al., 2006), TSSI was used to characterize kinetic sorption parameters. The TSSI model is based on the following sorption kinetics between the Type-1 and Type-2 sites (Cameron and Klute, 1977; Brusseau, 1992):
where k1 and k2 are forward and backward sorption rate coefficients, respectively. In this sorption kinetics, the solute in the liquid phase instantly partitions to the Type-1 site such that
where sorption of the solute in liquid phase onto the Type-1 site is completed at t=+0. Then, the time-dependent sorption (S2) onto the Type-2 site follows the kinetics given by Equation (5) until it satisfies
where C∞ is the solute concentration in a batch system at t=∞. Assuming that the relationship given by Equations (3) and (4) is valid at t=∞, then
In a batch system where the total solute mass added (A) is constant and distributed among the liquid and sorbed phases only, the following relationship can be obtained by applying the mass conservation law:
where V, C0 and C are volume and concentrations of solution at t=0 and t=t, respectively, and M is mass of sorbent. Introducing the relationship given by Equations (3) and (10), S2 is related to C by
In the study of Nkedi-Kizza et al. (2006), the time-dependent sorption at Type-2 (S2) was assumed to obey the first-order kinetics between S1 and S2 given by Equation (5). When time goes to infinity, the following relationship can be obtained by introducing Equations (8) and (9) into Equation (5):
Based on the relationships given by Equations (5), (11), and (12), the following equation can be derived:
Using Equations (10) and (12) at t=∞ the following relationship is obtained:
Substituting Equation (14) into Equation (13) leads to the following expression:
where β=(V+MfK)/(V+MK).
Introducing the relationships of C∞/C0=1/R and C*=C/C0, the following equation is obtained:
where R=1+MK/V, with R as the retardation factor.
TSPI Model
In another study of toluene sorption (Lee et al., 2009), a TSPI for Type-1 and Type-2 sites that was given by van Genuchten and Wagenet (1989) was used to determine both equilibrium and nonequilibrium sorption parameters.
where C, S1, and S2 are liquid and sorbed concentrations (mg/kg) at Type-1 and Type-2 sites, f is the fraction of the Type-1 site, and α and K are the sorption rate constant (h−1) and distribution coefficient (L/kg), respectively. In this sorption kinetics, the sorbed concentration (S1) in the Type-1 site reaches equilibrium instantaneously so that it satisfies Equation (6), and the slow nonequilibrium sorption follows the kinetics given by Equation (17) until it satisfies Equation (4).
The kinetic model [Eq. (17)] was applied to a batch system where for a given initial solute concentration (C0) and volume (V), the total solute mass (A=VC0) distributed in the liquid and sorbed phase remains constant. Dividing Equations (1) and (10) by VC0, the following dimensionless forms are obtained:
where C*=C/C0, S*=MS/VC0, S1*=MS1/VC0, and S2*=MS2/VC0.
The relationship between
Using Equations (18–20),
where R=1+MK/V, β=(V+MfK)/(V+MK), fMK/V=Rβ−1, and f=(βR−1)/(R−1).
Time-dependent sorption kinetics [Eq. (17)] in the Type-2 site can be given by
From Equations (21) and (22), we obtain the following relationship:
It is noted that the relationships [Eqs. (16) and (23)] between the liquid concentration (C*) versus time (t) of the two studies result in an identical pattern, except for the difference between α in Equation (23) and k2 in Equation (16), although each study employed different sorption kinetics in the Type-2 site (Figs. 1 and 2).
Comparison of Analytical Solutions
Solution of TSSI model
In the study of Nkedi-Kizza et al. (2006), the analytical solution of Equation (16) can be derived as follows:
where the liquid concentration (C+0) at t=+0 is obtained from Equation (11) by assuming that
Using Equations (11), (25), and (26), the following relationship is obtained:
By introducing Equation (27) into Equation (24), the following analytical solution is obtained:
Graphical solution of Equation (28) is depicted in Fig. 3, where the relative concentration changes from 1.0 at t=+0 to C+0*=1/βR at t=+0 by instantaneous sorption at the Type-1 site and then to C∞*=1/R at t=∞ by slow sorption at the Type-2 site. Change of sorbed concentration (S2) at the Type-2 site can be obtained from Equations (10), (25), (27), and (28), and given as follows:
Graphical solutions of Equations (28) and (29) are shown in Fig. 3, where
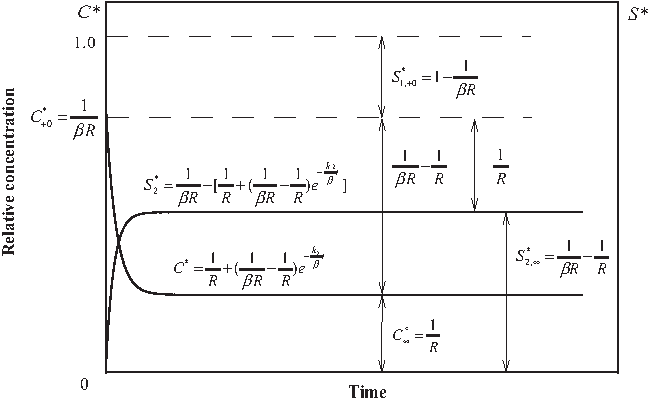
Graphical presentation of liquid concentration (C) and sorbed concentrations (S) in two-sites for the TSSI model at t=+0 and t=∞.
Solution of TSPI Model
In the study of Lee et al. (2009), the analytical solution of Equation (23) is derived as follows:
where the relative liquid concentration (
by assuming that the sorbed concentration (
By substituting Equation (32) into Equation (30), we obtain the following analytical solution:
Change of sorbed concentration (S2) at the Type-2 site can be obtained from Equations (18), (19), and (31–33) as follows:
Graphical solutions of Equations (33–34) are depicted in Fig. 4. Details of important variables and parameters on liquid and sorbed concentrations at the completion of fast and slow sorption processes are summarized in Table 1.

Graphical presentation of liquid concentration (C) and sorbed concentrations (S) in two-sites for the TSPI model at t=+0 and t=∞.
TSPI, two-site sorption model with parallel interface; TSSI, two-site sorption model with serial interface.
Estimation of Model Parameters and Transport Modeling
To estimate parameters of two kinetic models, we fitted both analytical solutions of Equations (28) and (33) to the kinetic sorption data obtained by Lee et al. (2009) showing the typical two-site sorption consisting of a fast process at early time and a slow one at later times (Fig. 5). We used the following equation of exponential decay type to fit these data, since the two equations have an identical type:
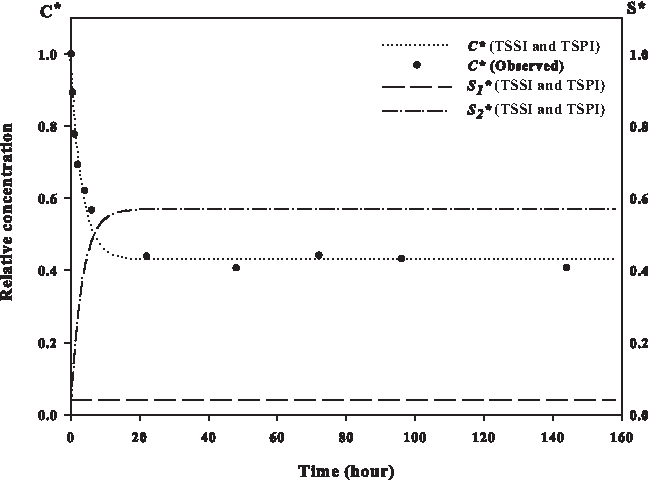
Fit of two-site sorption models to the observed data of aqueous toluene concentrations during equilibrium and kinetic sorption. Data from two models exactly coincide with each other for
Application of Equation (35) to the data at t=0 and t=∞ results in the following relationships:
The best fit of Equation (35) to the data using the nonlinear least-squares method resulted in y0+a=0.9609 and y0=0.4302. Parameters of two kinetic models could be obtained by substituting these values into Equations (36–38). Based on the model parameters, BTCs of a reactive chemical were simulated using the following one-dimensional ADE coupled with each sorption kinetics:
Comparison of Model Parameters and BTCS
Results of estimated parameters are shown in Table 2. It is noted that K (distribution coefficient), R (retardation factor), and values of
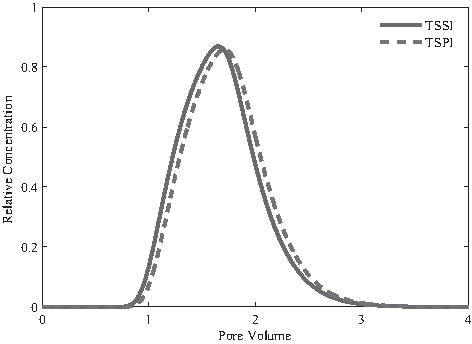
Comparison of breakthrough curves simulated from sorption parameters obtained from TPSI and TSSI. Note that advection (V=0.518 cm/min) and dispersion (D=0.082 cm2/min) coefficients were assumed.
Conclusion
In this study, we compared two different two-site sorption models, which rely on different first-order sorption kinetics; one [TSSI model by Nkedi-Kizza et al. (2006)] is based on slow sorption between the sorbed concentration (S1) at the Type-1 site and the sorbed concentration (S2) at the Type-2 site, and the other [TSPI model by Lee et al. (2009)] based on slow sorption between the liquid concentration (C) and the sorbed concentration (S2) at the Type-2 site. Application of these two models to a batch system resulted in an identical type of C–t relationship. Model parameters such as distribution coefficient and retardation factor estimated by fitting the analytical solutions of the C–t relationship to the kinetic sorption data well coincided. However, due to differences in the definition of liquid concentration (
Footnotes
Acknowledgment
Authors acknowledge that this study was supported by KOSEF (Grant 2009-0060679).
Disclosure Statement
The authors declare that no competing financial interests exist.