
Abstract
Abstract
This study was conducted to use soil and topographic attributes to predict the activity of three soil enzymes: L-asparaginase, L-glutaminase, and urease by artificial neural networks (ANNs) and multiple linear regression (MLR) approaches in a hilly region of central Iran. A total of surface (0–10 cm depth) soil samples were collected from the site under pasture. Sampling points were chosen in a stratified random manner from geomorphic surfaces, including summit, shoulder, backslope, footslope, and toeslope at the site. MLR and feed-forward back-propagation of ANNs were employed to develop models to predict soil enzymes activity (SEA). Results of the study showed that MLR models explained 37%–61%, and ANN models explained 96%–98% of the variability in the three SEA at the site studied. Overall, the results indicated that the ANN performed better in predicting the SEA than did MLR. Sensitivity analysis showed that topographic parameters as the easily accessible auxiliary variables were the most important factors for predicting the SEA prediction. It was concluded that digital terrain models (DTMs) can be applied to predict spatial distribution of the SEA at the hillslope scale.
Introduction
Soil enzymes are central to soil microbial activity and nitrogen (N) transformation (Tabatabai and Acosta-Martinez, 2000). L-glutaminase and urease are among amidohydrolases in the soil that play an important role in soil organic N mineralization and the supply of N to plants. L-glutaminase catalyzes the hydrolysis of L-glutamine, producing L-glutamic acid and NH3. Urease catalyzes the hydrolysis of urea to CO2 and NH3, and L-asparaginase catalyzes the hydrolysis of L-asparagine, leading to the production of L-aspartic acid and NH3 (Tabatabai and Acosta-Martinez, 2000).
Topography as one of the major soil forming factors controls various soil properties and, thus, may indirectly affect SEA. So, quantitative information on the topographic attributes has been applied in the form of digital terrain models (DTMs). Florinsky et al. (2002) reported that soil properties in the top soil layer were affected by topographic attributes. Florinsky et al. (2004) studied the effects of topography on the activity of denitrifiers, and indicated that microbial biomass, denitrifiers population, and microbial respiration were influenced by both the local geometry of the slope and the relative position of a point in the landscape.
Due to the existence of high spatial variability in soil biological properties within the landscape (Cavigelli et al., 2005), the use of indirect prediction approaches, such as the alternative methods, have been widely used. For example, DTMs could predict soil properties at a point in the landscape in a cost-, time-, and labor-effective way. So, it is suggested that DTMs can be used to analyze, model, and predict the spatial distribution of soil properties.
Correlation and multiple linear regression (MLR) analysis have been commonly used for this purpose (Nourbakhsh et al., 2002), but often the results are not satisfactory. Nonlinear and intelligent approaches have attracted little attention for the characterization of soil biological properties. Artificial neural network (ANN) as an intelligent technique is a mathematical tool, which has been inspired by biological neural networks, and is a popular tool in the classification, prediction, and recognition-based problems. It has a flexible structure, and is capable of making a nonlinear mapping between input and output spaces (Gorzalczany, 2002).
The objectives of this study were (1) to predict the activity of L-asparaginase, L-glutaminase, and urease using topographic data, (2) to evaluate the performance of MLR and ANN modeling approaches for assessing SEA, and (3) to determine soil and topographic attributes that control most variability in the SEA using sensitivity analysis in the hilly region of southern Isfahan province located in central Iran.
Materials and Methods
Description of the study area
This study was conducted in a hilly region with an area of 2400 ha under natural pasture land use, located in the Semiroum region, Isfahan province, Central Iran (Fig. 1). The study area is located at 31°18′N latitude and 51°39′E longitude. The mean elevation of the area is approximately 2,500 m. The mean annual temperature and precipitation at the site are 10.6°C and 350 mm, respectively. The hill slopes of the study area have been developed by an extensive dissection of sedimentary Quaternary deposits. Generally, the soil texture is loam and clay loam in the 0–10 cm soil layer, and the soils are classified as Typic Calcixerepts according to Soil Taxonomy (Soil Survey Staff, 2006).
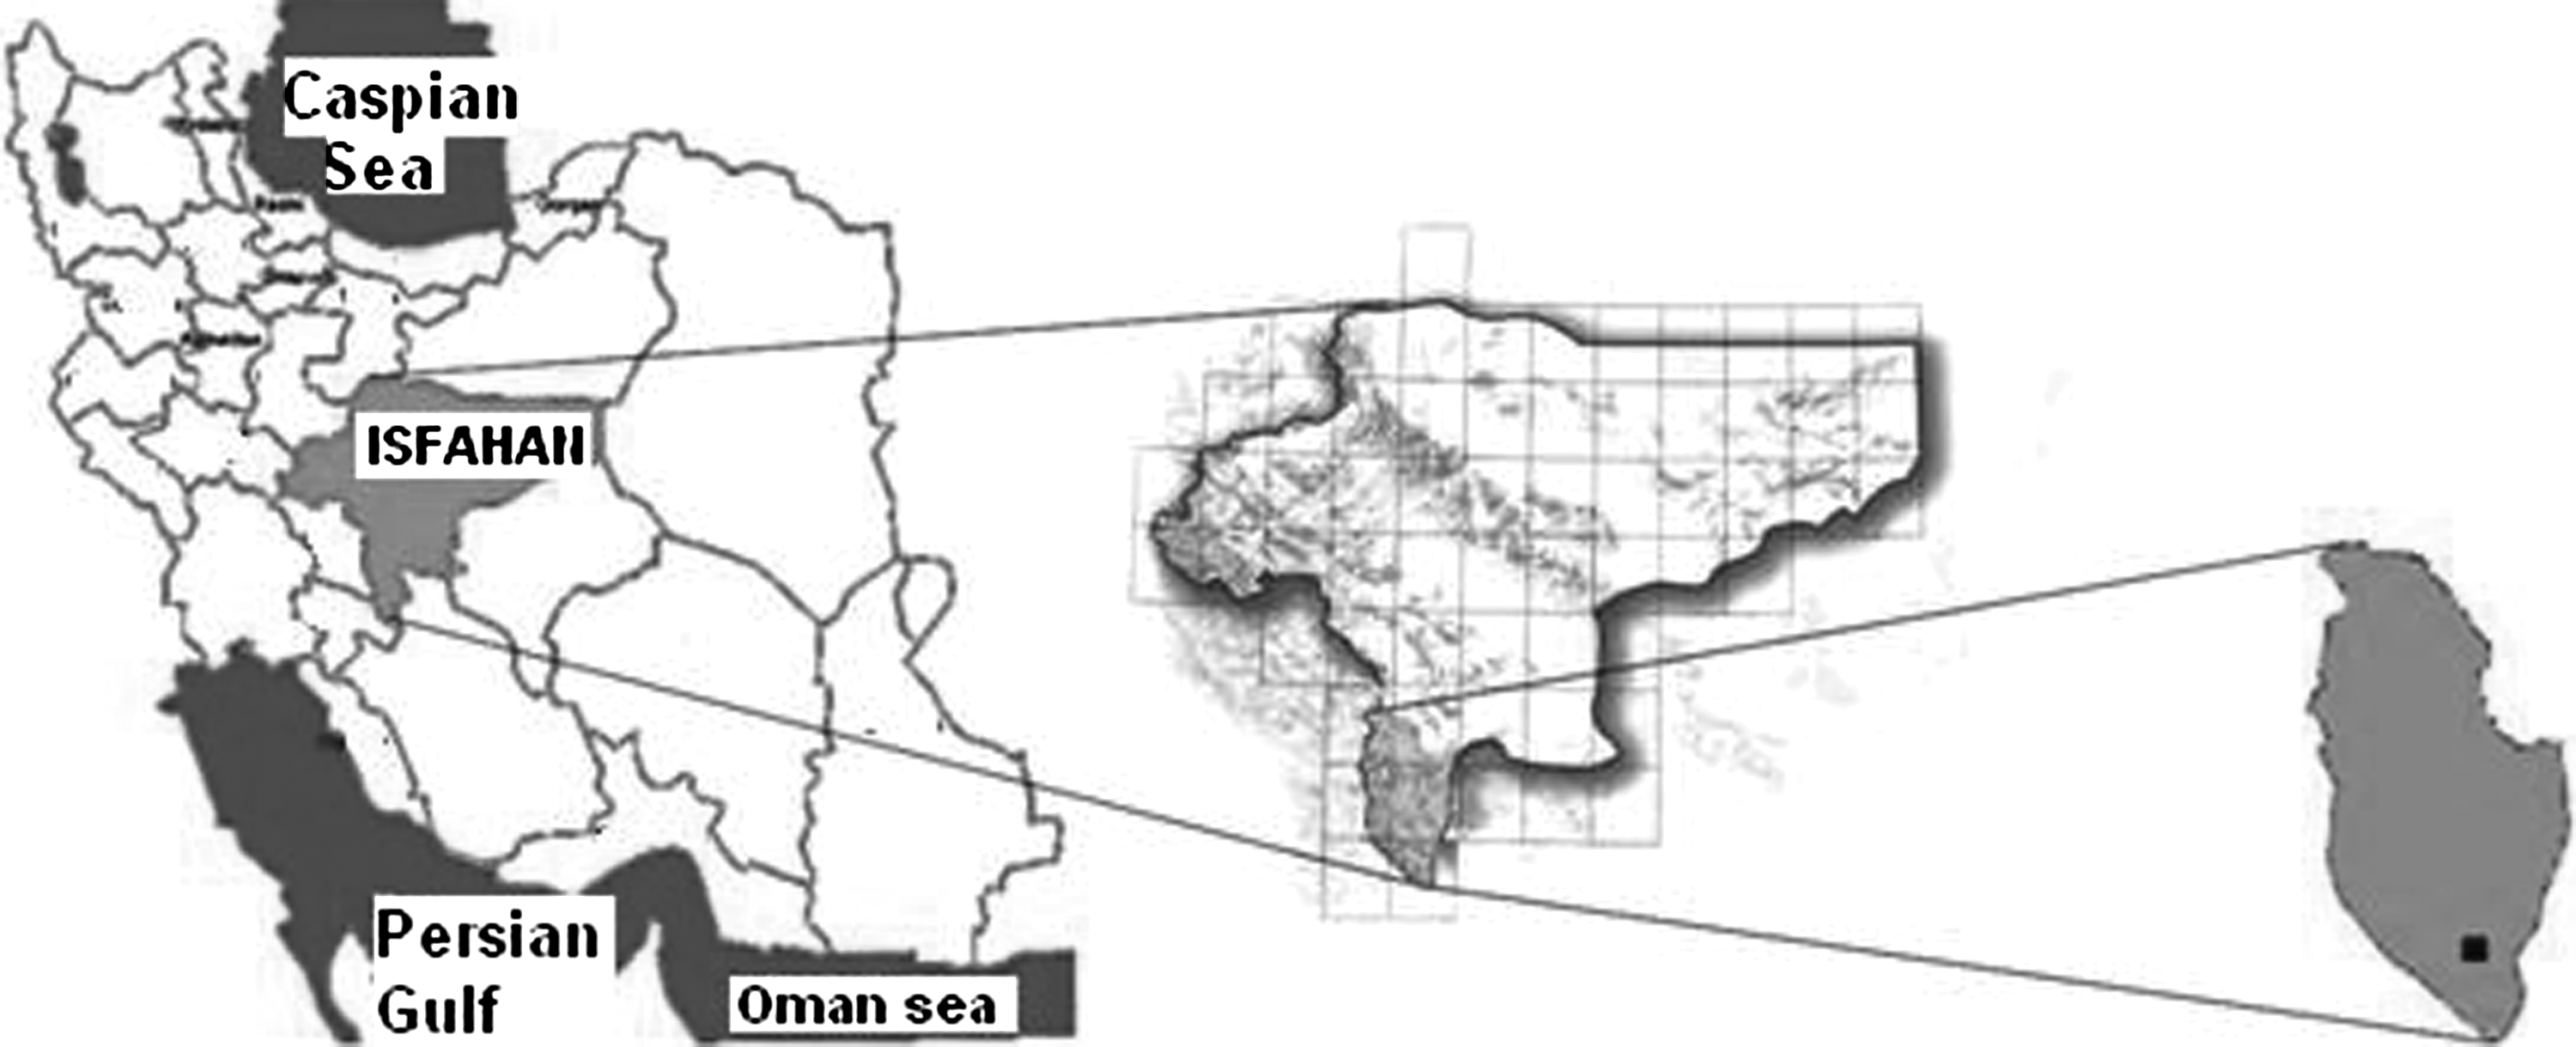
Location of the study area in Semiroum district, south of Isfahan province, central Iran.
Soil sampling and laboratory analysis
Sampling units were defined on the basis of landscape position in the hillslopes. A total of 125 surface (0–10 cm) soil samples were collected on a stratified random sampling grid. The study region was stratified into regular-sized grid cells of 350 ×350 m, and all landform positions (summit, shoulder, back slope, foot slope, and toe slope) were equally included (Fig. 2). At each point, five sub-samples were collected and made into one composite sample, to reduce micro-variability.
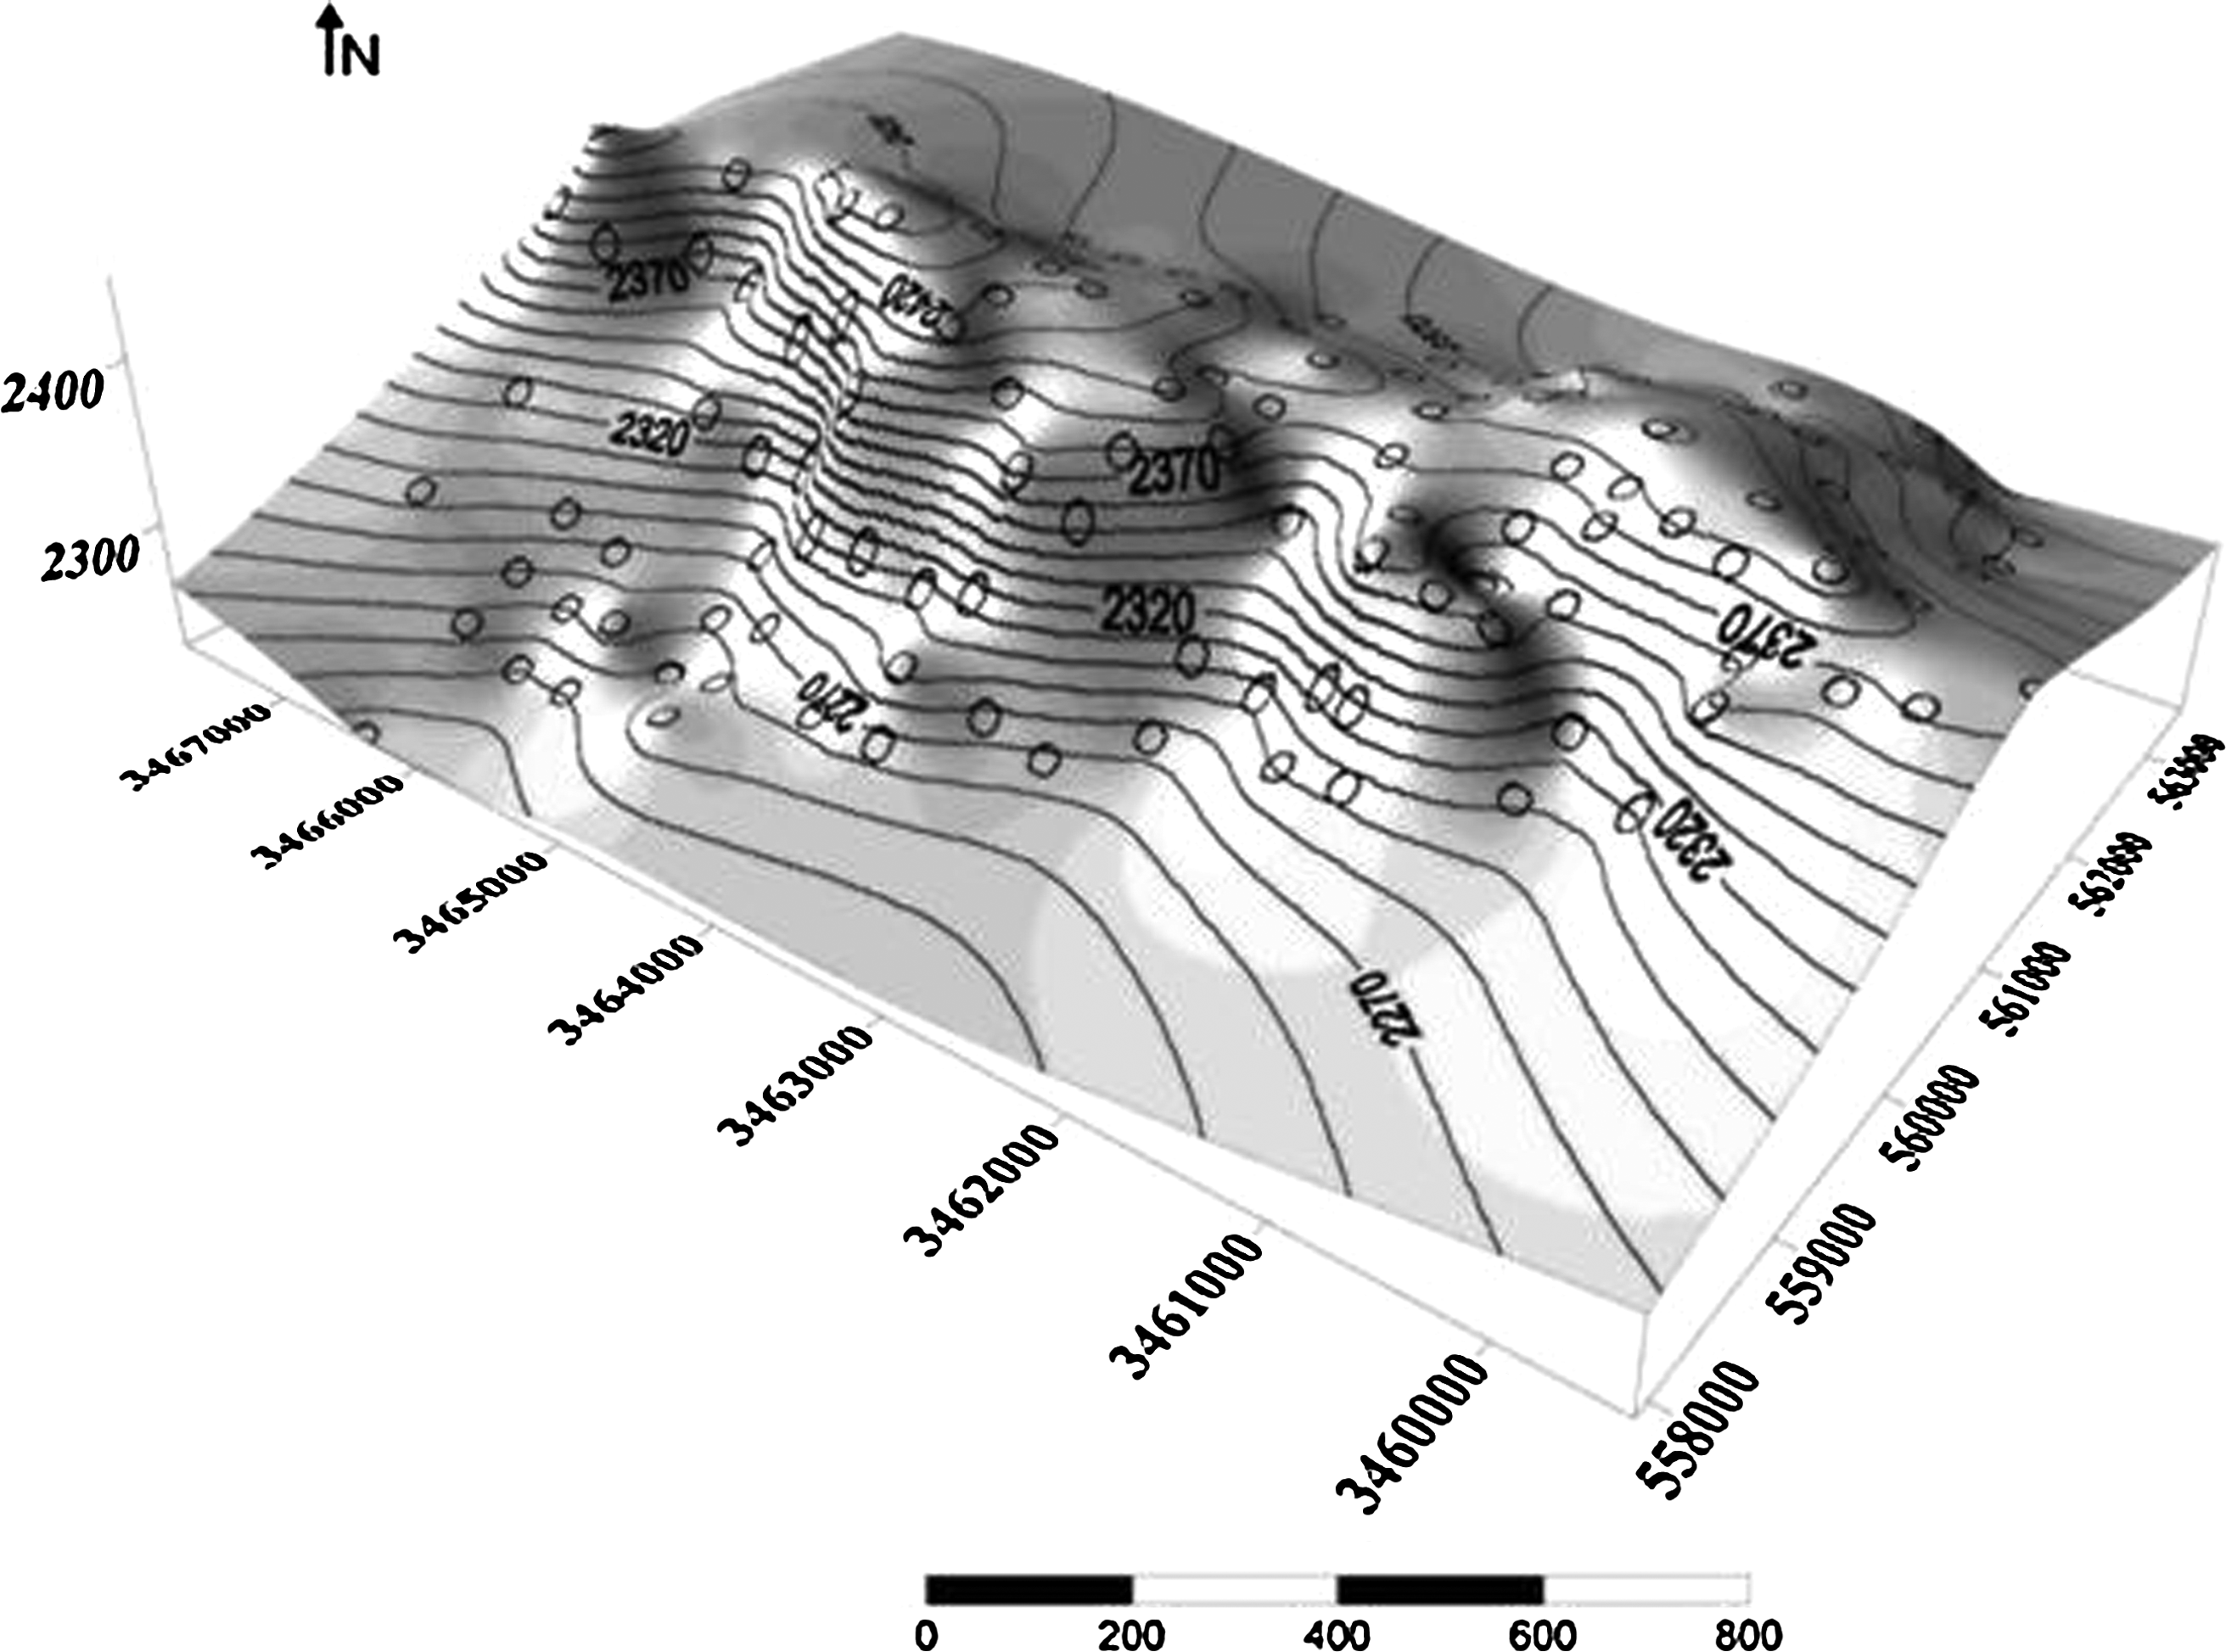
Distribution pattern of the sampling points within the selected landscape in Semiroum district, south of Isfahan province, central Iran.
Before analyses, the soil was air dried, ground to pass through a 2-mm sieve to remove stones, roots, and large organic residues for laboratory measurements. Soil particle size distribution (sand, silt, and clay) was determined using a pipette method (Day, 1965). Soil pH was determined in saturated paste extract by a pH-meter, and electrical conductivity (EC) was measured in the same extract by EC meter. Calcium carbonate equivalent (CCE) was measured by back titration procedure (Hesse, 1971); soil organic carbon (SOC) was determined by the Walkley-Black procedure (Nelson and Sommers, 1982), and total nitrogen (TN) was determined by the Kjeldahl method described by Bremner and Mulvaney (1982). Total soluble nitrogen and soluble organic nitrogen (SON) were measured by the procedure described by Cabrera and Beare (1993). The activities of the soil enzymes were assayed following the procedures described by Tabatabai (1994).
Digital terrain modeling
The data collected were used to create 3 m×3 m digital elevation models (DEMs) using ILWIS (ITC, 1997), topographical indices were then generated from the DEM using ILWIS software and DIGEM software (www.geogr.uni-goettingen.de/pg/saga/digem). Wilson and Gallant (2000) divided terrain attributes in two categories of primary and secondary (compound) attributes; primary attributes are calculated directly from DEMs and included elevation, slope, aspect, mean curvature, and specific catchment area. Secondary or compound attributes involve combinations of the primary attributes and are indices that describe the spatial variability of specific processes occurring on the landscape such as soil water content or potential for sheet erosion, stream power index, wetness index (WI), and sediment transport index (STI).The definition of the selected topographic attributes are summarized in Table 1. The maps of aspect and WI are shown in Fig. 3.

Spatial distribution of
WI, wetness index; SPI, stream power index; PROFC, profile curvature; PLANC, plan curvature; MEANC, mean curvature; SCA, specific catchment area; TangC, tangential curvature; CA, cathment area; DEM, digital elevation model.
Statistical analysis
Descriptive statistical analysis
Descriptive statistics such as mean, minimum, and maximum standard deviation (SD) for all selected variables and topographic attributes were determined by SPSS v16 (Wendroth et al., 1997). Coefficient of variation (CV) was calculated to estimate and explain the variability of the selected soil and topographic variables. The normality of the distribution of selected variables was evaluated by the Kolmogrov–Smirnov test.
MLR analysis
In this study, MLR, a popular technique employed in many disciplines to predict a particular variable of interest using independent variables (Mishra et al., 2010), was used for the regression analysis. The global regression model used in the data set was
where Y is a dependent variable, β0 is a constant representing the Y value when all the independent variables are 0, X is an independent variable, and
Neural network development
Multi-layer perceptron (MLP) with back propagation learning rule, as the most common network in engineering problems regarding nonlinear mapping, and called “universal approximator” (Haykin, 1994), was used (Fig. 4).
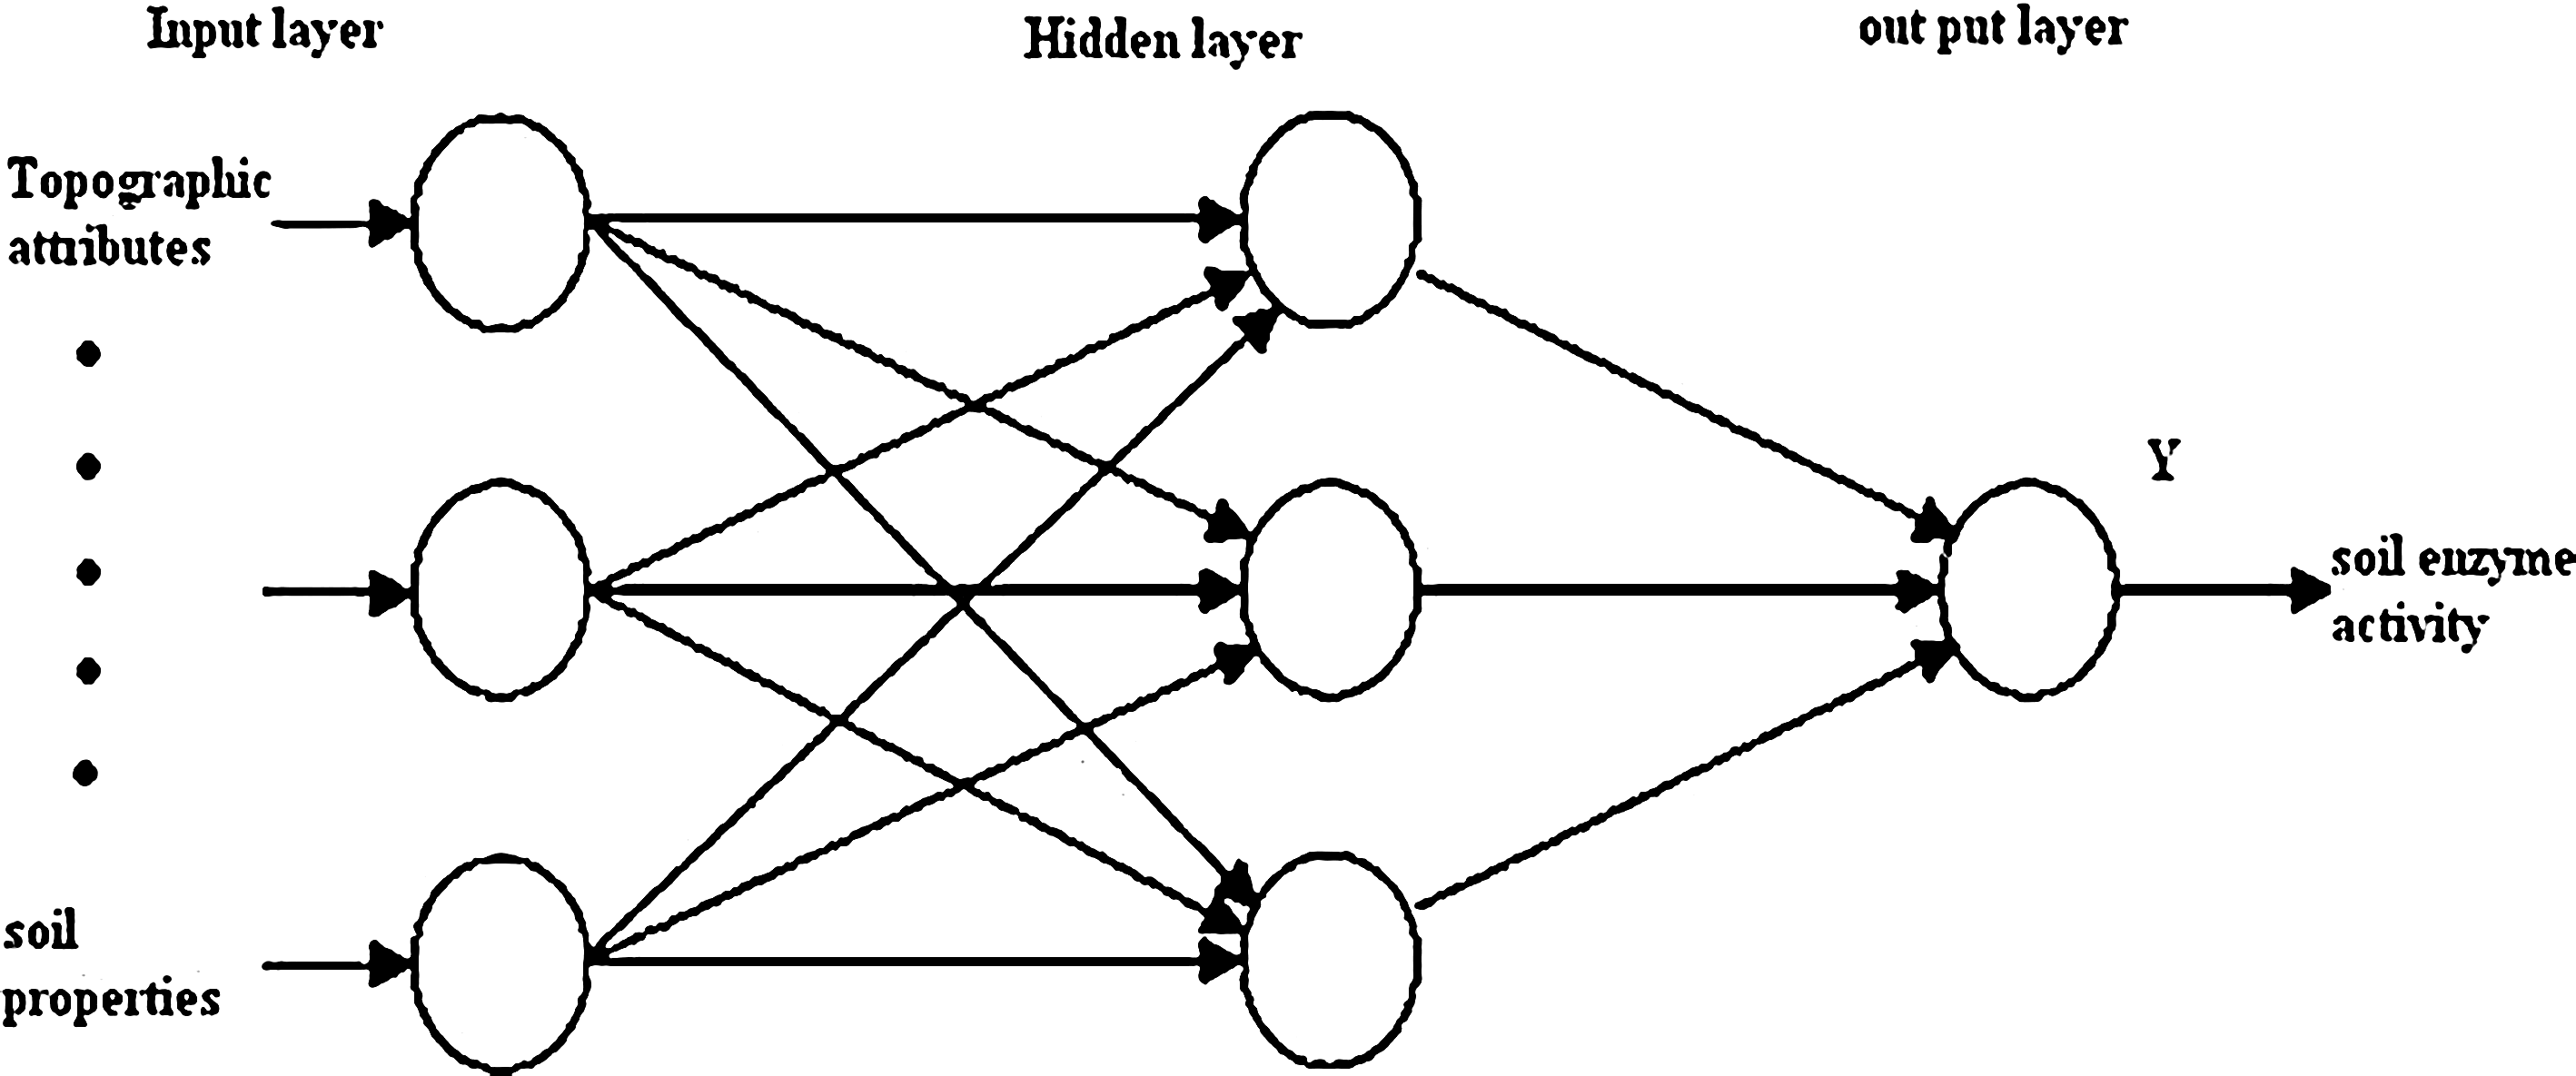
Structure of the developed feed-forward artificial neural network for the modeling of relationships between soil enzymes activity and soil and topographic attributes in the selected site in central Iran.
A total of 125 data sets were divided into three data sets for learning (75 data), testing (25 data), and verification (25 data) process. The soil and topographic characteristics were introduced in the input layer and SEA in the output layer (Fig. 4). The data sets for testing and verification processes were selected in a stratified random manner at different points of geomorphic surfaces in the field to avoid bias in estimation.
Final computed output of the network was prepared to compare with the target output. In this regard, an appropriate objective function such as the root mean square error (RMSE) was calculated as follows (Degroot, 1986):
where
Tpj is the jth element of the target output related to the pth pattern;
Opj is the computed output of jth neuron related to the pth pattern;
np is the number of patterns;
no is the number of neurons in the output layer.
The RMSE estimates the accuracy of prediction (e.g., a larger RMSE value indicates a lower accuracy in prediction).
In this study, ANN modeling was performed using MATLAB software package (MATLAB, 2008). The number of hidden layers, number of neurons in the hidden layers, and the number of iterations were selected by calibration through several test runs and trial and error (Marquardt Levenberg learning rule). Various activation functions were tested for MLP neural networks.
In order to identify the performance of the MLR and ANN models, the RMSE, mean estimation error (MEE), and correlation coefficient (R) between the measured and the estimated values were used.
To identify the most important terrain attributes and soil properties affecting SEA, sensitivity analysis was done using the Hill method (Hill, 1998). The variable with the maximum relative sensitivity coefficient is the most important variable.
Results and Discussion
Descriptive statistics
Descriptive statistics of soil properties and SEA are presented in Table 2, and the descriptive statistics of topographic attributes are given in Table 3. The SOC content in the soils studied varied from 0.33% to 2.2% with an average of 0.81 and SD of 0.28. The lowest variability (CV=1.71%) was ascribed to pH, followed by EC (CV=4.89%). These results are consistent with the findings by other researchers (Shukla et al., 2004). The highest variability was observed for the L-asparaginase enzyme activity (CV=209%). The other soil properties such as particle size distribution, SOC, and CCE showed moderate variability according to the classification proposed by Wilding (1985). It seems that the variability in soil properties depends on topography of the field and the landscape position, causing differential accumulation of water at different positions on the landscape, resulting in a high variability in the activity of the soil enzymes within the landscape. The SON showed high variability (CV=74.28%) in the studied hilly region. A part of this high variability in SON is attributed to quantity and quality of soil organic matter in different positions of the hillslope; and the variability might also be due to the extent of adsorption of SON to mineral surfaces for which the mechanisms are not very well understood (Kaiser and Zech, 2000).
STI, sediment transport index; RSP, relative stream power; Shaded, shaded relief.
EC, electrical conductivity; CCE, calcium carbonate equivalent; TN, total nitrogen; SOC, soil organic carbon; N, nitrogen; SON, soluble organic N, UAc, urease activity; AAc, L-asparaginase activity; GAc, L-glutaminase activity; SD, standard deviation; CV, coefficient of variation.
The correlation coefficients among topographic attributes, soil properties, and SEA are presented in Table 4. Soil properties showed significant relationships with selected topographic attributes. Clay, silt, TN, and SOC showed positive significant correlations with WI and negative relationships with some topographic attributes (Slope, PlanC, Aspect, STI, and RSP) that influence soil erosion and depositional processes along the hillslope. These relationships have been widely reported by other researchers (e.g., Florinsky et al., 2002; Huang et al., 2007). SEA also showed low significant correlation coefficients with topographic attributes (Table 4), but they showed positive significant correlation with WI. The linear relationships among SEA and soil properties are presented in Table 5.
and **: Significant at the 0.01 and 0.05 level, respectively.
Correlation is significant at the 0.01 level (2-tailed).
Correlation is significant at the 0.05 level (2-tailed).
Urease activity showed a positive significant correlation with clay, EC, CCE, SOC, and TN and a negative significant correlation with sand content. A similar trend was observed for the two other enzymes. The dependency of soil properties especially SOC, TN, and soil nutrients with topographic attributes may affect the variability of soil enzymes along the hillslope. Florinsky et al. (2004) also reported that topography in hilly regions controls the accumulation of soil moisture and soil organic matter, and indirectly SEA.
MLR modeling
Multivariate linear regression equation was developed for SEA, and then, MEE and RMSE were developed for model validation. A summary of the best MLR models developed for predicting the activities of the three soil enzymes is given in Table 6.
MEE, mean estimation error; RMSE, root mean square error.
The MLR model developed accounted for 51% of total variability in urease activity and resulted in RMSE and MEE values of 0.064 and 0.019, respectively. The values of R2, MEE, and RMSE for L-GAc by the MLR models were 0.62, −0.004, and 0.08, respectively. The calculated performance indicators for L-asparaginase activity prediction, MEE, RMSE, and R2 determined, were −0.001, 0.115, and 0.37, respectively. The most important soil and topographic parameters, which showed linear relationships of these variables with the enzymes activities, are given in Table 6.
ANN modeling
For predicting the SEA in the selected hilly region, results on the the best structure of the ANN for each parameter was ascertained (Table 7). Each of the trained structures had 22 input nodes in two categories of soil and topographic properties, and one output node (SEA). The hidden-layer nodes optimized were 25, 20, and 12, and the optimum iteration learning rates based on trial and error were at 9,000, 6,000, and 3,000 for UAc, L-GAc, and L-AAc activity, respectively. The ANN models for UAc, L-GAc, and L-AAc activity resulted in MEE, −0.013, −0.002, and −0.008 and RMSE, 0.02, 0.02, and 0.019, respectively. The ANN models developed for simulating enzymes activity explained 97%, 96%, and 98% of the variability in the UAc, L-GAc, and L-AAc activities, respectively, at the site studied.
Comparison of the efficacy of the models
Based on the values of the evaluation indices (R2, MEE, and RMSE) presented in Tables 6 and 7, it appears that MLR models had lower efficacy to predict the activities of the three soil enzymes than did the ANN models. In general, the predicted enzyme activities using the ANN models were in better agreement with the observed values than those predicted using the MLR models. Linear multiple regression models were not able to predict a large proportion of total variability in the SEA, presumably because the effects of the predictors on the dependent variables might not be linear in nature.
Application of ANN modeling improved coefficients of determination for the activities of UAc, L-GAc, and L-AAc, 47.83%, 35.93%, and 62.34%, respectively. Our results corroborate those reported by others; for instance, Kaul et al. (2005) compared the MLR and ANN models in predicting the corn and soybean yields and reported that the ANN models consistently gave more precise yield predictions than done by the regression models.
ANN application has functional characteristics and provides many advantages over the MLR approach. The most important advantage of using the neural network approach is that the network trained to find the relationships and the lack of them are assumed before hand; and also the other powerful attributes of ANN models include their flexibility and adaptively, which play an important role in material modeling. It appears that the ANN approach may be more valid in predicting the SEA using soil and topographic attributes in the area studied. A reason for these findings can be attributed to the nonlinear relationship between soil and topographic attributes and the SEA, and the ANN technique can estimate this relation using nonlinear functions. The lower accuracy of the MLR approach in estimating the SEA might also be due to sample distribution, spatial variation, and the scale effects at the site studied.
Determination of important factors influencing SEA
Important soil and terrain factors or attributes determined for sensitivity analysis, based on the coefficients of sensitivity of the ANN models, for the SEA are shown in Fig. 5.

Histogram displaying results of sensitivity analysis.
In sensitivity analysis for predicting urease activity, the top 10 factors identified were aspect, CCE, SON, silt, TangC, Shaded, WI, and PlanC. The top 10 factors that showed the greatest sensitivity to L-GAc were also the same for UAc activity. Aspect, sand, silt, CCE, SON, Shaded, ProfC, slope, MeanC, and TangC were identified as the 10 most important factors for predicting the L-GAc activity. The results of sensitivity analysis for L-AAc showed that L-AAc was more sensitive to topographic attributes. The ten top factors that showed the greatest sensitivity to L-AAc were Shaded, SCA, RSP, TangC, aspect, MeanC, ProfC, slope, PLanC, and CA.
In the present study, topographic attributes including aspect were recognized as the most important factors influencing the distribution of SEA. Aspect and PlanC have been used to predict the spatial patterns of soil water content (Moore and Wilson, 1992), solar radiation (Moore et al., 1993b), distribution of physical and chemical properties of the soil (Moore et al., 1993b), and distribution of vegetation (Moore et al., 1993a). All the soil and edaphic characteristics just mentioned affect SEA directly or indirectly. Soil enzymes are derived from living and dead microbes, plant roots, residues, and soil animals (Askin and Kizilkaya, 2006) and, therefore, the soil and topographic characteristics that influence the latter variables also explain the variability in SEA.
Among the soil factors, texture, CCE, and SON were included in the top 10 variables affecting SEA. Soil enzymes are stabilized in the soil matrix, accumulate, or form complexes with organic matter and clay asorgano-clay complexes (Tabatabai, 1994). The activity of many soil enzymes correlate with soil moisture, pH, and temperature values (USDA Natural Resources Conservation service, 2010), which are greatly affected by topographic attributes in hilly regions. Naidja et al. (2000) examined the relationships between physicochemical properties and enzyme activities in the soil and, in general, found the positive effects of clay and organic matter content on extracellular enzyme activity in the soil.
SON was one of the other important factors influencing the urease and L-glutaminase activity. SON plays a vital role in the ecosystem processes and has been increasingly recognized as an indicator for soil N availability, mineralization, and leaching (Cookson et al., 2007; Chen and Xu, 2008). The variation in soil SON has been attributed to the quality and quantity of organic matter (Burton et al., 2007). Xing et al. (2010) showed that soluble organic C and SON pools were positively related to soil total C and N, microbial biomass C and N; and the results also showed that the SEA were highly correlated with SON.
Conclusions
We evaluated the efficacy of ANN and MLR models for predicting the activities of three amidohydrolases in soils under pasture in the hilly region soils of southern Isfahan province, central Iran. Results revealed that ANN models provided a better estimate of the enzyme activities than did the MLR models. It is concluded that topography preassembly controls the distribution of SEA through its effects on soil properties such as soil moisture, temperature, SON, clay, SOC, and vegetation cover. Overall, the topographic attributes could be efficiently applied to account for explaining the variability in SEA within the hillslope. It is suggested that easily accessible, quantitative topographic data such as DTMs can be used to predict the SEA at the hill slope scale, especially by employing nonlinear ANN modeling.
Footnotes
Author Disclosure Statement
No competing financial interests exist.