
Abstract
Abstract
Palladium-modified titanium dioxide, prepared using a one-step hydrothermal synthesis method, was employed for the photocatalytic oxidation of nitric oxide in gas phase. It was found that palladium dopants in the prepared photocatalysts existed as Pd2+ ions, palladium oxide particles, and metallic triphenylphosphine palladium. Pd2+ ions provided key contributions to the improvement of photocatalytic activity, while triphenylphosphine palladium and palladium oxide deposits on titanium oxide had almost no positive effect on nitric oxide oxidation.
Results of the study indicated that photogenerated electrons and holes were efficiently separated after palladium doping. The bimodal pore-size distribution of the catalysts enhanced the speed of the photocatalytic reaction. Activity tests showed that the optimum palladium dopant content was 0.05% and the maximum conversion of nitric oxide was about 72.6% higher than that using titanium dioxide powder at 100 ppm. Results of this study show that palladium/titanium dioxide prepared using the one-step hydrothermal method may be more efficient in oxidizing nitric oxide than titanium dioxide powder.
Introduction
Our previous study showed that TiO2 coated on a woven glass fabric was effective for the oxidation of NO at low concentrations (Wang et al., 2007; Wu et al., 2008). For the production of nano-sized TiO2 particles with low energy waste, hydrothermal synthesis is an attractive technique (Kominami et al., 1997). The prepared powders exhibit narrow particle size distributions, phase homogeneity, controlled particle morphology, and a decrease in agglomeration among particles (Deng et al., 2002). The morphology and crystallinity of TiO2 particles is obtained by controlling synthesis conditions, including temperature, treatment time, and composition of the solution (Kontos et al., 2005; Wu et al., 2004).
Although we recently reported that gas-phase photocatalytic oxidation of NO over Pd-modified TiO2 (Pd/TiO2) catalysts was effective (Sheng et al., 2008; Wu et al., 2009a; Wu et al., 2009b), the Pd doping of TiO2 using hydrothermal synthesis has been little studied, especially its application for photocatalytic oxidation of NO. This article presents a study of NO photocatalytic oxidation using Pd/TiO2 synthesized by a one-step hydrothermal method. As part of the study, the physicochemical properties of the prepared TiO2 catalysts were characterized, and the relationship between physicochemical properties and NO conversion efficiency was discussed.
Materials and Methods
Catalysts preparation
Nano-sized Pd/TiO2 particles were prepared by hydrothermally treating sol-gel- derived hydrous oxides. All the reagents were of analytical reagent (AR) grade and employed without any further purification. A solution of 0.1 mol tetrabutyl titanate dissolved in 1.5 mol anhydrous ethanol was added, drop by drop, to a water-ethanol solution of 5 mol water and 1 mol ethanol. A white precipitate of amorphous oxide was produced. A palladium chloride/hydrogen chloride (PdCl2/HCl) solution was added into the slurry to obtain a Pd loading of 0.01%–0.5%(wt.). The PdCl2/HCl solution was obtained by dissolving 1 g PdCl2 into a 100 mL HCl solution [37%(wt.)]. The mixture was stirred with a magnetic stirrer at room temperature for 1 h. The precipitate and mother-liquid were then transferred to a Teflon-covered stainless steel autoclave with a volume of 300 mL for hydrothermal treatment at 200°C for 24 h. After hydrothermal crystallization, the precipitate was washed with ethanol three times, followed by centrifugation. It was then heated at 373K for 12 h. Commercial TiO2 powder, Degussa P25, was used as the contrast material in this study.
The dip-coating method (Wang et al., 2007) was used to immobilize the photocatalyst onto a woven glass fabric. The Pd/TiO2 catalyst (8 g) was carefully ground and vigorously stirred into 100 mL deionized water. A 4 cm×80 cm woven glass fabric was heated at 500°C for 1 h and then dipped into the Pd/TiO2 suspension. In all experiments, the weight of catalyst coating was kept at 0.5 g±10%.
Catalyst characterization
X-ray diffraction (XRD) patterns were obtained using a Rigaku D/Max RA x-ray diffractometer with Cu Kα radiation at 40 kV and 150 mA, at an angle of 2θ from 20° to 80°. BET surface areas (SBET) were determined using nitrogen gas (N2) physisorption at 77K, with Micromeritics ASAP 2020 equipment. Surface element analysis was carried out by x-ray photoelectron spectroscopy (XPS), using a Thermo ESCALAB 250 instrument with Al Kα radiation (hν=1486.6 eV) at 150 W. The morphology, structure, and grain size of Pd-modified TiO2 were examined with a JEM-2010 transmission electron microscope (TEM) and high resolution transmission electron microscope (HR-TEM). Photoluminescent spectra were measured at room temperature using a Fluorolog-3-Tau fluorospectrophotometer with a xenon (Xe) lamp as the excitation light source.
Photocatalytic reaction
The setup and operating conditions for photocatalytic activity tests were the same as those in our previous studies (Sheng et al., 2008; Wu et al., 2009a). As shown in Fig. 1, all photocatalytic activity experiments were carried out in a continuous setup, consisting of a gas supply, reactor, and analytical system. The flow rate of the gas was 2.0 L/min and the residence time was 10 s. Humidity could be adjusted by varying the flow rate of the stream of oxygen going into the water bath. Photocatalytic experiments were carried out in a 340 mL cylindrical Pyrex glass reactor (4 cm inner diameter; 27 cm high). The immobilized catalyst was set into the reactor on a Z-type woven fabric. The irradiation source was an Hg-arc lamp (125 W, Philips) located outside the reactor. The wavelength of the lamp varied from 300 nm to 400 nm with the maximum light intensity at 365 nm. The temperature in the reactor was 80°C±5°C from the irradiation of the lamp. NO and NO2 were analyzed with a Thermo Scientific, Model 42i-HL NO-NO2-NOx Analyzer. Relative humidity (RH) was measured with a Testo Co. Ltd., Model 605-H1 relative humidity analyzer.

Schematic of photocatalytic oxidation equipment.
Using 100 ppm inlet NO, at 80°C±5°C, blank tests were conducted with the Hg-arc lamp turned on but without the photocatalyst. The variation of the NO concentration could not be observed within 120 minutes of irradiation. Furthermore, there was no change in the NO concentration when the Hg-arc lamp was turned off and the catalyst was present in the reactor.
Results and Discussion
Crystal phase and surface composition
The XRD spectra of photocatalysts with increasing Pd content (0.01%–0.5%) are shown in Fig. 2. It can be seen that the crystalline TiO2 was obtained using the hydrothermal method. With 0.01% Pd, the TiO2 displayed a mixture of anatase and brookite, but no Pd containing species were observed. The small peak at 2θ=30.7° corresponds to the diffraction peak (121) of the brookite phase. The presence of this phase induced the slight shift to a higher angle of the anatase (101) peak since that peak was overlapped by brookite (120) and (111) peaks. Yu et al. (2002, 2006) have described the mechanism of brookite formation in acid media during solvothermal synthesis. The precursor PdCl2 used in this study was dissolved in a HCl solution, resulting in the formation of the brookite phase. With the increasing Pd content, remarkable diffraction peaks (2θ=27.3°) corresponding to the rutile (110) peak were observed from curve F. It can be deduced that Pd promoted the TiO2 phase transformation from anatase to rutile.
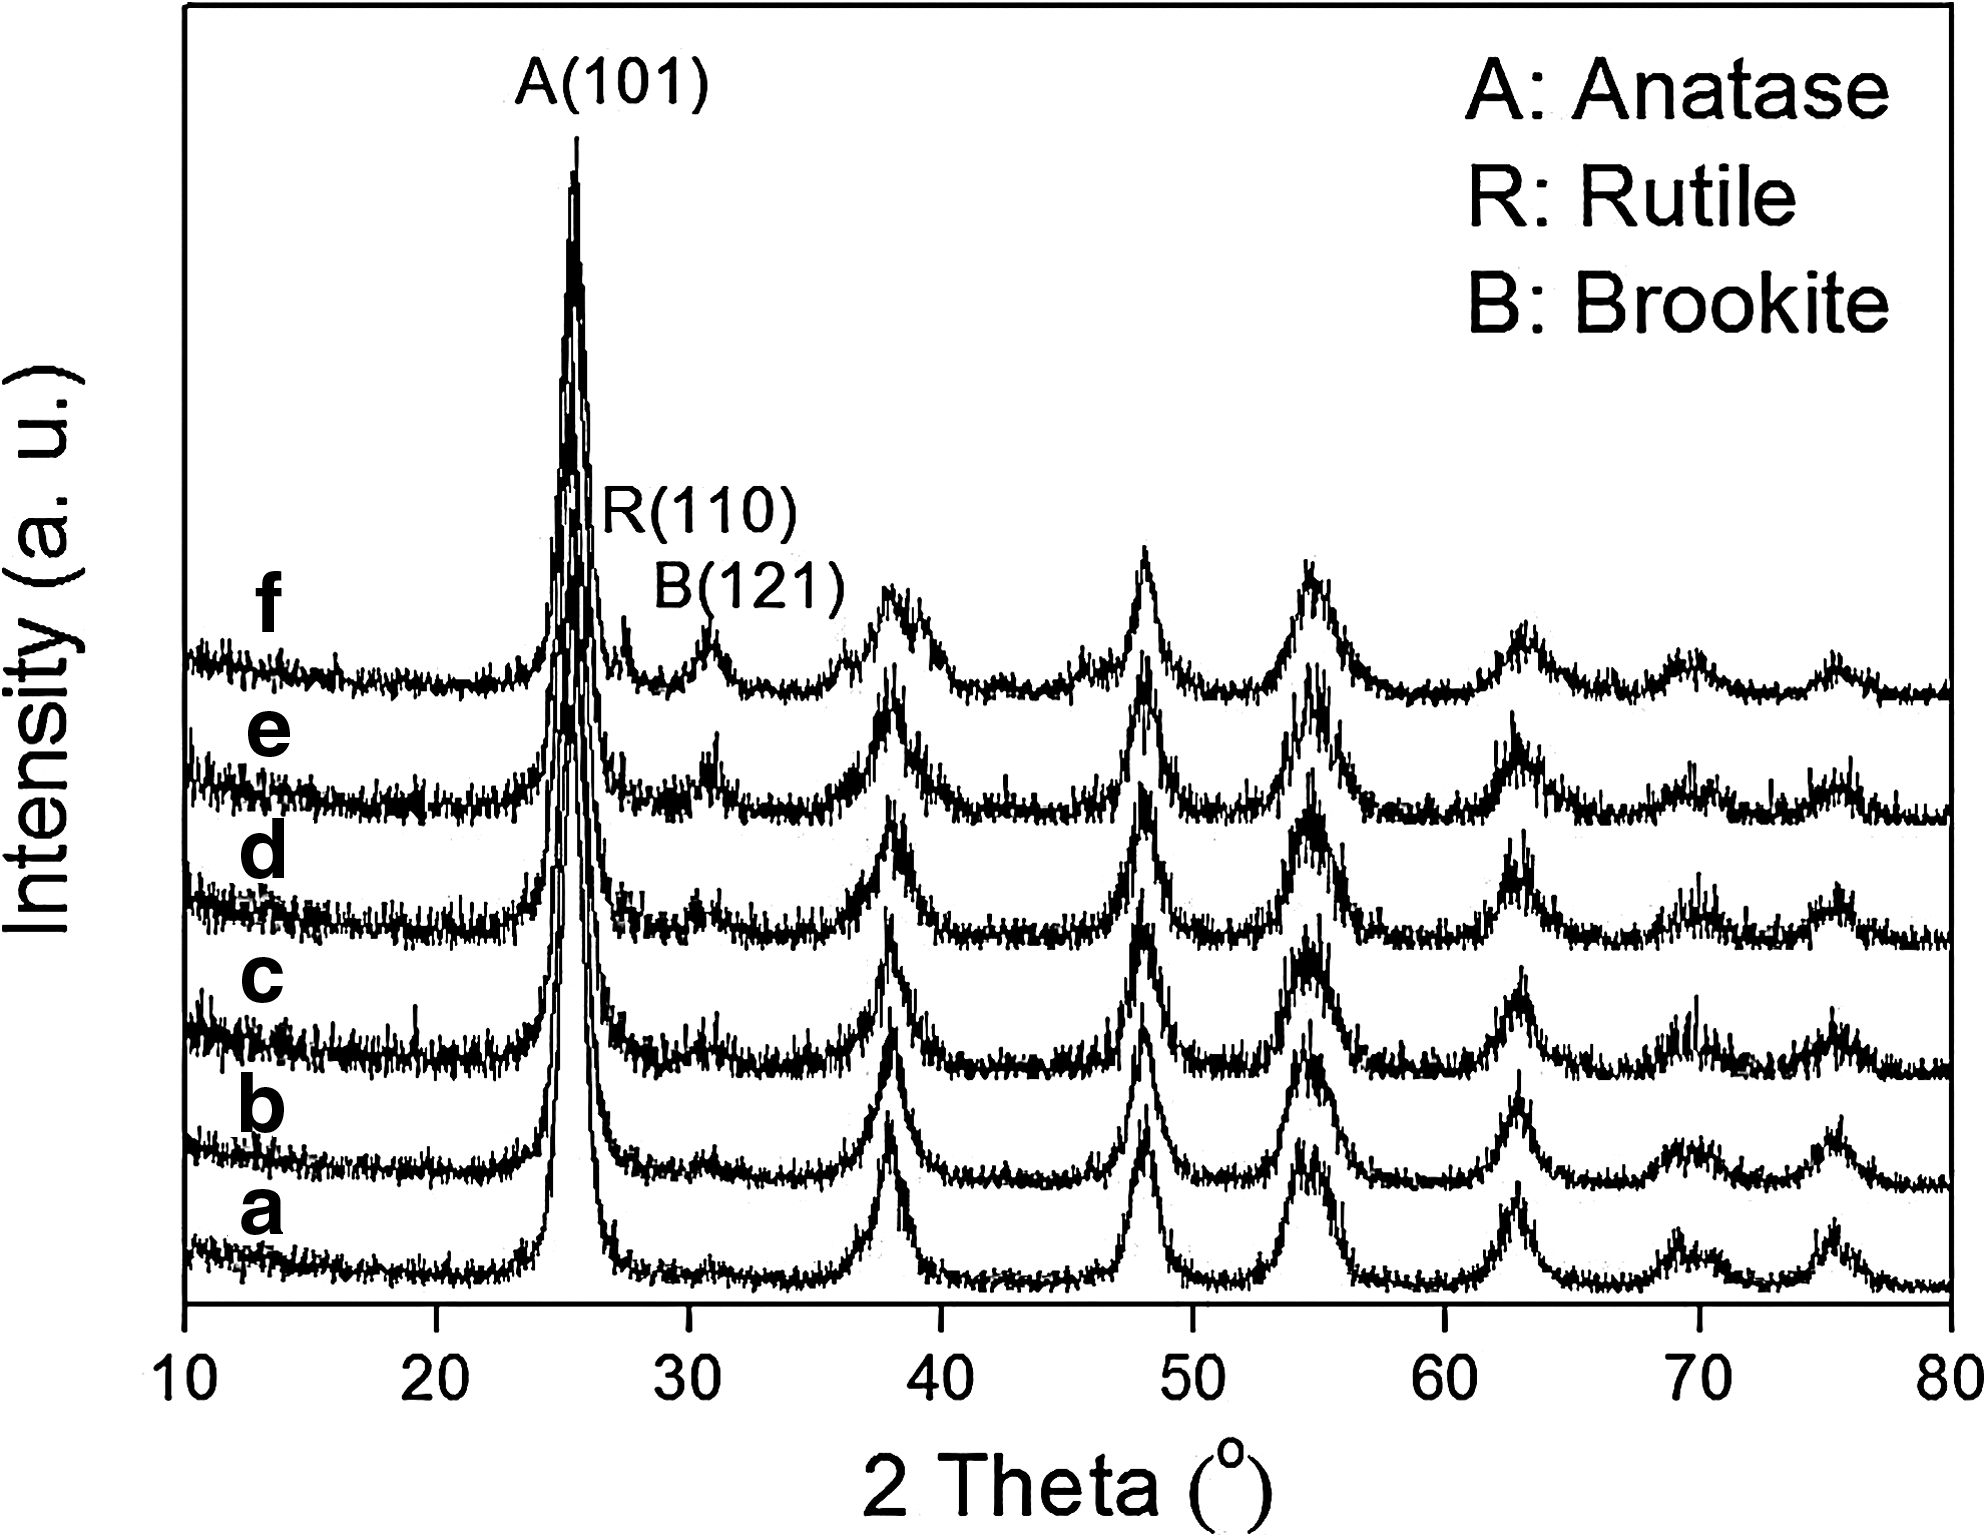
X-ray diffraction (XRD) patterns of catalysts with different Pd dopant content:
Element composition was determined by XPS high-resolution scans over carbon (C) 1s, oxygen (O) 1s, chlorine (Cl) 2p, titanium (Ti) 2P, and Pd 3d spectra regions. The atomic ratio of Pd on the surface of Pd/TiO2 is shown in Table 1. Figure 3a shows the Pd 3d peaks of 0.5% Pd/TiO2 photocatalyst. The broad 3d5/2 peak was well fitted as a combination of Pd2+ (peak at 336.97 eV), PdO (peak at 335.72 eV) and Pd0 (peak at 334.92 eV), and was in agreement with the findings of other researchers (Gniewek et al., 2005; Voogt et al., 1996; Zemlyanov et al., 2006). The fractions of Pd2+, PdO, and Pd0 were about 11.3%, 14.4% and 74.3% in the sample. Figure 3b shows the O 1s spectra give three distinct peaks. The two lower binding energy (BE) peaks are due to oxygen from water (H2O) and the hydroxyl (OH) functional group, whereas the highest BE peak is due to oxygen from TiO2, as noted in our earlier study (Wu et al., 2009a). The fractions of oxygen element in Ti-O (O in TiO2 crystal lattice), OH, and H2O were 84.0%, 11.7%, and 4.3%. It has been reported that hydroxyl functional groups on a TiO2 surface would capture holes to produce hydroxyl radicals (OH⋅), which are strong oxidizing agents (Hoffmann et al., 1995; Linsebigler et al., 1995). When the holes were captured by the hydroxyl groups, the recombination of photogenerated electrons and holes was restrained. More electrons could reduce oxygen to form superoxide ions (O2−⋅). OH⋅ and O2−⋅ both played very important roles in NO adsorption and the oxidation process (Wu et al., 2009a).

X-ray photoelectron spectroscopy (XPS) high-resolution scan over
SBET calculated from the linear part of the BET plot (P/P0=0.2–0.4).
Average pore diameter estimated using the adsorption branch of the isotherm and the Barrett-Joyner-Halenda (BJH) formula.
Total pore volume taken from the volume of N2 adsorbed at ∼P/P0=0.987.
XPS, x-ray photoelectron spectroscopy; BET, Brunauer–Emmett–Teller.
The morphology of Pd modified TiO2 powders was further investigated by TEM and HR-TEM images, as shown in Fig. 4. TEM micrographs show primary particles had diameters that ranged from 8 nm to 10 nm. The aggregation of some primary particles is shown in Fig. 4a. The size of the aggregates varied from 30 nm to 50 nm. Clear lattice fringes can be observed for hydrothermal synthesized Pd/TiO2 particles in the HR-TEM image shown in Fig. 4b. Three kinds of lattice planes were found. The spacing between the lattice planes of the sample was 0.352 nm for (101) plane of the anatase crystal, in agreement with the previous report (Chae et al., 2003). Another observed spacing between lattice planes was about 0.22 nm, matching the (110) plane of metallic Pd0, as noted in the previous study (Agrawal et al., 2005). A lattice fringe spacing of 0.262 nm corresponded to the (101) face of PdO particles, which has been reported in the former literature (Datye et al., 2000).

Images of 0.5% Pd/TiO2:
Optical properties
Photoluminescence (PL) emission spectra have been used to study the transfer behaviors of photogenerated electrons and holes and to understand the separation and recombination of photogenerated charge carriers (Zhang et al., 2000). In order to investigate the photoelectric properties of Pd/TiO2, the PL spectra were detected for different samples excited at 300 nm at room temperature. As shown in Fig. 5, there are three peaks at 390 nm (peak I), 434 nm (peak II), and 566 nm (peak III). Peak I can be ascribed to the emission of the intrinsic band gap transition (Dong et al., 2010). As Hu et al. (2003) have noted, because of an electron transfer from lattice oxygen (O2−) to the titanium ion (Ti4+) when UV light is irradiated on pure TiO2, a charge-transfer excited state (Ti3+–O2−)* is formed. Therefore, the observed PL spectrum can be ascribed to the radiative recombination process from the charger excited state of the highly dispersed titanium oxide species to the ground state. Peak II originates from the charge transfer transition of an oxygen vacancy trapped electron, and peak III comes from the interstitial Pd states previously noted by Jing et al. (2006). The PL intensity greatly decreased with an increase of the Pd dopant content. It is known that the intensity of the emission from the TiO2 particles has a strong effect on the surface treatment of TiO2 particles (Yu et al., 2002). Pd species, including Pd0 metal, PdO particles and Pd2+ ions, deposited on the surface may act as trapping sites to capture photogenerated electrons from the TiO2 conduction band separating the photogenerated electron-hole pairs. Therefore, the recombination rate of photogenerated electrons and holes may be retarded, leading to the reduction of PL signal.

Photoluminescence spectra of photocatalysts with different Pd amounts at room temperature after excitation at 300 nm.
BET surface areas and pore structure
Figure 6 shows the distribution curve of the pore sizes and the corresponding nitrogen adsorption-desorption isotherms of bare TiO2, 0.05% Pd/TiO2, and 0.5% Pd/TiO2. The BET surface area and pore parameters of the samples, determined from the nitrogen adsorption-desorption isotherm using the Barrett–Joyner–Halenda (BJH) method, are summarized in Table 1. The inset adsorption isotherms in Fig. 6 show that the Pd/TiO2 catalyst presents type IV isotherms, measuring 2 nm to 50 nm. Type IV isotherms indicate the presence of mesopores (Gregg and Sing, 1982). The mesoporous structure of Pd/TiO2 particles may be attributed to pores formed between TiO2 particles. The pore-size distribution of bare TiO2 ranged from 2 nm to 10 nm with an average pore diameter of 8.7 nm on bare TiO2 (Fig. 6a). As Fig. 6b indicates, in the 0.5% Pd/TiO2 catalyst, there are two kinds of mesoporous structures. One, centered at 8.8 nm, corresponds to small mesopores (2–20 nm), and one, centered at 32.4 nm, corresponds to large mesopores (22–45 nm). Yu et al. (2003) have reported that the bimodal pore-size distribution benefits rapid diffusion of various reactants and products during a photocatalytic reaction and enhances the speed of the photocatalytic reaction. However, as shown in Fig. 6c, the bimodal pore-size distribution disappears with a Pd high dopant content. It can be seen from Table 1 that the BET surface area was greatly enhanced with an increase in Pd dopant content from 0% to 0.05%, because of the evolution of pore structure from monomodal pore-size distribution to bimodal pore-size distribution. With the further increase in Pd loading, however, the BET surface decreased.
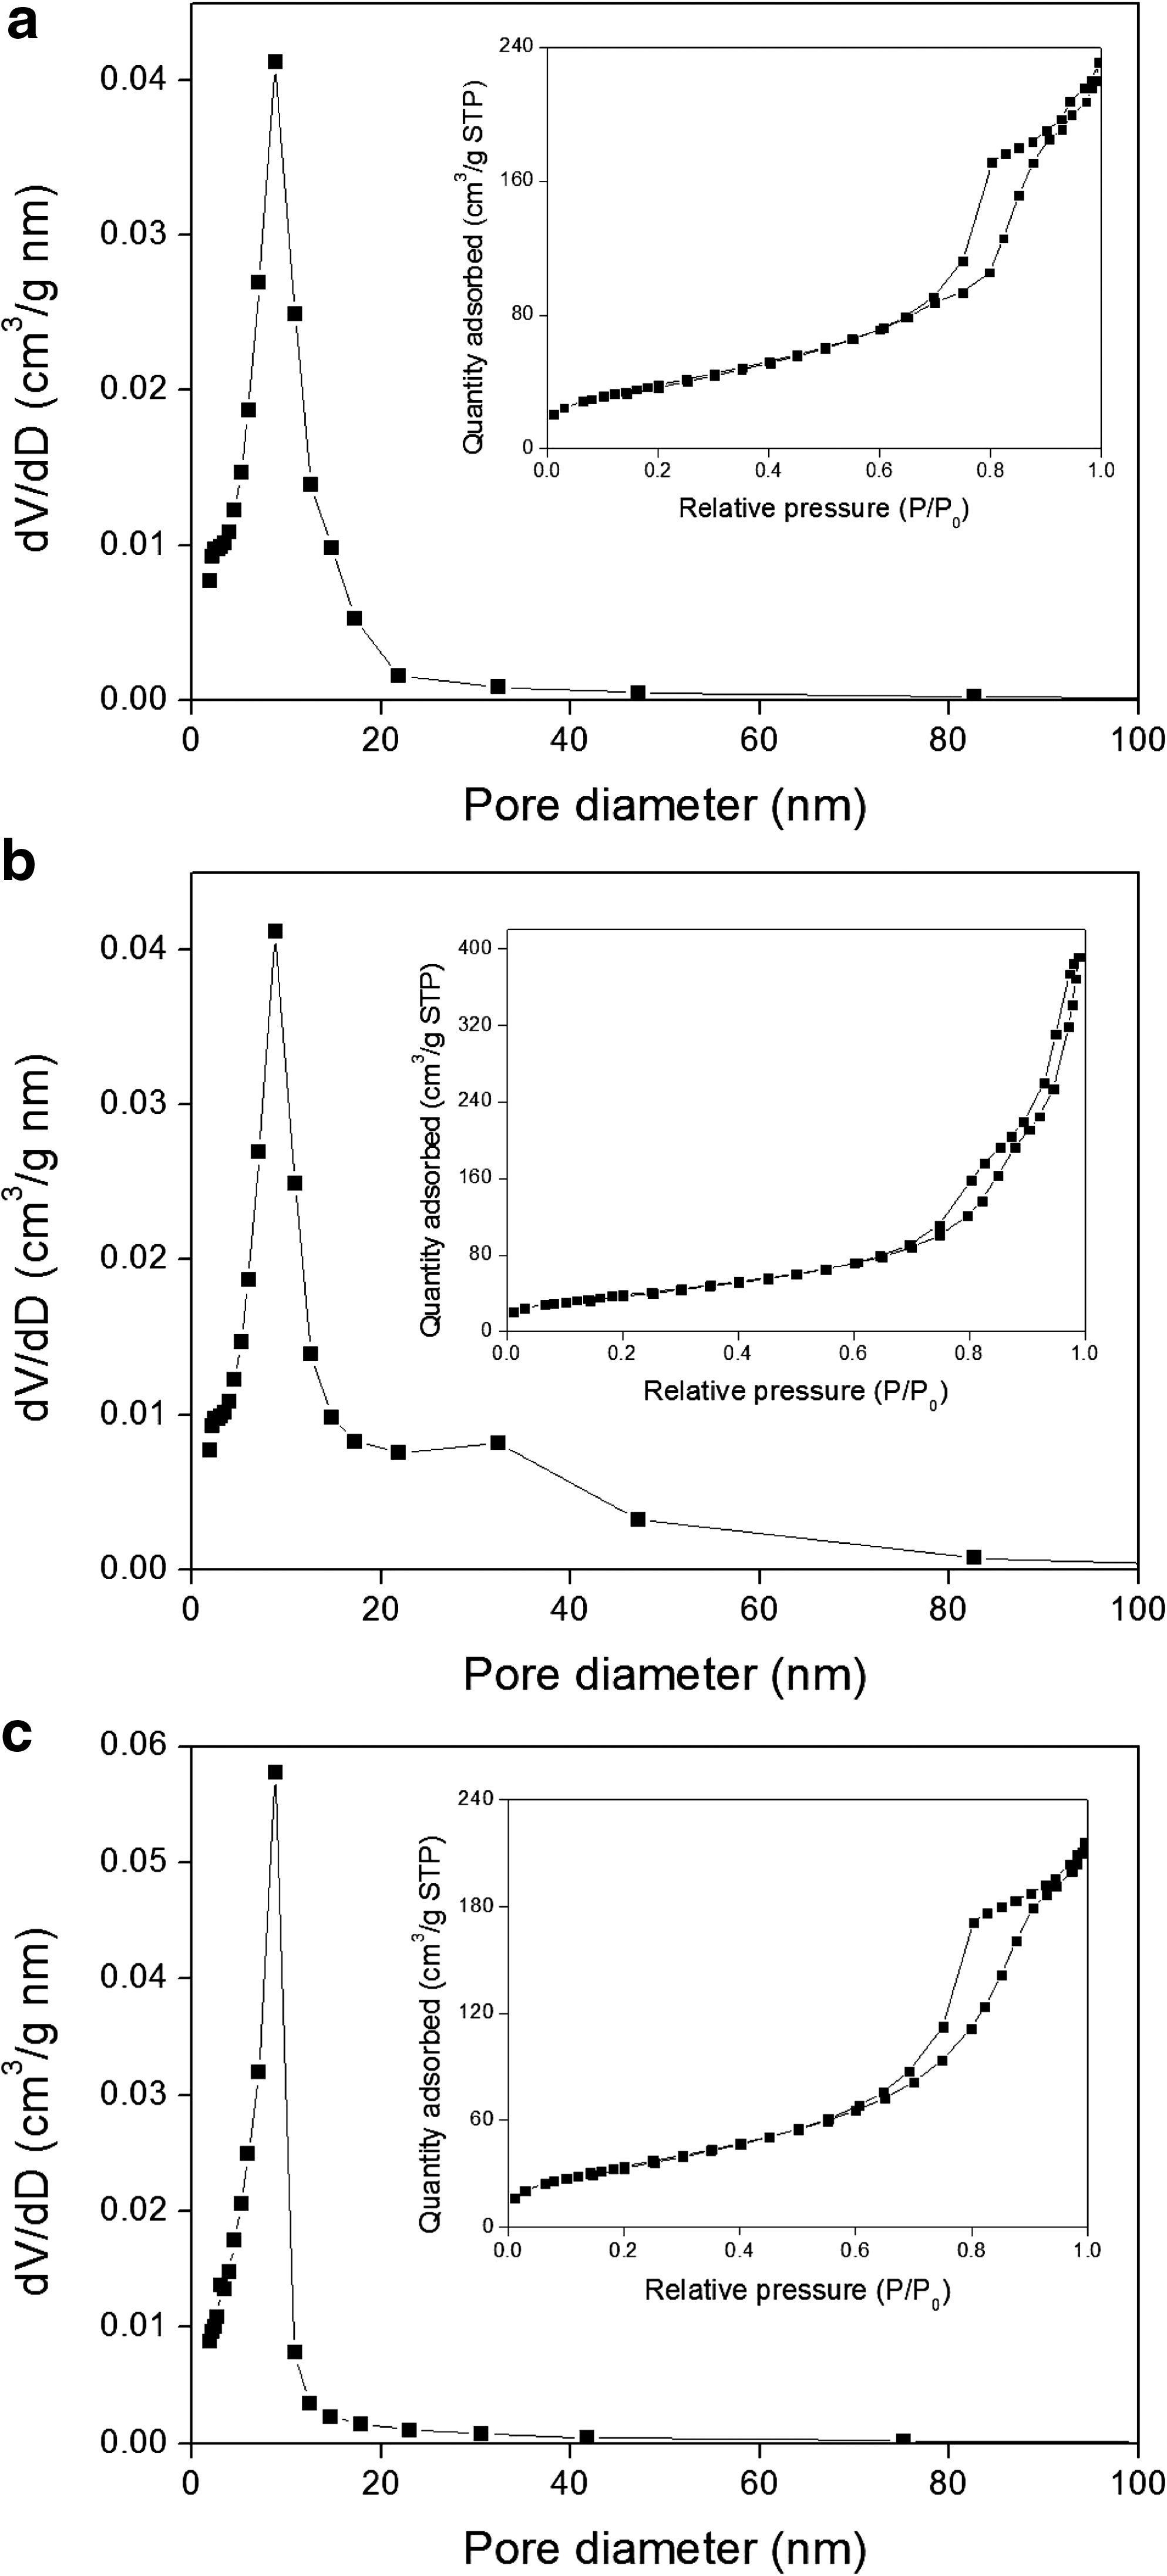
Distribution curve of pore size calculated from the desorption branch of the nitrogen isotherm using the BJH method and the corresponding nitrogen adsorption-desorption isotherms (inset) of
Photocatalytic properties of Pd/TiO2
The photocatalytic activity of the Pd-modified TiO2 was evaluated by measuring the photocatalytic oxidation of NO in gas phase under UV light. Figure 7 shows the variations of NO conversion efficiency over time in an environment with a relative humidity of 75%. NO conversion efficiency is based on inlet/outlet NO concentration. Although initially a high conversion (67.5%) of NO was observed with Degussa P25, after approximately 150 min of irradiation, NO conversion decreased and approached a steady state (47.5%). Published literature has presented similar results (Devahasdin et al., 2003; Wang et al., 2007). NO conversion with Pd/TiO2 catalysts reached a maximum value of 82% after 150 min of irradiation, nearly 72.6% higher than that on pure Degussa P25. The Pd/TiO2 catalysts prepared by the hydrothermal method exhibited superior photocatalytic oxidation activity. In our previous reports, we have noted that Pd2+ ions deposited on TiO2 may be one reason for the different behavior of Degussa P25 and Pd/TiO2 (Sheng et al., 2008; Wu et al., 2009a, 2009b). During the initial state of the reaction, it is possible the Pd4+ are formed from the Pd2+ oxidation by OH⋅ and O2−groups. With the reaction going on, the Pd4+ on the surface of TiO2 may act as electron traps. When equilibrium between Pd2+ and Pd4+ is established, the highest conversion of NO is reached. The photocatalytic performance of Pd/TiO2 prepared by the hydrothermal method is superior to the performance of the catalyst prepared by the impregnation method. This may be because the nanoparticles prepared by hydrothermal method have narrow particle size distributions, phase homogeneity, and a decrease in agglomeration among particles (Sheng et al., 2008).

Variations of NO conversion efficiency with irradiation time for Degussa P25 and 0.05% Pd/TiO2. Operating conditions: 125 W Hg-arc, 80oC, 75% relative humidity, 10 s residence time, 21% O2 concentration and 100 ppm initial NO concentration.
Figure 8 shows NO conversion efficiency on Pd/TiO2 after 1200 min of irradiation with an inlet NO concentration of 100 ppm. A series of Pd dopant amounts (0.01%, 0.025%, 0.05%, 0.1%, and 0.25%), were chosen to investigate the relationship between Pd amounts and the photocatalytic activities of Pd/TiO2. It can be seen in Fig. 8 that the photocatalytic oxidation activity of NO was greatly enhanced with the increase of Pd dopant from 0.01% to 0.05%. However, the activity decreased when Pd loading was further increased. Therefore, the optimum Pd dopant is at the initial Pd weight amount of 0.05%. The highest conversion (82%) occurred on 0.05% Pd/TiO2. The PL results (see Fig. 5), suggest that Pd species deposited on the surface may act as trapping sites to capture photogenerated electrons, separating the photogenerated electron-hole pairs. The OH- groups on the Pd/TiO2 surface that were detected by XPS (see Fig. 3b) may play key roles in the adsorption and oxidation of NO. OH− groups on the catalytic surface may trap the electrons to form hydroxyl radicals. The hydroxyl radicals can then react with NO to form HNO2, HNO3 and NO2. When the holes are captured by the hydroxyl groups and electrons are trapped by Pd species, the recombination of electrons and holes is restrained. Hydrothermal synthesized Pd/TiO2 with bimodal pore-size distribution favors the adsorption of NO and desorption of NO2 from the photocatalyst surface, which results in the enhancement of photocatalytic activity. However, the enhancement of activity for Pd modification will decrease when Pd doping is higher than 0.05% because the surface of TiO2 is covered by too much Pd dopant and cannot be irradiated efficiently, which reduces the apparent photo-quantum yield of photocatalytic process.
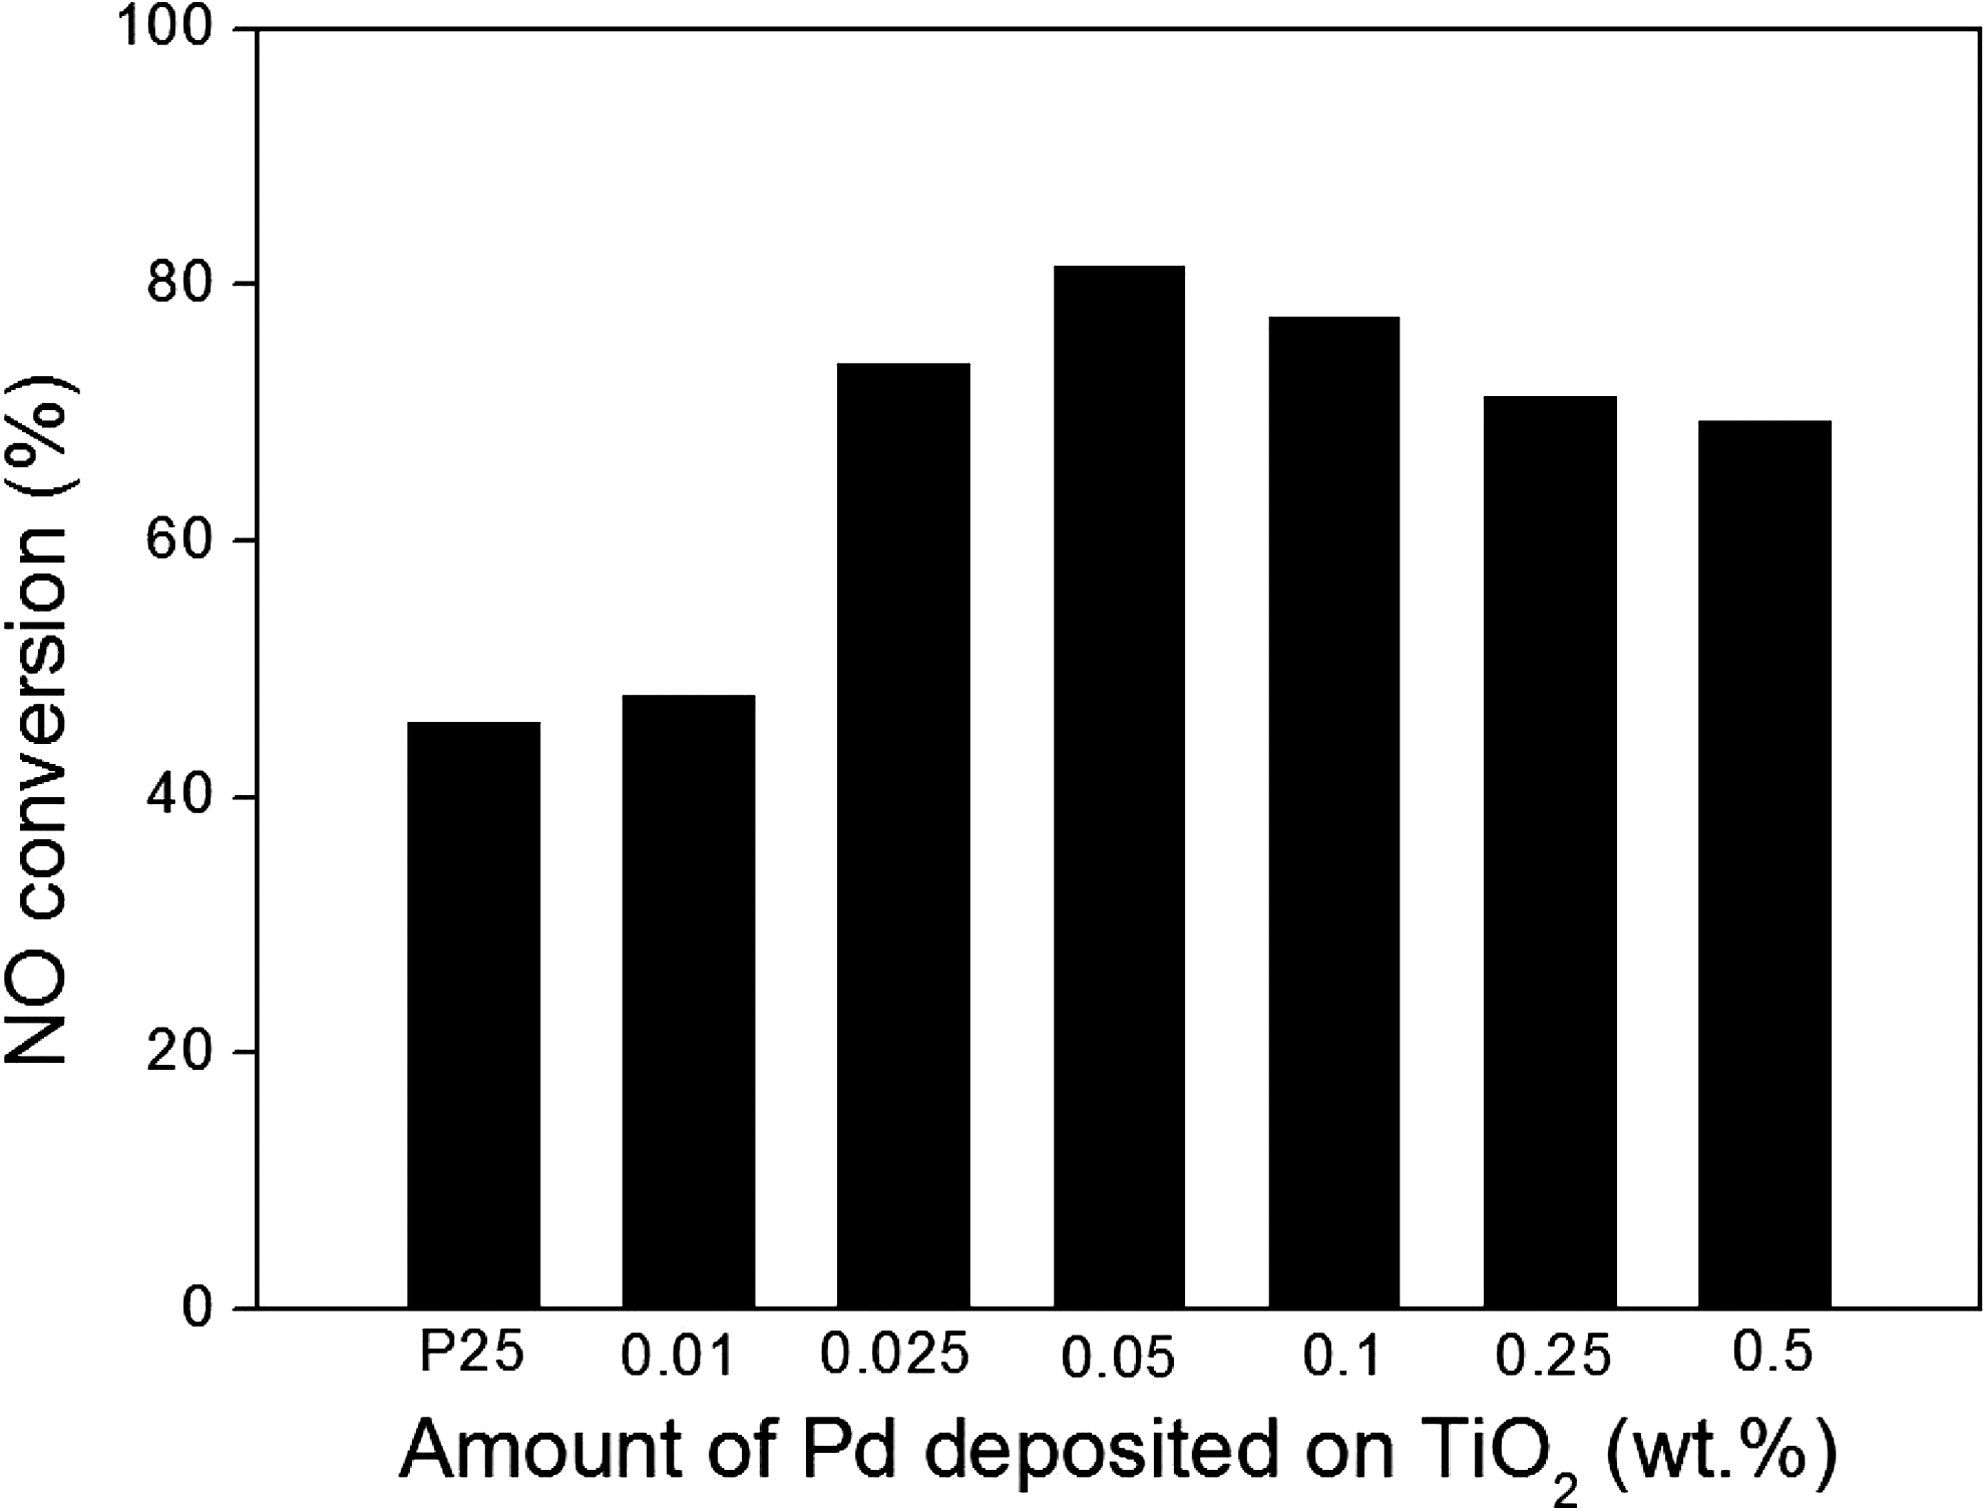
Comparison of different Pd deposited content on TiO2 synthesized by the hydrothermal method and bare Degussa P25 in photocatalytic oxidation of NO after 1200 min of irradiation. Conditions: 125 W Hg-arc, 80°C, 75% relative humidity, 10 s residence time, 21% O2 concentration and 100 ppm initial NO concentration.
Figure 9 shows the NO conversion efficiency of 0.05 wt.% Pd/TiO2 and Degussa P25, using different inlet concentrations of NO. For Degussa P25, the NO oxidation efficiency declined with increasing NO concentrations. Researchers have noted that the reaction rate on Degussa P25 is limited by the Langmuir-Hinshelwood model in which the reaction is first-order at low concentrations and zero-order at high concentrations (Devahasdin et al., 2003; Wang et al., 2007). However, the photocatalytic activity of Pd/TiO2 was good at higher concentrations of NO. The conversion of NO (86.2%) on 0.05% Pd/TiO2 was about 1.81 times that on Degussa P25 (47.5%) at an inlet NO concentration of 85 ppm, while the conversion (65.5%) was about 4.16 times than that of Degussa P25 (15.8%) at 310 ppm. This may be because of increasing adsorption sites for NO on the surface of TiO2 after Pd doping.
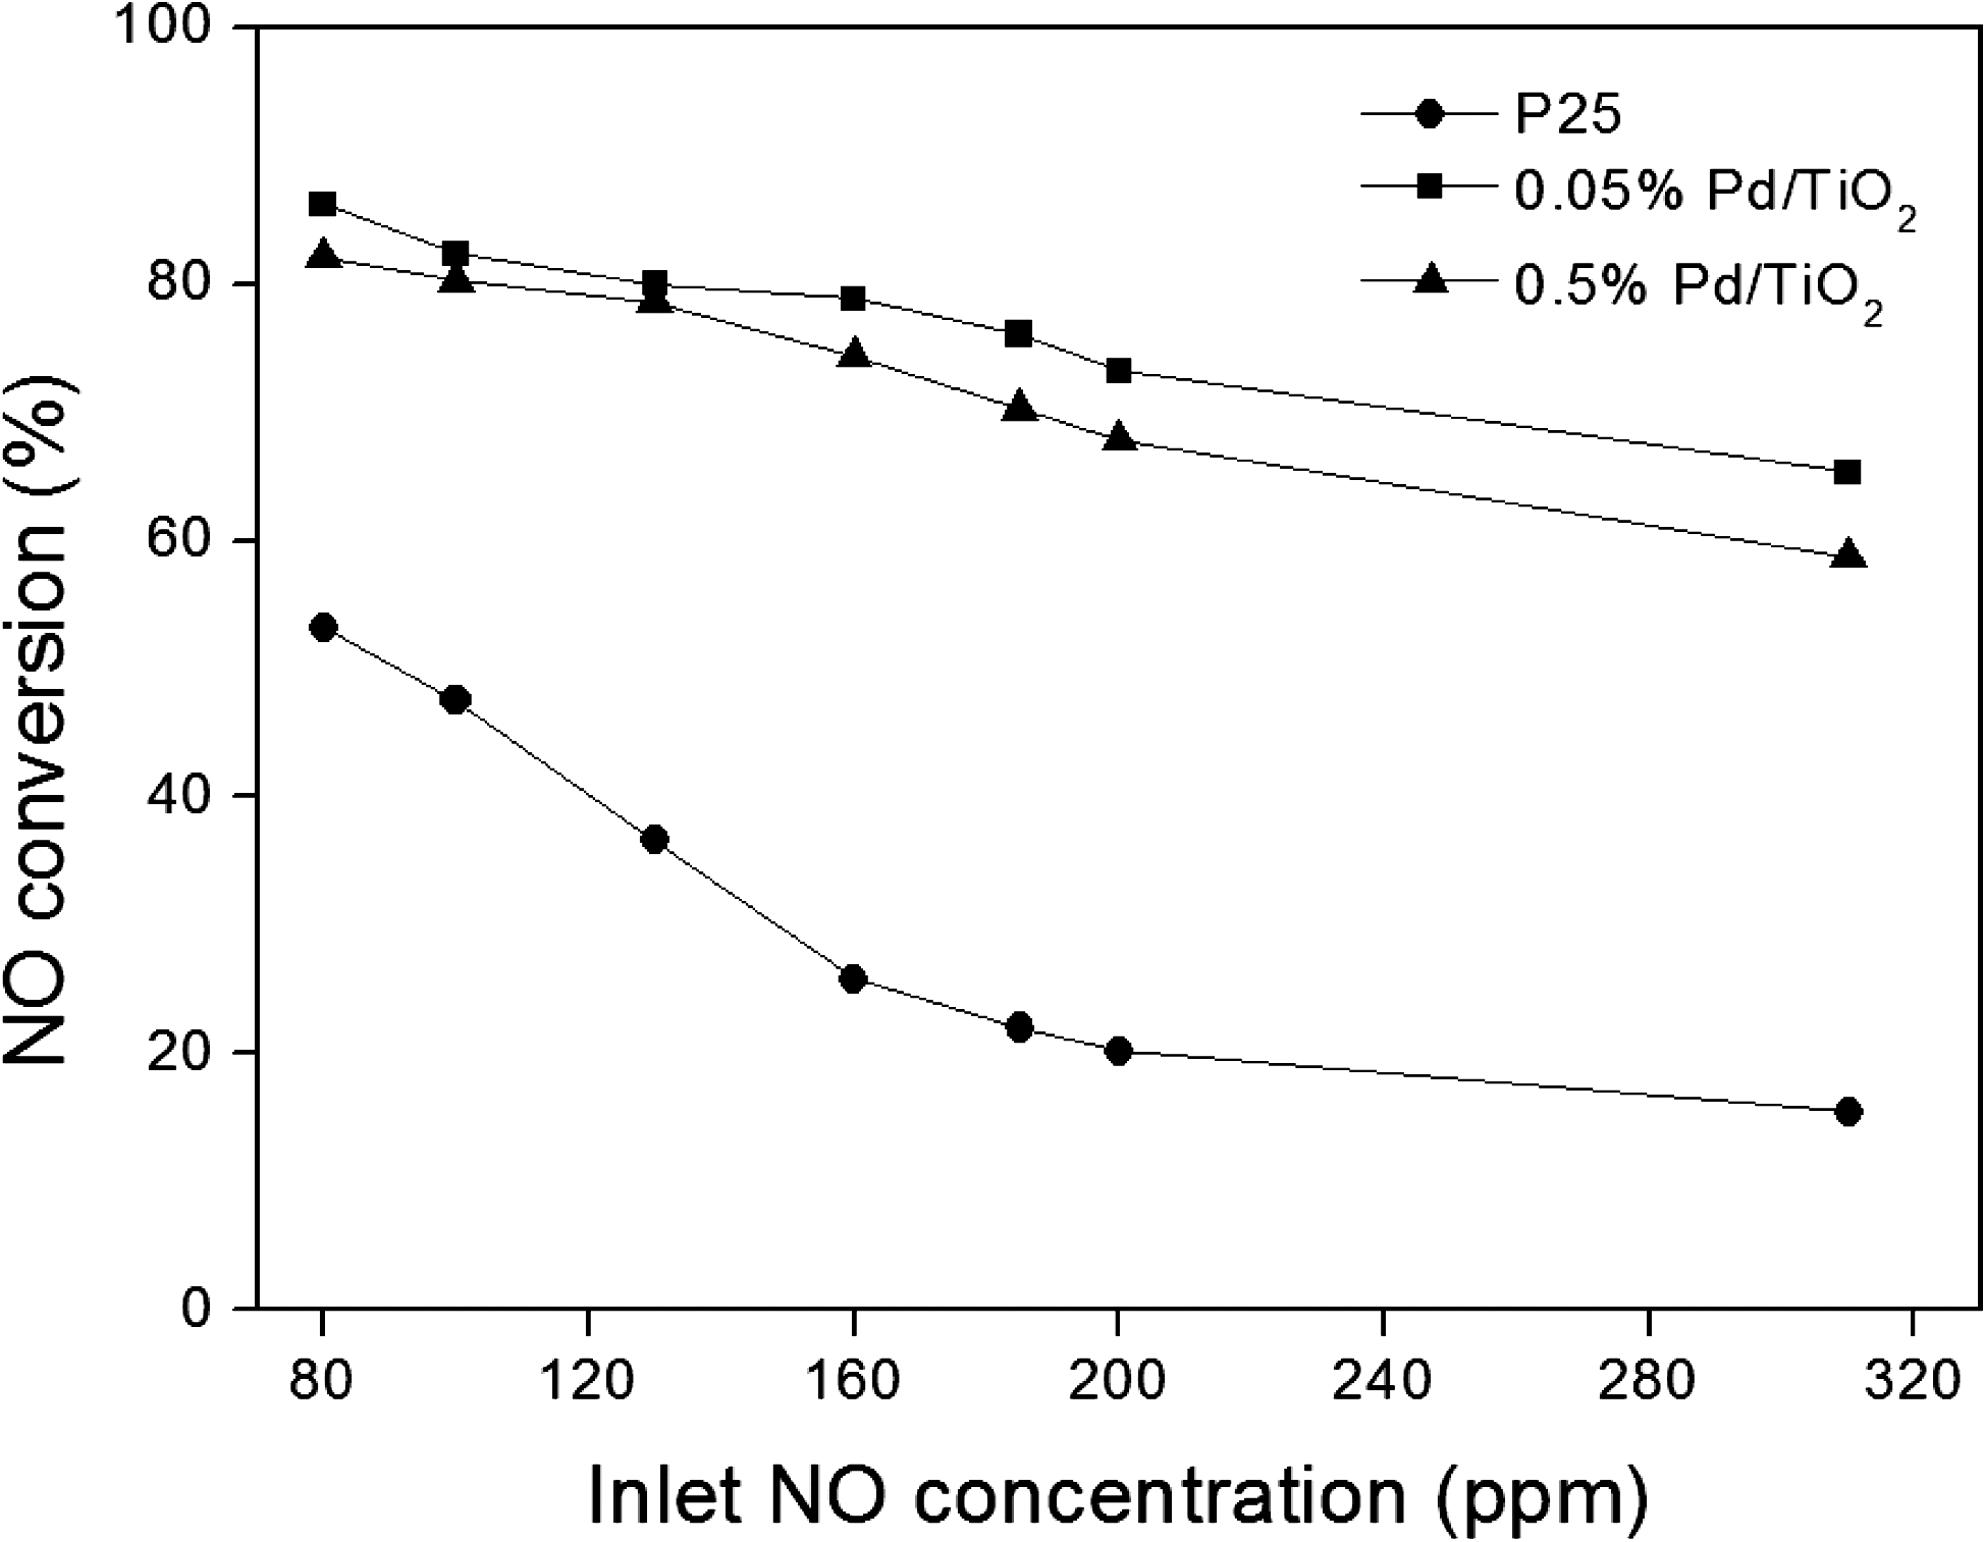
Effect of NO conversion efficiency with initial NO concentration after 1,200 min irradiation using Pd/TiO2 and P25. Conditions: 125 W Hg-arc, 80°C, 75% relative humidity, 10 s residence time, 21% O2 concentration.
Conclusions
In this study, Pd/TiO2 photocatalysts were prepared using a hydrothermal method and employed for the photocatalytic oxidation of NO. Our results showed that the Pd dopant existed as Pd2+ ions, metallic Pd0, and PdO particles in the prepared catalysts. PL spectra indicated that the doping of Pd on TiO2 could inhibit the recombination of photogenerated electrons and holes. The bimodal pore-size distribution of the catalysts benefits rapid diffusion of reactant NO and product NO2 during the photocatalytic reaction and enhances the speed of the photocatalytic reaction. With a Pd dopant content of 0.05%, the concentration of NO could reach 82% with an inlet NO concentration of 100 ppm, which is 72.6% higher than that of Degussa P25. It is concluded that the Pd/TiO2 photocatalysts may be used to oxidize higher concentrations of NO.
Footnotes
Acknowledgments
This work was financially supported by the National High-Tech Research and Development Program (863) of China (2007AA061701), the National Natural Science Foundation of China (50908201), and Changjiang Scholar Incentive Program, Ministry of Education, People's Republic of China (2009).
Author Disclosure Statement
The authors declare that no competing financial interests exist.