




Abstract
Abstract
In the search for methods by which an ambient environment can be continuously monitored for potentially harmful biological aerosols, particle fluorescence methods have received considerable attention over the past decade. The aerosol fluorescence sensor (AFS) is a monitoring device for continuous, real-time detection of airborne biological particles. The AFS method is based on the principle of ultraviolet (UV) light-induced fluorescence targeting the intrinsic fluorescence of common amino acids found in living matter. The sensor uses a UV optical excitation source to illuminate an airstream flowing continuously through the sensor detection volume. Fluorescence from all particles present within the sensing volume is measured using two photomultiplier detectors optically filtered to detect radiation in the UV and visible (Vis) bands, enabling generic discrimination between different aerosol populations. In this study, we investigated the real-time fluorescence characteristics of airborne bacterial particles (Escherichia coli and Bacillus subtilis) and nonbacterial particles (polystyrene latex [PSL] spheres) using an AFS. The UV fluorescence intensity of both bacterial bioaerosols was higher than that of PSL particles at the same total particle concentration. In particular, the ratio of UV- to Vis-fluorescence, which can differentiate between bacterial bioaerosols and PSL particles, was significantly higher for bacterial bioaerosols (E. coli: 5.836; B. subtilis: 6.023; PSL: 4.073). To optimize the AFS, the variation in the fluorescence intensity characteristics was evaluated under various sensor gain settings for the two fluorescence channels and the flash frequency of the excitation light. The amplitude of the measured fluorescence offset and the dynamic measurement range depended on the gain of the system. The coefficient of variance increased with decreasing flash frequency. These experimental results provide basic information about the feasibility of AFS for real-time detection of bioaerosols and may contribute to the development of new bioaerosol detection systems.
Introduction
Due to renewed concerns over biological airborne contaminants, many researchers have investigated methods for detecting airborne microorganisms that do not require long analysis times. A real-time technique for the rapid detection of airborne microorganisms could have numerous applications in public health research, military defense systems against bioterrorism, and other biological and environmental work associated with these microorganisms (Roszak and Colwell, 1987; Pan et al., 2004; Chen and Li, 2007; Jung et al., 2010a), because such a technique would eliminate the traditional time-consuming processes involved in sampling and particle characterization. However, the real-time techniques that have been developed are limited by their inability to differentiate between airborne microorganisms and other types of particles.
Current real-time methods applicable to the detection of bioaerosols can be broadly subdivided into three categories: (1) single-particle Raman spectroscopy (Chadha et al., 1993; Maquelin et al., 2000; Rösch et al., 2005), (2) single-particle mass spectrometry (Stowers et al., 2000; Fergenson et al., 2004; Czerwieniec et al., 2005; Tobias et al., 2005; Van Wuijckhuijse et al., 2005), and (3) particle fluorescence spectrum analysis (Hill et al., 1995; Pinnick et al., 1995; Chen et al., 1996; Nachman et al., 1996; Hairston et al., 1997; Pinnick et al., 1998; Cheng et al., 1999; Pan et al., 1999; Seaver et al., 1999). In addition to the techniques just mentioned, magnetostrictive microcantilevers and quartz crystal microbalances, which are sensitive to specific resonance frequencies, have been investigated for the detection of pathogenic bacteria such as Escherichia coli O157:H7 (Poitras and Tufenkji, 2009), Edwardsiella tarda (Hong et al., 2009), and Salmonella typhimurium (Park et al., 2000; Li et al., 2006).
In particular, fluorescence optical sensors have been used in genuine real-time biodetection in military systems for many years (Hill et al., 1995; Pinnick et al., 1995; Ho, 2002). This strategy was of particular interest, because it allowed optical properties to be measured in parallel with time-of-flight (TOF) and light-scattering measurements, which are used for determining the size, shape, and number concentration of continuous aerosol particles. These devices do not require expensive consumables and are, therefore, cost effective to run for long periods; the principle of “detect-to-warn” requires sensors with fast responses (Kaye et al., 2004). Such a device could act as a trigger to initiate specific tests that may have the disadvantages of high running cost and delayed response. Although the developed systems are optically complex, they can clearly differentiate particles that fluoresce from those that do not. However, they are not perfect; a number of common environmental pollutants, as well as some natural atmospheric components, can be mistaken for microorganisms, because they also fluoresce and may have similar light-scattering properties. Recently, the focus on fluorescence-based optical sensors has been to improve characterization by individual fluorescence spectral analysis. The fluorescence spectrum varies from material to material, and the evidence obtained from laboratory measurements indicates that effective differentiation from likely interferents should be possible with broadband spectral differentiation (Pan et al., 1999; Kaye et al., 2005). There has also been a focus on developing simpler, more robust, and lower-cost real-time sensors for intelligent network deployments.
The aerosol fluorescence sensor (AFS; Biral) system was designed for unattended deployment in medium-to-large area networks as a low-cost prototype bioaerosol sensor based on the principle of ultraviolet (UV) light-induced fluorescence targeting the intrinsic fluorescenceof common amino acids and other components, for example, tryptophan and tyrosine, found in living matter (Jung et al., 2010a, 2011b). The sensor uses a UV optical excitation source at 280 nm (full-width-at-half-maximum=20 nm) to illuminate an airstream flowing continuously through the sensor detection volume. The induced fluorescence is collected and imaged onto two wide-band fluorescence detectors (dual channels), enabling generic discrimination between different aerosol populations (Fig. 1). Although the AFS cannot be used to identify biological particles at the genus and species levels, this fluorescence can be used as an indicator of the content of the sampled aerosol and, in particular, as a discriminator between biological and nonbiological materials.

Operating principle of bioaerosol detection using the AFS. The aerosol is drawn into the system and illuminated by an excitation light source at 280 nm as the particles pass through the detection volume. Induced fluorescence is collected and imaged onto two, wide-band fluorescence detectors, enabling generic discrimination between different aerosol populations. AFS, aerosol fluorescence sensor.
In the present study, we investigated the performance and characteristics of an AFS as well as its ability to distinguish between bacterial bioaerosols and environmental particles. As a first step in demonstrating the feasibility of the AFS for the real-time detection of bioaerosols, we compared UV- and visible (Vis)-band fluorescence intensities of test particles (E. coli, Bacillus subtilis, and polystyrene latex [PSL] spheres) using the AFS under various particle concentrations and evaluated the difference in fluorescence characteristics among test particles, including the ratio of UV- to Vis-fluorescence intensities. Additionally, we investigated how the operation parameters of the AFS, such as sensor gain and excitation light flash frequency, influenced the measurements.
Materials and Methods
Test aerosol particle preparation
Two types of test aerosol particles (bacterial and nonbacterial) were generated to investigate the physical/optical characteristics of test aerosols.
Bacterial bioaerosols were generated using two microorganisms: E. coli (ATCC No. 8739) and B. subtilis (KACC No. 10111). Gram-negative E. coli were chosen to present sensitive bacteria and have been evaluated in numerous microbiological and bioaerosol studies (Palaniappan et al., 1992; Huang and Juneja, 2001; Jung et al., 2009; Lee et al., 2010). Airborne E. coli have been found in indoor environments, and one study suggested that E. coli O157:H7 can be spread in an airborne manner (Varma et al., 2003). Gram-positive B. subtilis are commonly found in a variety of environments and are typical airborne microorganisms used in bioaerosol research, co-existing with Gram-negative E. coli (Agranovski et al., 2003a, 2003b; Jung et al., 2009; Lee et al., 2010). B. subtilis have often been used as test bacterial particles in biological aerosol studies, because they represent microorganisms that are robust against environmental stress (Yao and Mainelis, 2006; Jung et al., 2009).
Each bacterial culture was grown in tryptic soy broth (TSB; Becton Dickinson) and nutrient broth (NB; Becton Dickinson) at 37°C for 18 h (Jung et al., 2009). The bacteria were harvested by centrifugation (5000 g, 10 min). The pellets were washed twice with sterile deionized water (SDW), which was also used to dilute the cells to obtain an optical density (OD) of 0.89–0.91 at 600 nm. A 30-mL aliquot was placed in a one-jet Collison nebulizer (BGI, Inc.). The cell concentration was ∼108 colony-forming units per mL.
PSL particles were used as nonbacterial test particles. A suspension of monodisperse PSL particles (Duke Scientific Corporation) with a 1-μm diameter (similar to that of the test bacteria) was prepared for nebulization. The PSL suspension was obtained by diluting one drop of stock solution in SDW to a concentration in the order of 107 particles/mL.
Aerodynamic particle sizer and AFS measurements
An aerodynamic particle sizer (APS, model 3320; TSI, Inc.) was sampled from the particle mixing chamber, allowing data relating to particle size and concentration to be recorded in parallel with sensor fluorescence data. The APS is capable of measuring the aerodynamic size and number concentration of airborne particles that pass through the sample chamber (Peters and Leith, 2003; Jung et al., 2010b). The APS overlaps two beams from a diode laser with a maximum power of 30 mW and a wavelength of 655 nm, producing one double-crested beam profile. Each particle creates a single, continuous signal with two crests. This signal is recorded and converted into TOF information, which is related to the velocity of the particle as well as its aerodynamic size.
In the AFS, a bulk aerosol sample with an excitation volume of ∼1.3 cm3 is illuminated by a pulse (1 μs) of UV light at 280 nm from a xenon flash lamp; any fluorescence produced is measured as two bands. The short-wavelength band is 305–385 nm (UV band), and the Vis band is 415–550 nm (Vis band). The sensor is arranged with the pulsed xenon excitation source and the photodiode for monitoring the excitation source power positioned on opposite sides of the central scattering chamber. Orthogonal to the axis of the excitation source and the monitor photodiode are two fluorescence detector channels that consist of specific optical filters and a photomultiplier tube module (PMT, R7400U; Hamamatsu Photonics). Any fluorescence produced at longer wavelengths is directed to both the UV and the Vis detection channels via multiple reflections from spherical collection mirrors. Filters within these channels ensure that only the desired wavelength ranges are detected. Under these conditions, the fluorescence signals of sampled airborne particles arise from biochemical molecules produced by all microorganisms. Specifically, common amino acids such as tryptophan and tyrosine produce fluorescence signals in the UV range. Thus, these fluorescent signals can be regarded as characteristics of biological particles (Li et al., 1991; Hairston et al., 1997; Ho et al., 1999). Since the AFS does not provide nominal values for fluorescence intensity from particles in the detection zone, fluorescence intensities can only be evaluated in arbitrary units. The short pulse of light from fluorescence is detected, and the total energy is determined by integration over the emission time period. The AFS is operated with custom software (ASAS+ software; Biral) installed on an external computer. This software provides computer-controlled operation, as well as data interpretation and management. The data is displayed in real time (1 s) as an averaged value. The display comprises three synchronous history plots as a function of time (excitation source power, UV-, and Vis-fluorescence intensity) and various other operational controls.
Experimental methods and measurements
The experimental setup, illustrated schematically in Fig. 2, included two major components: (1) a system for generating aerosols and (2) the AFS and APS aerosol measurement systems. The test particles in liquid suspensions were aerosolized by dry, filtered, and compressed air passing through the nebulizer at a flow rate of 1 L/min. The aerosolized particles then passed through a diffusion dryer to remove all moisture and an electrostatic charge neutralizer (two 210Po radioactive sources, each with an activity of 500 μCi) to minimize the electrostatic removal of particles by the inner surfaces of the test system. After generation, the aerosol streams were diluted with additional airflow to obtain a specific total particle concentration (CN) of about 0.008–3500 particles/cm3. The airflow rate in the nebulizer and the dilution flow were held constant by mass flow controllers (FC-280S; Mykrolis).
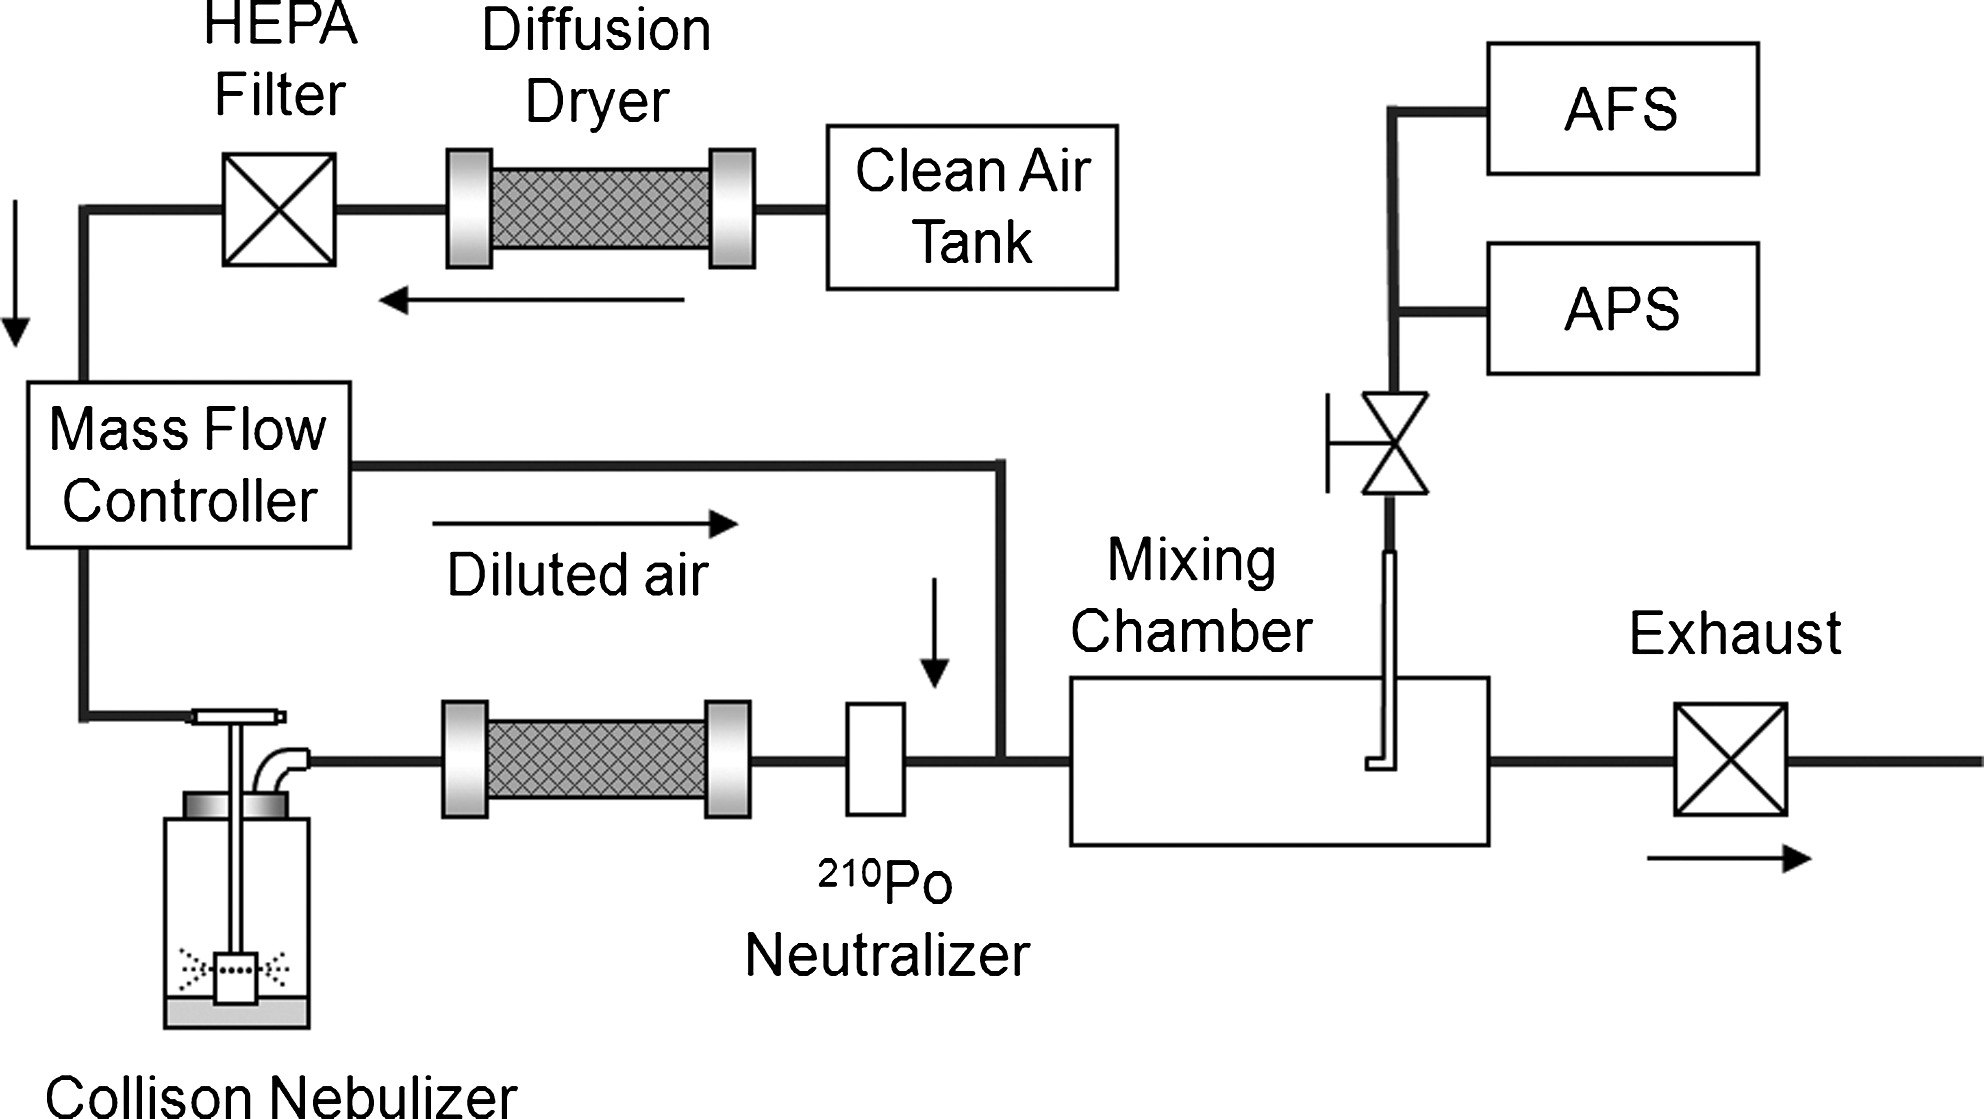
Experimental configuration.
After aerosol generation and dilution, the aerosol stream passed through a sampling chamber for aerosol and fluorescence characteristics measurements. An APS measures two characteristics of each particle in its target size range: aerodynamic size, determined from TOF measurements, and the amplitude of the light scattered by the particle. Simultaneously, the AFS measured the particle fluorescence at the specified excitation wavelength and two emission bands, as just described. Before evaluating the bacterial aerosol using the APS and AFS, each test suspension was prepared at an OD of about 0.5 at 600 nm, and their fluorescence spectra were obtained using an F-7000 fluorescence spectrophotometer (Hitachi) for comparison with AFS data.
Results and Discussion
We evaluated aerosol and fluorescence characteristics of test particles (E. coli, B. subtilis, and PSL) using the AFS at various aerosol concentrations. The geometric mean diameter (GMD) and geometric standard deviation (GSD) were 1.06±0.001 μm and 1.13±0.003 for PSL particles, 0.99±0.002 μm and 1.14±0.002 for E. coli, and 0.84±0.006 μm and 1.16±0.002 for B. subtilis, respectively. Thus, the size distributions of the generated test particles were similar and monodisperse (Table 1).
Measured in the size range of 0.5–20 μm by aerodynamic particle sizer.
Average±standard deviation.
GMD, geometric mean diameter; GSD, geometric standard deviation; PSL, polystyrene latex.
Figure 3 shows the fluorescence intensities (UV and Vis) of E. coli bioaerosols at various particle concentrations between 42 and 3004 particles/cm3. Under all of the experimental conditions, the excitation light remained uniform and stable. However, the fluorescence intensities of both ranges (UV and Vis) increased with particle concentration, and the increasing tendency of UV fluorescence was higher than that of Vis-fluorescence. As shown in Fig. 4, the fluorescence intensities for both ranges did not change below a specific particle concentration. The minimum aerosol concentration for UV fluorescence at which the AFS responded was ∼30 particles/cm3 for all test particles. Below this minimum particle concentration, the default fluorescence intensities of the UV and Vis ranges were ∼140 arbitrary units (a.u.) and 190 a.u., respectively, using the low-gain setting. The amplitude of this offset depends on the gain of the system. This default fluorescence intensity (or fluorescence offset) could be caused by inefficiencies in the AFS optical filters. A small amount of breakthrough of out-of-band wavelengths was evident in both channels, resulting in an offset signal when there was no fluorescence. Additionally, the integration circuitry may also have contributed an electronic offset.
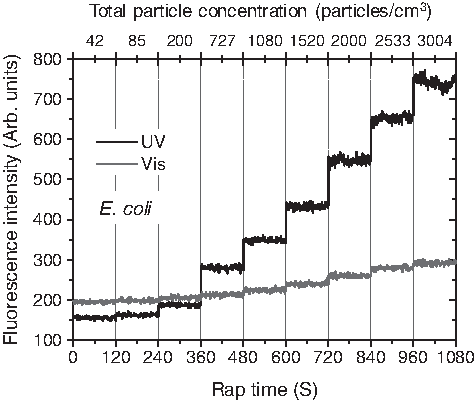
Fluorescence intensities (UV and Vis) of Escherichia coli bioaerosols measured with the AFS at various particle concentrations. UV, ultraviolet; Vis, visible.
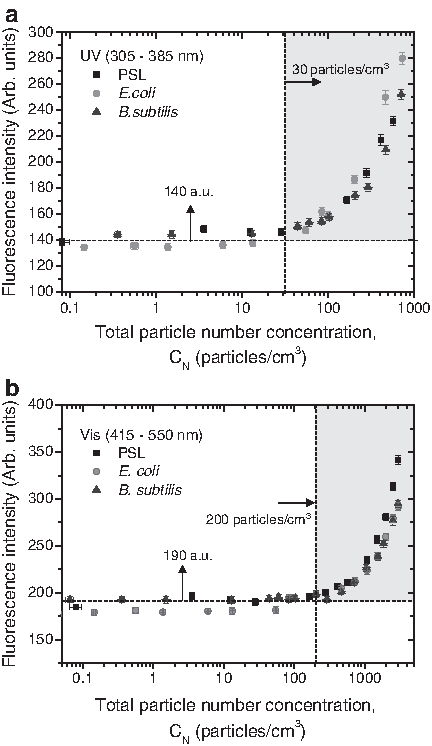
UV- and Vis-fluorescence intensity (arb. units) versus particle concentration (low-gain setting):
Figure 5 shows the ratios of UV- and Vis-fluorescence intensities measured under various test particle concentrations. For the test aerosols, there was a clear separation and strong association among the ratios of UV- to Vis-fluorescence measured by the AFS (PSL: y=4.073x−628.9, R2=0.998; E. coli: y=5.836x−965.4, R2=0.997; B. subtilis: y=6.023x−1011, R2=0.997). The response curves of both E. coli and B. subtilis had significantly higher slopes than that for the PSL particles. The slopes of these curves also represent the ratio of UV- to Vis-fluorescence intensity. For example, the UV-fluorescence intensity (305–380 nm) of PSL was almost 4.1 times higher than the Vis-fluorescence intensity (415–550 nm). However, since the difference between the proportional constants of E. coli and B. subtilis was too low to distinguish between the two, we think that the AFS could not clearly distinguish between E. coli and B. subtilis. Nevertheless, this ratio can be an important parameter for differentiating between bacterial bioaerosols and PSL particles.
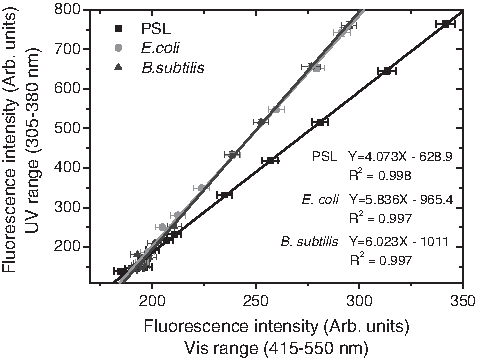
Ratio of UV- to Vis-fluorescence measured at various test particle concentrations.
To investigate the ratio of fluorescence intensities in greater detail, each test suspension was prepared at an OD of about 0.5 at 600 nm, and their fluorescence spectra were obtained using an F-7000 fluorescence spectrophotometer (Fig. 6). Fluorescence ratios were acquired from the integrated fluorescence intensity over each band. When excited at 280 nm, the UV-fluorescence intensity of the test particles was higher than the corresponding Vis-fluorescence intensity. The ratios of UV- to Vis-fluorescence measured with the F-7000 were ∼4.80 (PSL), 27.55 (E. coli), and 30.69 (B. subtilis) higher than those measured by the AFS (Fig. 5). These differences were likely caused by the surrounding environment, which may have contained airborne and/or waterborne contaminants. Additionally, the relative efficiency of the two fluorescence sensor channels and the transmittance of the optical filters may have influenced this result. However, in all cases, the bacterial particles exhibited a higher UV- to Vis-fluorescence intensity than the PSL particles. Therefore, fluorescence intensity information obtained from the two channels of the AFS is useful in discriminating bacterial bioaerosols from atmospheric particles.
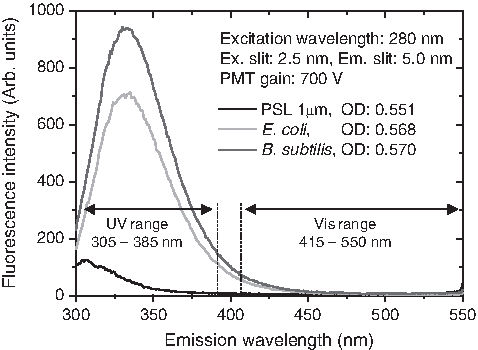
Fluorescence spectra of the test particles obtained using an F-7000 fluorescence spectrophotometer.
Variations in fluorescence intensity using the AFS were evaluated under various sensor gain settings (low and high) for the two fluorescence channels over a range of excitation flash frequencies (1–10 Hz). The amplitude of the measured fluorescence offset and the dynamic range of the measurement depended on the gain of the system. Overall, the signal for high gain was ∼5.8 times higher than that for low gain. The offsets on each channel (UV and Vis) were ∼140 a.u. and 190 a.u., respectively, for the low-gain setting and ∼800 a.u. and 1180 a.u., respectively, for the high-gain setting (Fig. 7). The analog-to-digital converter (ADC) in the AFS had an upper limit of 4095 a.u., which indicates saturation at the ADC and the maximum signal intensity. The dynamic ranges of UV fluorescence intensity for low and high gain were about 3955 a.u. and 3295 a.u., respectively. In Fig. 7, the maximum PSL particle concentration at the high-gain setting of the AFS was ∼2750 particles/cm3. The ideal gain for each test would provide the highest possible sensitivity without the risk of output saturation at 4095 a.u. If saturation occurs at low gain, then the concentration of the sample aerosol should be reduced before it enters the AFS. Generally, low-gain settings are recommended, because they provide the largest dynamic range.
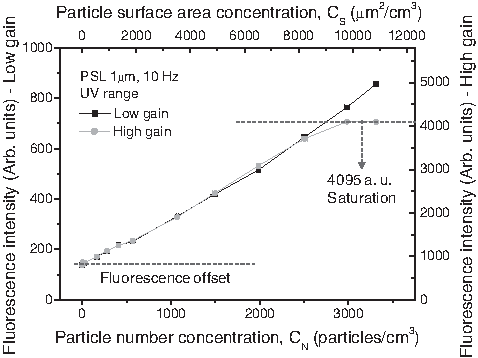
Comparison of fluorescence intensities measured at high and low gain.
The excitation flash frequency can be set to 1, 2, 5, or 10 Hz, depending on the time resolution required for the application. If the fluorescence is unlikely to change significantly over a period longer than 1 s, the lowest frequency is preferred. If changes are anticipated over time scales measured in seconds, the fastest setting should be selected. Data are produced and stored at the selected flash rate. Thus, if 10 Hz is selected, there will be 10 times more data produced than if 1 Hz is used. The coefficient of variance in data measured from 5.54±0.625 (1 Hz) to 2.02±0.120 (10 Hz) decreased with increasing flash frequency. The aerosol detection volume and flow rate determine the overlap between fluorescence readings. In addition, due to the short pulse length of the excitation source, the number of particles interrogated per flash is independent of the aerosol flow rate and is governed solely by the aerosol particle concentration.
Conclusions
Intrinsic fluorescence, which is characteristic of all organisms, can be used to discriminate biological aerosols from synthetic or inorganic particles. The AFS offers promising real-time information for the rapid detection of airborne microorganisms and can be made a part of public health monitoring and military defense against biological attacks. In this study, we demonstrated that the fluorescence characteristics of bacterial bioaerosols, for example, E. coli and B. subtilis, can be differentiated from those of nonbacterial aerosols, for example, PSL spheres, using an AFS. Since environmental aerosols contain a variety of constituent particle types, comparative studies between laboratory and field tests with the AFS will provide valuable information about the real-time detection of biological aerosols in a continuous atmosphere. However, the current sensor design requires some modification in order to improve sensitivity at low aerosol concentrations.
Footnotes
Acknowledgment
This research was supported by the Converging Research Center funded by the Ministry of Education, Science, and Technology (2011K000750).
Author Disclosure Statement
No competing financial interests exist.