
Abstract
Abstract
Use of fluorescence excitation–emission spectroscopy as a complementary tool to evaluate the biological stability of municipal solid waste (MSW) during anaerobic degradation was investigated, and whether correlation between the stability of MSW and fluorescence spectroscopic analysis of leachate can be established. In this study, excitation–emission matrix (EEM) spectra indicated the presence of three different fluorophores, centered at Ex/Em wavelength pairs of α: 250–280/315–350 nm; β: 340–350/400–450 nm; and δ: 420–450/470–530 nm; these fluorophores are attributed, respectively, to protein-like, fulvic-like, and humic-like structures. An exhaustive inventory of all fluorescence emission peaks in EEM and in synchronous spectra obtained at different Δλ and different degradation times was compiled. Correlations were sought between emission peaks (i.e., 280/360, 360/390, 360/470, and 390/430 nm) and standard degradation parameters (i.e., methane [CH4], CO2, total organic carbon, total inorganic carbon, and pH). Strong correlations were obtained between the cumulative volume of CH4 produced during the biodegradation process and peaks at Ex/Em wavelength pairs 280/360 and 360/390 nm, which were identified as indicators for biological stability. Results of this study encourage the use of fluorescence spectroscopy measurements of leachate as a relatively rapid and valuable tool for the industry and research to assess the degree of MSW stabilization during anaerobic degradation.
Introduction
It has been observed that a high biological stability degree is characterized by a high fraction of recalcitrant organic content (Lasaridi and Stentiford, 1998; Tambone et al., 2009). Fluorescence excitation–emission spectroscopy has been reported as a particularly useful technique for the study of dissolved organic matter (DOM) in landfill leachates, because it is a highly sensitive analytical and nondestructive technique (Antunes and Da Silva, 2005), and it may overcome some of the above-mentioned tests. DOM is defined as a continuum of organic molecules of different molecular weights and structures that could pass through 0.45-mm filtration membranes, including low-molecular-weight substances such as amino acids, carbohydrates, and organic acids, and some high-molecular-weight substances such as humic substances (Kalbitz et al., 2000a). According to their hydrophilic/hydrophobic interactions, DOM could be further fractionated into humic acids (HAs), fulvic acids (FAs), and hydrophilic fractions (Christensen et al., 1998). Studies on the characterization of the evolution of DOM in landfill leachate are still scarce in the literature. Kang et al. (2002) used fluorescence spectroscopy to study the extracted HA and FA from landfill leachates of different ages in comparison to commercial HA. Baker and Curry (2004) used fluorescence spectroscopy as a sensitive tracer of groundwater contamination with leachate and as a tool to discriminate leachates from different landfill sources. Zheng et al. (2007) and Shao et al. (2009) used fluorescence spectroscopy to characterize the distribution of phthalic acid esters in DOM fractions of leachates from sanitary or bioreactor landfills and the evolution of water-extractable organic matter during the biostabilization of MSW before landfill, respectively. Thus, the aim of this article was to evaluate the use of fluorescence excitation–emission spectroscopy as a complementary tool to evaluate the biological stability of MSW during anaerobic digestion, and whether correlations between the stability of MSW and fluorescence spectroscopic analysis of leachate can be established.
Materials and Methods
Two experimental conditions were tested in triplicates using laboratory-scale anaerobic bioreactors (Boulanger et al., 2012). The standard bioreactors (reactor type B1) comprised MSW, while the amended bioreactors (reactor type B2) comprised reconstituted MSW amended with landfill leachate used as an inoculum to enhance the methanogenesis potential (Boulanger et al., 2012). Reactors were incubated at 35°C±2°C for the duration of the test without mixing, which has been reported as optimal temperature (Lee et al., 2009).
MSW and landfill leachate
Samples of MSW were dried at room temperature and then shredded to ∼20 mm (for homogenization purposes). Waste composition was defined according to the French average waste composition France (ADEME, 1999) (Table 1). Leachate was collected from Vert le Grand Landfill (Paris, France).
Reactors' design
One-liter glass bioreactors were used to provide closely monitored and controlled conditions. These fully enclosed bench-scale bioreactors stood vertically, and each held 26.85 g of dry reconstituted solid waste (40 g wet mass) and 680 mL of carbonate buffer solution (i.e., 6 mL of 0.151 M sodium bicarbonate and 1.6 mL of 0.032 M potassium carbonate in 1 L of deionized water). The buffer solution was prepared in a way to provide enough carbonates for buffering a volatile fatty acid (VFA) accumulation of 0.1 M and to keep final Na+ and K+ concentrations lower than the inhibition threshold values of 8 and 12 g/L, respectively (Kugelman, 1965). To simulate anaerobic conditions, a 330-mL headspace was maintained in each bioreactor achieved by flushing the bioreactors with helium until the O2 concentration dropped below 0.5%. Type B1 reactors each held 40 g of wet waste, 680 mL of buffer solution, 330 mL headspace. Type B2 reactors were prepared as B1 and further contained 9.5 g of inoculums (a residual fraction of centrifuged leachate, which resulted from 500 mL of leachate being centrifuged at 9676 g for 20 min).
Physicochemical analyses
Gas production and composition
Biogas production was measured twice a week directly in the headspace of every bioreactor, using a manometer equipped with a needle (Merical, 0–2000 mbar) that was injected via the septum into the bioreactors. Biogas concentration was monitored by gas chromatography (GC). Due to the sensibility of the gas chromatograph to high pressure, following every measurement, the headspace of every bioreactor was equilibrated to atmospheric pressure.
A Varian CP-4900 micro-GC equipped with four parallel chromatographic columns coupled with thermal conductivity detectors was used for the analysis. A Poraplot U column was used to monitor CO2, N2O, and H2S concentrations (column temperature 30°C, injector temperature 50°C, medium sensitivity), and a molecular sieve column was used to monitor O2, N2, and CH4 concentrations (column temperature 55°C, injector temperature 55°C, medium sensitivity, back flush 5.5 s). The carrier gas was helium. For quality control/quality assurance, the gas chromatography was calibrated with a commercial gas mixture containing 0.5% H2S, 3% N2O, 40% CO2, 50% CH4, and 6.5% N2 (Air Products). Furthermore, O2 was calibrated with air. The detection limit for all gases was below 0.1% (Vigneron et al., 2006).
Leachate analysis
After biogas sampling, homogenized leachate samples (4 mL) were recovered through the septum with a syringe fitted with a 0.45-mm needle. As the working liquid volume was 680 mL at the beginning of the experiment, the volume modification was <1% for each sampling event, and the system perturbation due to these samplings was assumed to be negligible. Immediately after sampling, the pH of leachate was measured (Mettler Inlab 427 probe). Leachate samples were then split into two aliquots of 2 mL each: aliquot A and aliquot B. Aliquot A was stored at −20°C for posterior analysis. Aliquot B was centrifuged at 9676 g for 20 min, and then the supernatant and pellet were separated. Total organic and inorganic carbon (TOC and TIC) analyses of the leachate of aliquot A and supernatant of aliquot B were measured using a BIORITECH700 analyzer. The weight of the pellet was also recorded. A carbon mass balance was then computed using the following equations:
Fluorescence spectroscopy
For fluorescence spectroscopy analysis purpose, 20 μL of leachate was collected from each bioreactor, filtered using 0.45-μm glass fiber filters grade (GFC), and then diluted in 2 mL of buffer solution (0.01 M monosodium phosphate [pH 6.8]). The adjustment of pH at 6.8 was particularly important to avoid an extended disruption of inter- and intramolecular hydrogen bonds, which could result in a decreased particle association and decoiling of macromolecular structures (Miano and Senesi, 1992; Mobed et al., 1996).
A SAFAS Monaco SP-2000 computer-controlled spectrofluorimeter (SAFAS, flx, version 6.7.0.6 Monaco) was used for fluorescence analyses at room temperature (20°C±2°C). Fluorescence spectra were recorded, using a 2-mL quartz cuvette. Total luminescence or three-dimensional fluorescence or excitation–emission matrix (EEM) mode was generated at excitation and emission slit widths of 5-nm band pass. EEM fluorescence spectra were collected for excitation wavelength from 250 to 600 nm at sequential 10-nm increments of excitation wavelength. These spectra were operated under conditions of 700 V photomultiplier voltage and of 0.04 s scan time.
After the analysis of EEM of each sample was completed, different Ex/Em intervals were selected for synchronous scanning: Δλ 18, 35, 65, and 90 nm. The synchronous-scan excitation was measured by simultaneously scanning both the excitation (ranging from 250 to 600 nm) and the emission wavelengths while keeping in every scan a constant wavelength (Δλ=λem−λexc=18; 35; 65; and 90 nm). Corrections by subtracting the blank were done. To eliminate potential inner filter effects, the absorbance of samples in the ultraviolet–visible light spectrum was always lower than 0.1 at 254 nm in a 10-mL volumetric flask (Alberts and Takács, 2004). For all fluorescence analyses, 5-nm slit widths were maintained on excitation and emission monochromators. A comparative discussion on the spectra obtained in this study was acceptable, at least on a qualitative basis, since all of them were recorded on the same instrument, using identical experimental conditions.
Statistical analyses
To check the degree of correlation between the parameters (cumulative production of CH4, CO2, and biogas) and fluorescence ratios, a Spearman correlation test was conducted using a Statistical Package for Social Sciences software package (SPSS v. 11.5 for Windows).
Results and Discussion
Monitoring the evolution of physicochemical parameters
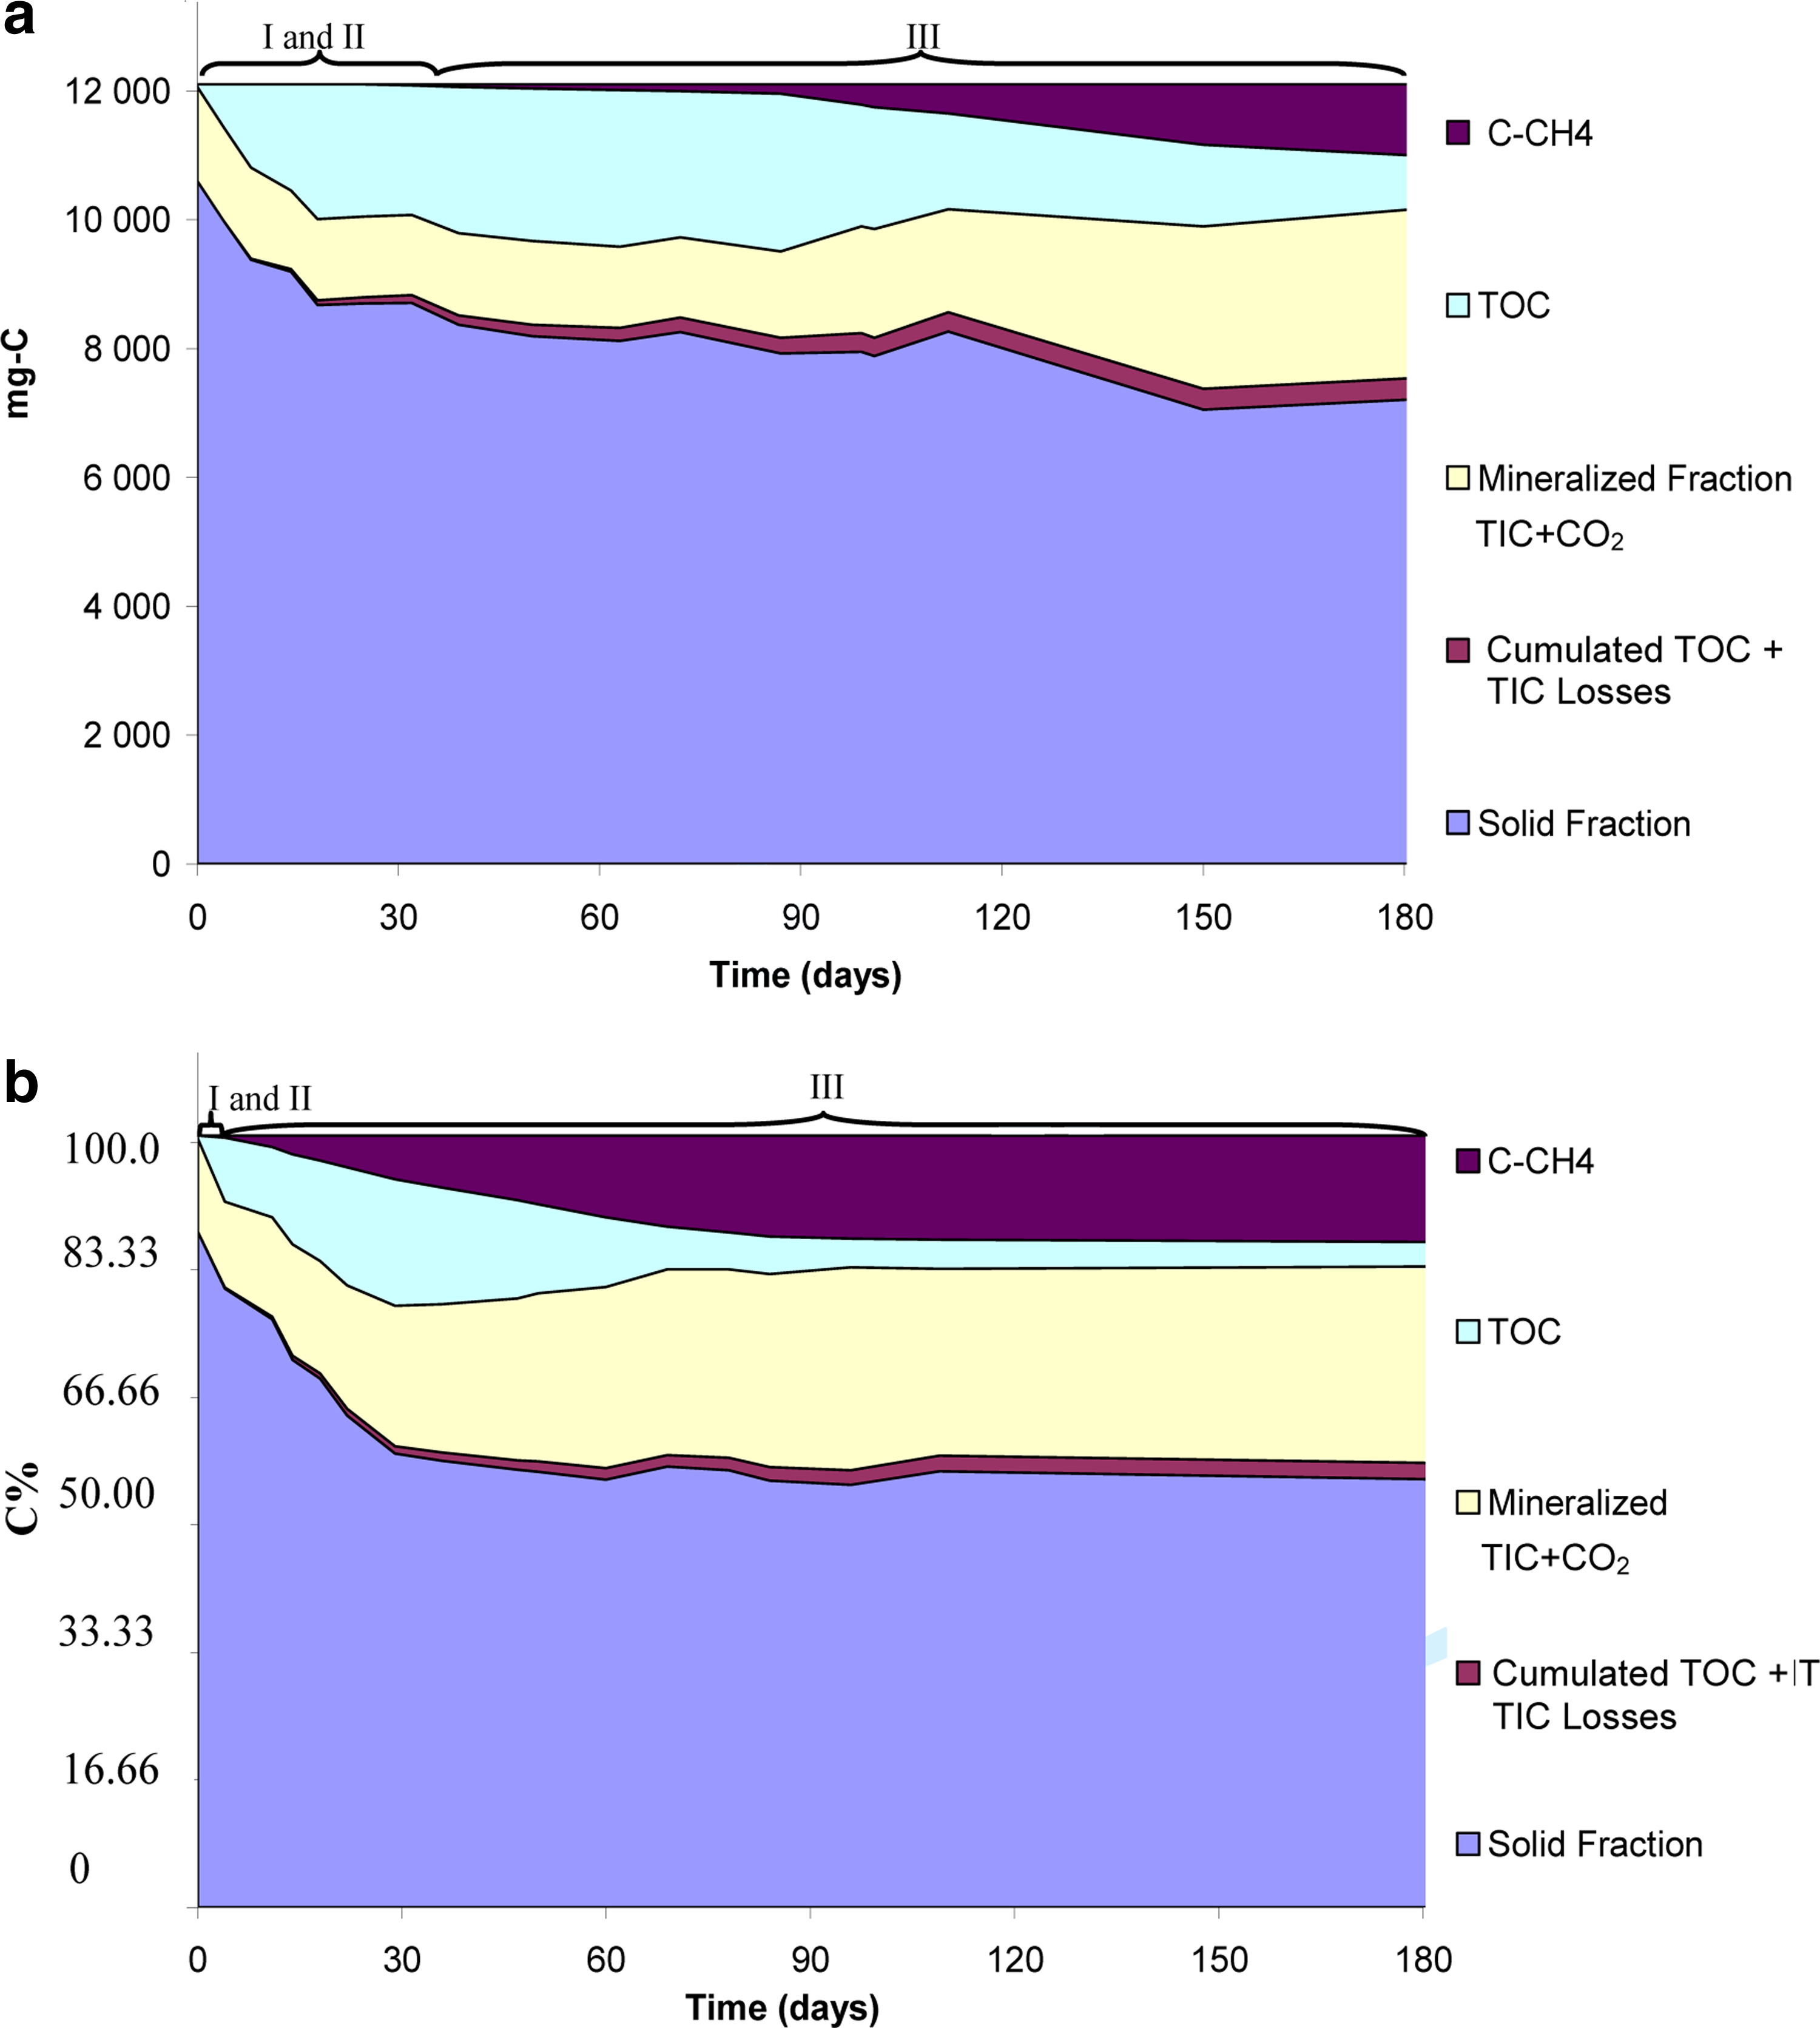
The anaerobic degradation of MSW was investigated using a laboratory-scale approach. Temporal profiles of organic carbon as CH4, TOC, mineralized fractions (TIC+CO2), cumulative losses (TOC+TIC), and organic fraction are summarized in Fig. 1, and correlate well with typical anaerobic degradation patterns of waste (Barlaz et al., 2002; Vigneron et al., 2006; Qu et al., 2009; Tallec et al., 2009). A simultaneous decrease in the mass of carbon in the solid fraction and an increase of TOC, TIC, and CO2 in both bioreactors, type B1 and type B2, was observed. This trend occurred during a phase that corresponded, according to previous studies (Barlaz et al., 1989, 2002), to the hydrolysis phase. Then, the acidogenic phase started and pH decreased from 8.38 to 7.18 and to 7.14 in bioreactors B1 and B2, respectively, after 8 days of anaerobic degradation. The reduction of pH can be due to the accumulation of acidic fermentation intermediates, or the liberation of VFAs (Barlaz et al., 2002). In the present study, the fermentative phase (I and II in Fig. 1) that involved hydrolysis and acidogenic phases lasted ∼20 and ∼10 days in bioreactors B1 and B2, respectively. During phase I, CO2 concentrations were above 80% and 70% for bioreactors B1 and B2, respectively. These conditions led to the development of an acetogenic population during the second phase defined as acetogenic phase (II in Fig. 1). The main product during this phase, which is the acetate, contributed to the CH4 production (Barlaz et al., 2002). In the present study, the beginning of the methanogenic phase (III in Fig. 1) was marked by the production of CH4, which was first detected at day 30 for bioreactor B1, and earlier, at day 5, for bioreactor B2. Furthermore, during the methanogenic phase, leachate pH increased in bioreactor B1 from pH 7.18 to pH 7.64 and in bioreactor B2 from pH 7.14 to pH 8.05 after 223 days of anaerobic degradation (Table 2), which can be due mainly to the consumption of VFAs by methanogenic microbial populations. Previous studies indicate that the methanogenic phase coincides with an increased pH and a more rapid consumption of organic matter due to the promotion of methanogenic microbial activity (Boni et al., 2006). A marked increase of CH4 production in this study in reactors after the onset of the methanogenic phase was observed (Fig. 1). In fact, bioreactors B2 amended with centrifuged leachate resulted in a production of CH4 of 76 L/kg after 223 days (at standard temperature and pressure, representing thus 76% of total biogas), in comparison with a production of CH4 of 50 L/kg after 186 days (at standard temperature and pressure, representing thus 66% of total biogas) in bioreactors B1 (Fig. 1).
Carbon distribution in anaerobic bioreactors B1
Fluorescence spectroscopy
Characterization of the different fluorescence centers by EEM
Contour EEM spectra were used to investigate the organic matter composition of leachate samples. Contour EEM spectra of leachate samples from bioreactor B2 indicate the presence of three different fluorophores (named α, β, and δ, respectively), each characterized by and an Ex/Em wavelength pair (λEx/λEm) (Fig. 2). Similar spectra were obtained for bioreactor B1 (data not shown). The location of EEM fluorophores in this study was compared with the location of EEM fluorophores reported in the literature. Fluorophore α defined by a maximum λEx/λEm within the range 250–280/315–350 nm fell in a region defined by shorter excitation wavelengths (>280 nm) and shorter emission wavelengths (<350 nm). This peak coincided with peaks typical of aromatic protein region such as tryptophan (Shao et al., 2009). Peaks in this region characterized by λEx/λEm 210–230/340–360 nm (Huo et al., 2008) and at λEx/λEm 275–280/350–360 nm (Baker and Curry, 2004) and related to landfill leachate have been previously reported (Coble, 1996; Baker and Curry, 2004; Huo et al., 2008; Shao et al., 2009). Furthermore, the presence of peaks at λEm 293–351 nm in samples containing DOM of aquatic origin has been also reported, which corresponds to protein-like fluorophores (Yamashita and Tanoue, 2003). Then, it is suggested that the presence of this fluorophore is due to the presence of proteins, and particularly tryptophan-like amino acids. To confirm whether fluorophore-α in this study related to a protein-like fluorophore, bovine serum albumin was analyzed, and the EEM spectra confirmed the presence of one fluorophore that coincided with the protein-like fluorophore in the spectra of leachates from bioreactors B1 and B2. Fluorophore β defined by a maximum λEx/λEm within the range 340–350/400–450 nm fell in a region defined by longer excitation wavelengths (>280 nm) and longer emission wavelengths (>380 nm) related to FA-like organics (Antizar-Ladislao et al., 2006). Accordingly, it has been previously reported the presence of a distinctive and intense fluorescence peak at λEx/λEm 320–340/400–440 nm in landfill leachate that was attributed to aromatic and aliphatic groups in the DOM fraction and commonly labeled as FA-like (Baker and Curry, 2004; Zheng et al., 2007; Huo et al., 2008). To confirm whether fluorophore β in this study related to an FA-like structure, Suwanee River FAs were analyzed, and the EEM spectra confirmed the presence of one fluorophore (β) with extension (β′) that coincided with the FA-like fluorophore in the spectra of leachates from bioreactors B1 and B2. Fluorophore δ defined by a maximum λEx/λEm within the range 420–450/470–530 nm fell in the region of longer excitation wavelengths (>280 nm) and longer emission wavelengths (>380 nm) related to HA-like organics. Previously, the existence of two regions in the EEM located at λEx/λEm 265–525 nm and at λEx/λEm 360–520 nm has been reported by Sierra et al. (2005), who investigated EEM maps of HAs from different origins.

Excitation-emission matrix (EEM) spectra of leachate from bioreactor B2 at day 0
Selection of different synchronous single-scan modes
The synchronous technique consists of varying simultaneously both excitation and emission wavelengths while keeping a constant wavelength interval Δλ between them (Senesi et al., 1989). Because of the molecular complexity and heterogeneity of DOM, and particularly humic substances, the selection of various Δλ allows the reduction of superimposition interferences and the achievement of the spectral separation of the fluorescence signals into individual components (Senesi et al., 1989). Synchronous spectra with Δλ of 18, 35, 65, and 90 nm were obtained by fitting the mathematical equation λ emission=λ excitation+Δλ to the EEM profiles of leachates from bioreactors B1 and B2 (Fig. 3). According to Senesi et al. (1989), Δλ=18 nm is an efficient wavelength difference that provides the best resolution. Indeed, four lines were traced diagonally on the contour EEM spectra (Fig. 2b): each one corresponding to a spectral range scanned by the synchronous mode, with Δλ values of 18, 35, 65, and 90 nm. Across these lines, the shape of the corresponding synchronous spectrum became more comprehensible and simpler. At each Δλ, spectra from initial and final stages, after 186 and 223 days of anaerobic treatment, respectively, of both bioreactors were very similar. Moreover, emission intensity-versus-wavelength profiles for Δλ=18 nm and Δλ=35 nm, which covered fluorophores α, β, and δ, followed similar trends. Emission intensity-versus-wavelength profiles for Δλ values of 65 and 90 nm, which covered fluorophore β, also followed similar trends among them. As Δλ=18 nm was closer to the Raman band of water, the spectral characteristics of Δλ35-nm scanning modes were preferred to provide information related to the qualitative composition of leachate samples. Additionally, it was suggested that the spectral characteristics of the Δλ90-nm scanning mode were preferred to provide information related to the quantitatively composition of humic substances and particularly FA structures.

Synchronous spectra of dissolved organic matter of leachates from B1 at day 0 and day 186 and B2 at day 0 and day 223 at different Δλ 18, 35, 65, and 90 nm.
Figure 3 also indicates the presence of emission intensity peaks at λ=280, 360, 390, 430, and 470 nm. A notorious effort to identify compounds responsible for each peak in synchronous mode is reported in the literature (Senesi et al., 1989; Kalbitz et al., 1999; Cilenti and Senesi, 2005; Sierra et al., 2005; Ait Baddi and Hafidi, 2008). It has been observed that fluorescence of nonhumic substances is more pronounced at shorter rather than at longer wavelength (Kalbitz et al., 2000b). Thus, according to previous studies, peaks at 280 nm are attributed to protein-like structures; peaks at 360, 390, and 400 nm are attributed to FA-like structures; and peaks at 470 nm are attributed to HA-like structures. The results obtained in this study using synchronous single-scan mode, as those obtained using contour EEM, confirmed the presence of these protein-like, FA-like, and HA-like structures in leachate samples from bioreactors B1 and B2.
The analysis of the evolution of the maximum peak intensity on the different synchronous spectra allowed the observation of a shift from longer to shorter wavelengths within the increase of Δλ from 18 to 90 nm. In this respect, Miano and Senesi (1992) attributed the shift of the fluorescence maxima to shorter wavelengths with increasing Δλ to the greater extent of polycondensation and occurrence of diffuse intermolecular hydrogen bonds, corresponding to low-energy absorbing centers. This polycondensation was the result of the humification process during degradation that can be monitored by different emission intensity ratios (280/360, 360/390, 360/470, and 390/430 nm) calculated from synchronous spectra of leachate samples from bioreactors B1 and B2 at different Δλ. In this respect, Kalbitz et al. (2000b) proposed to use some emission intensity ratios (355/390 nm for DOM and 360/400, 360/470, and 400/470 nm for FAs) as humification indices. In the present study, the evolution of these ratios during the anaerobic degradation of MSW in bioreactors B1 and B2 highlighted the decrease of ratios 280/360 and 360/390 nm and the increase of ratios 390/430 and 360/470 nm (Fig. 3). This evolution might be explained by the decrease of the protein-like structures and the increase of FA-like. As HAs result from FA polycondensation, the increase of HA/FA ratios (390/430 and 360/470 nm) suggests that polycondensation may have occurred. This study provides evidence of polycondensation and humification of DOM during the anaerobic degradation of MSW in bioreactors B1 and B2 in this study.
Dynamics of the different fluorophores during the degradation process
Contour EEM spectra were also used to investigate the temporal dynamics of fluorophores during anaerobic degradation of MSW. It was observed that fluorophore α, related to protein-like structures, was more prevalent during the acidogenic phase in both bioreactors B1 and B2. In fact, the maximum fluorescence intensity of fluorophore α was recorded after 25 days of continuous anaerobic treatment in both bioreactors. These suggest that the earlier onset of methanogenesis in bioreactor B2 had little influence on protein hydrolysis kinetics. After the onset of methanogenesis, the corresponding fluorescence intensity of fluorophore α progressively decreased. A different temporal trend was observed when fluorophore β, related to FA structures, was monitored. The fluorescence intensity of fluorophore β progressively increased after the beginning of methanogenesis, reaching their maximum level during the second half of the active CH4 production phase, which could confirm the important polycondensation and humification of leachate samples, particularly in bioreactor B2. These results were in accordance with those reported by Huo et al. (2008), who explained that the change of peak locations and fluorescence intensity might be ascribed to an increase of molecular size, aromatic polycondensation, level of conjugated chromophores, and humification degree of organic matter as the degradation time in landfill increased. Before the end of the methanogenic phase, the fluorescence intensity of fluorophore β decreased in both reactors. This was followed by an increase of the fluorescence intensity of chromophore δ, related to humic-like acids. Similarly, Shao et al. (2009) reported that the FA-like compounds decreased when MSW reached stability. They suggested also that the FA, an easily broken down fraction, transformed into high levels of stable structures through bio-oxidation. These authors explained that FA changes involved the decrease of polysaccharides and the production of structures incorporating more aromatic compounds and aliphatic polyesters/ethers. On the other hand, the groups containing aromatic and carboxylic groups increased, while polysaccharides and other aliphatic structures degraded resulting in HA structures of higher aromaticity. During the present study, the fluorophore δ exhibited only limited variations in intensity, so that no clear trend was observed. This could be due to the early stage of humification of leachate. In this respect, some studies concerning leachate characterization at landfill scale (Kang et al., 2002) demonstrated that humic substances from these leachates were in an early stage of humification, and the degree of humification increased as the age of the landfill increased. Furthermore, other authors (Calace et al., 2001) explained that, unlike old leachate that presents complex structures formed by condensed nuclei of carbons substituted by functional groups containing N2, sulfur, and O2 atoms, young leachate had a low molecular weight characterized by linear chains substituted by oxygenated functional groups such as carboxyl and/or alcoholic groups. The evolution of the fluorophores during different stages of degradation highlighted that the maximum fluorescence intensity related to FA-like structures was reached after 37 and 137 days of anaerobic degradation of MSW in bioreactors B2 and B1, respectively. This indicates that the addition of leachate in bioreactor B2 enhanced methanogenic mechanisms of degradation, by shortening the lag phase before the onset of methanogenesis and improving the methanogenesis rate.
Correlation analysis of fluorescence-emission characteristics and cumulative biogas production
Indicators of stabilization of the anaerobic process were sought. For that purpose, an exhaustive inventory of all fluorescence emission ratios obtained in the EEM mode at different Δλ in a synchronous-scan mode was compiled. All combinations of ratios between the obtained peaks (280/350, 360/390, 360/400, and 360/470 nm) were calculated for each Δλ at three different stages of biodegradation (initial, intermediate, and final stage) and for both bioreactors B1 and B2. Additionally, cumulative volumes of biogas CO2 and CH4 were also compiled. Then, a Spearman correlation analysis was conducted.
An initial test identified main correlations, which were used to conduct further correlations, including information related to intermediary stages of degradation, by using another two type-B2 bioreactors and two type-B1 bioreactors (4n=40 stages studied). A strong correlation between the ratio 280/360 nm (FA/Proteins) at Δλ values of 65 and Δλ90 nm and the cumulative volume of CH4 (r=−0.60, p=0.001; r=0.72, p=0.002, respectively) was identified (Table 3). Similarly, the ratios 360/470 nm (FA/HAs), 360/390 nm (FAs/FAs) at Δλ=90 nm correlated well to the cumulative volume of CH4 (r=0.75, p=0.000 and r=0.72, p=0.000, respectively). The ratio 390/430 nm (FAs/FAs) at Δλ=18 nm correlated well to the cumulative produced volume of CO2 (r=0.64, p=0.002). The ratio 360/390 nm (FAs/FAs) was negatively correlated to both the cumulative produced volume of CO2 and of CH4 at Δλ=65 nm (r=−0.62, p=0.000 and r=−0.74, p=0.000, respectively) (Table 3). Since the acidogenic phase is characterized by an important production of CO2 (Barlaz et al., 1989, 2002), a strong correlation between the cumulative volume of CO2 and the ratio 390/430 nm at Δλ=18 nm suggested that this ratio could be used as an indicator of the acidogenic phase evolution at Δλ=18 nm. Similarly, the ratios 280/360 nm at Δλ values of 65 and 90 nm and 360/390 nm and 360/470 nm at Δλ=90 nm could be both used to assess the evolution of the methanogenic phase. Finally, results from this study suggested that ratios 280/360 nm (FA/Proteins) at Δλ values of 65 and 90 nm and ratio 360/470 nm (FA/HAs) at Δλ=90 nm could be used as indicators of humification and waste stabilization.
CH4, methane.
Conclusions
The biological stabilization of MSW for two bioreactors with (B1) and without (B2) residual fraction of centrifuged leachate in anaerobic conditions in laboratory was assessed monitoring using a physicochemical approach (i.e., TOC, TIC, CO2, and CH4) and fluorescence spectroscopy approach (i.e., EEM and synchronic scan modes). Physicochemical results highlighted the role that biomass inoculation played to shorten the lag phase before the onset of methanogenesis. The use of fluorescence spectroscopy in the mode EEM confirmed the aforementioned results and further indicated that the use of Δλ=35 nm was the most contrasted and informative indicator to provide information related to protein-like and humic-like substances fluorophores and their temporal evolution. Δλ=90 nm seemed to be more informative only about humic-like substances and especially about fulvic-like acid structures. The calculation of some ratios from the peaks obtained in the synchronous spectra (280/350, 360/390, 360/400, and 460/500 nm) confirmed the decrease of the protein-like structures and the increase of FA-like during anaerobic degradation, and an increase of humification of MSW in bioreactor B2. Due to the strong correlation between the cumulative volume of CO2 with 360/400 nm ratio at Δλ values of 18, 65, and 90 nm and CH4 with 280/350 and 360/390 nm ratios at Δλ values of 18, 35, 65, and 90 nm, these ratios could be considered as an indicators to assess the stability of MSW after anaerobic degradation. Overall, the characterization of stability of anaerobically treated MSW by fluorescence spectroscopy (EEM and synchronous) provided a meaningful, simple, and efficient monitoring tool.
Footnotes
Acknowledgment
This work was funded by the Île-de-France Region in the framework of DIMR2DS (Domaine d'Intérêt Majeur finançant un Réseau de Recherche pour le Développement Soutenable).
Author Disclosure Statement
No competing financial interests exist.