
Abstract
Abstract
An autonomous technoecological hybrid was developed that controls primary production of algae in a laboratory-scale cultivator. The technoecosystem was based on a benthic algal cultivator that combined engineered feedback control programming with ecosystem-level feedback parameters. The feedback control system was designed to measure primary production of benthic algal turf through continuous pH monitoring and then automatically manipulate flow turbulence to optimize for maximum productivity. Results showed that the system converged on optimum productivity at the lowest level of turbulence, a state of optimum efficiency for power acquisition as predicted for self-organizing systems. Observations on species composition of the dominant algae showed shifting relative abundance of species for automated feedback trials, suggesting that certain species contribute to system organization through interfacing with the feedback control system. This work presents an original design for an experimental technoecosystem, and has the impact of advancing an experimental concept for testing principles of organization for self-organizing systems.
Introduction
A technoecosystem differs from its natural analog in that it has feedback systems that provide access to novel energy sources. Past research using net autotrophic, † heterotrophic (Blersch and Kangas, 2006), and balanced (Cai et al., 2006) microcosms displayed development to quasi-steady states different from those expected for their natural analogs. In these microcosms, the engineered feedback pathways between ecological and technological components influenced the state of both in a coupled pattern of organization. In the development of self-organizing systems (Odum and Pinkerton, 1955; Odum, 1994; Cai et al., 2006), selection favors the competitive success of components that use available energy at the greatest rate for survival, growth, and reproduction, thus increasing power acquisition by the system. In a technoecosystem, this amounts to selection for components that most successfully employ novel information pathways for power acquisition. The characteristics of species that respond to technoecological hybridization are those whose metabolism directly interfaces with the technological sensory components, and thereby they gain access to rewarding feedback circuits. It is important to understand the effect of technoecological hybridization on the organization of ecologically engineered systems for optimization of the performance of a set of ecological functions.
The objective of this research was to investigate the engineering of a technoecosystem by adding feedback pathways to control the metabolic function of a benthic algal turf. An algal cultivator was chosen because of the rapid response of its growth rates and metabolic measures to changes on the forcing functions. Benthic algal cultivators have been developed for mitigation of water quality problems through pollutant absorption into algal biomass periodically removed through harvesting (Adey et al., 1993; Craggs et al., 1996; Mulbry and Wilkie, 2001; Mulbry et al., 2010). Flow turbulence is critical to the development of the benthic algal community, influencing the overall growth rate (Biggs et al., 1998; Hondzo and Wang, 2002; Carpenter and Williams, 2007) and ecosystem metabolism (Carpenter et al., 1991; Hondzo and Wang, 2002; Carpenter and Williams, 2007) according to a subsidy–stress relationship (Odum et al., 1979; Biggs et al., 1998). * In this research, a feedback control system was designed to automatically control flow turbulence in a benthic algal cultivator to optimize for maximum net primary productivity (NPP). The expected results were that the system would iteratively modify the flow turbulence to seek a state of maximum useful power acquisition where productivity is maximized and energy input is minimized.
Experimental Protocols
The benthic algal technoecosystem was constructed by applying a feedback control system for ecosystem metabolism to a 1-m2 benthic algal cultivator in which process water was continuously recirculated from a drum reservoir into the wave surge bucket (Fig. 1). The cultivator was operated with a 150-L reservoir under 800 W of metal–halide lights under a 16/8 h light/dark diurnal cycle at an average light intensity of 350 μmol photon/m2 per second measured with a quantum flux probe (LI-250 light meter and LI-190 quantum sensor; LI-COR Biosciences, Lincoln, Nebraska). Two nutrient solutions were tried in separate trials: liquid dairy manure of known concentrations of total N and P identical to that used in previous trials (Kebede-Westhead et al., 2003) and a version of Bristol's nutrient solution (Trainor and Shubert, 1974; Lin et al., 2007). Daily nutrient additions were supplied at a rate of nitrogen loading of 0.6 g N/m2 per day, such that reservoir nitrate concentrations, measured with Reflectoquant nitrate strips (EM Science, Gibbstown, NJ), remained below 20 mg/L. The cultivator turf was previously seeded with consortia of algae from a nearby Maryland stream and included two major genera of green algae (Rhizoclonium and Microspora) and one cyanobacterium genus (Oscillatoria).
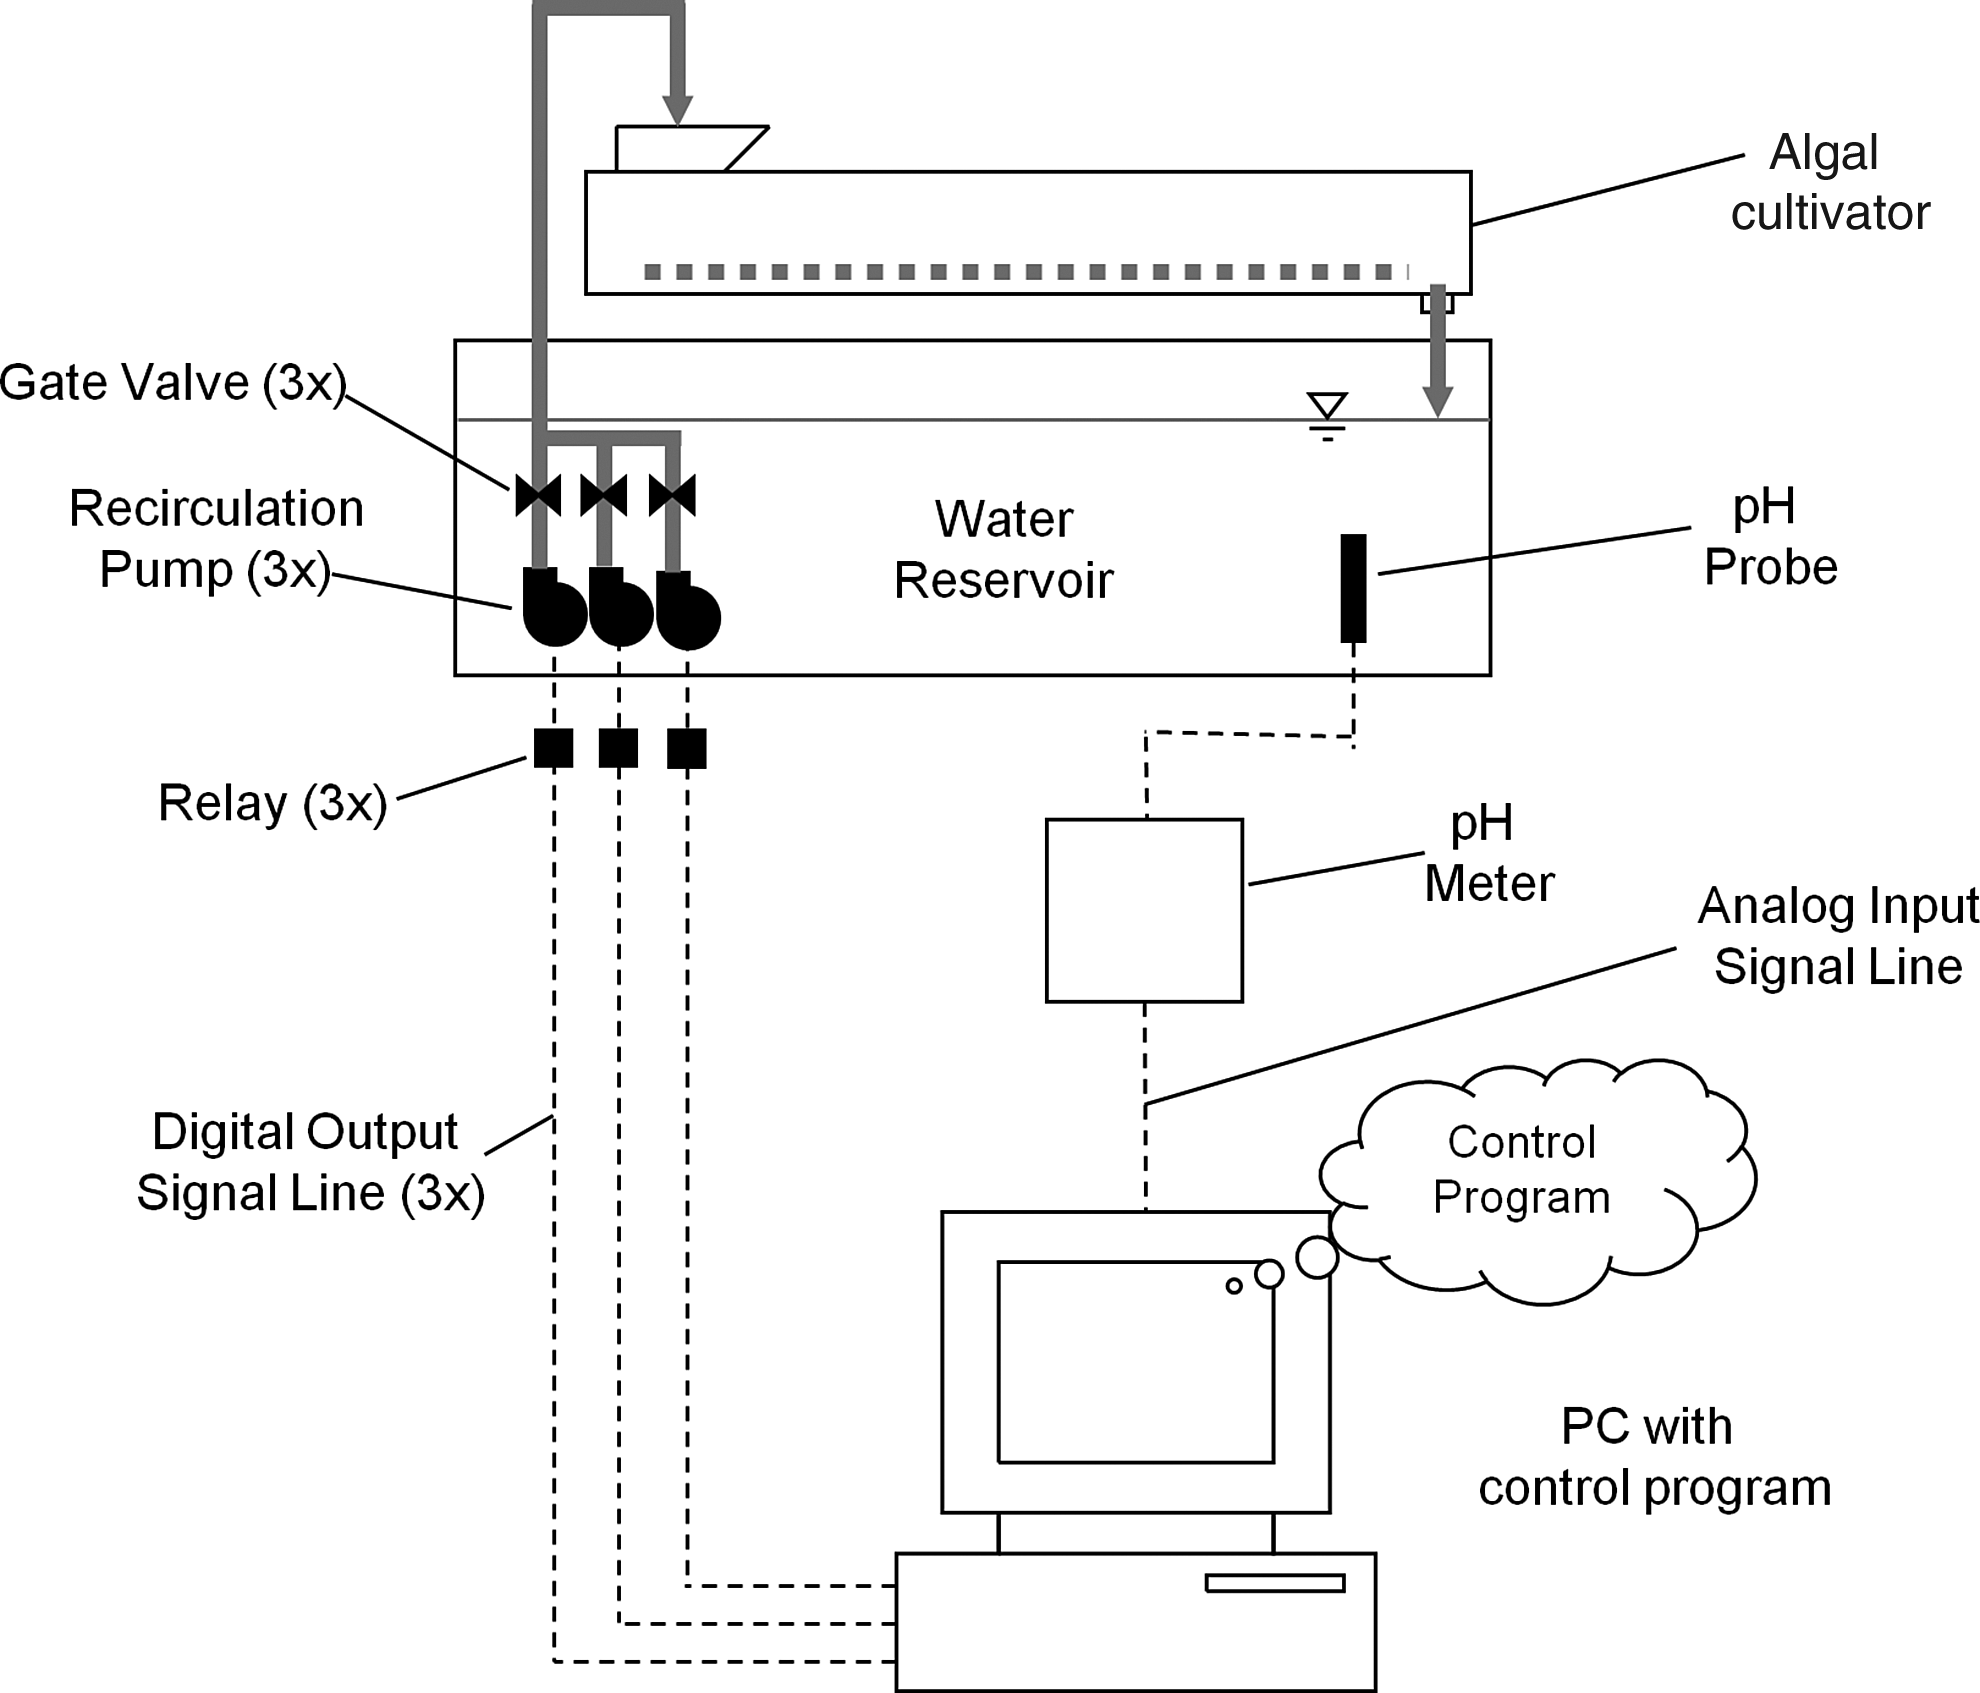
Schematic diagram of a computer setup for feedback control of flow rate in a benthic algal cultivator.
Algal biomass was harvested once every four light–dark cycles with a wet–dry shop vacuum, separated from the liquid with a 1.5-mm mesh filter bag, and air-dried. Biomass subsamples were oven-dried at 50°C for 24 h to measure water content, which averaged 10%. Biomass production was calculated as the dry biomass weight divided by the harvest period in days. After harvest, ∼30% of the water in the reservoir was replaced with distilled water to maintain consistent water chemistry over time. Before each harvest, the algal turf was sampled from three randomly chosen locations for microscopic taxonomic analysis.
The reservoir pH was monitored continuously and used to calculate the net primary production of the algal turf. A pH probe connected to a Jenco 3672 pH meter (Jenco Electronics Ltd., San Diego, CA) was inserted in the reservoir. A data acquisition computer running a control program in LABView (National Instruments Corporation, Austin, TX) recorded analog voltage from the pH meter ranging between 0 and 2.5 V, calibrated to a pH level between 4 and 11, respectively, and a timestamp. Average daily net primary production was determined automatically from the pH record using the pH diurnal method (Beyers et al., 1963) by converting it to inorganic carbon (IC) concentration using a third-order polynomial regression relationship determined by titration (Beyers and Odum, 1959; Beyers et al., 1963). The pH–IC titration was performed weekly, and polynomial coefficients in the control program were regularly updated.
The flow rate was the controlled variable in the algal cultivation unit, where flow turbulence was directly proportional to flow rate because of the action of the wave surge bucket. To change flow rate, the data acquisition computer selectively activated three centrifugal pond pumps (Model MD; Danner Manufacturing, Islandia, NY) of different flow capacities installed in the reservoir (Fig. 1). Pumps were activated in combinations to afford eight discrete flow rates (here called Pump States) at 20 L/min increments ranging from <2 L/min at Pump State 0 to 140 L/min at Pump State 7 (Table 1). The volume of the wave surge bucket was a constant 11 L, resulting in increasing wave surge frequency, and thus turbulence, with increasing Pump State.
Activation states: −, off; +, on.
A peristaltic pump provided constant low flow at <2 L/min.
The controlling algorithm made incremental changes to the Pump State based upon changes in NPP calculated from the pH–IC diurnal (Fig. 2). The pH-meter voltage, measured by averaging 3000 sample readings at 1000 Hz every 60 min, was converted first to pH using the pH-meter voltage calibration, and then to IC concentration using the pH–IC polynomial. This was compared to the previous IC concentration reading, and a decrease in IC concentration was recorded as NPP in g C/L per hour. The cumulative NPP for one harvest period was determined by summing all negative changes in IC concentration during that period. The cumulative NPP was then compared to that of the previous harvest period. If the cumulative NPP showed an increase, the Pump State was incrementally changed for the new harvest period in the same direction as the previous change, whereas if it decreased, the Pump State was incrementally changed in the opposite direction. Equivalent sequential readings of the cumulative NPP (within a preset tolerance) prompted a default decrease in Pump State, and a Pump State at the range extremes (0 or 7) prompted a default increment change toward the range middle. In this way, the algorithm continuously sought the maximum cumulative NPP via incremental change of flow rate over its range. All pH and IC data and pump-state change events were recorded to a data-logging file. At the end of a user-defined operation cycle, data collection paused until manually toggled to begin again, completing one cycle of the control algorithm operation (hereafter, called harvest cycle). Testing of the algorithm in repeated trials using a virtual representation of NPP versus volumetric flow rate (data not shown) indicated the likelihood of convergence on the maximum NPP at the lowest Pump State after 10–20 harvest cycles.
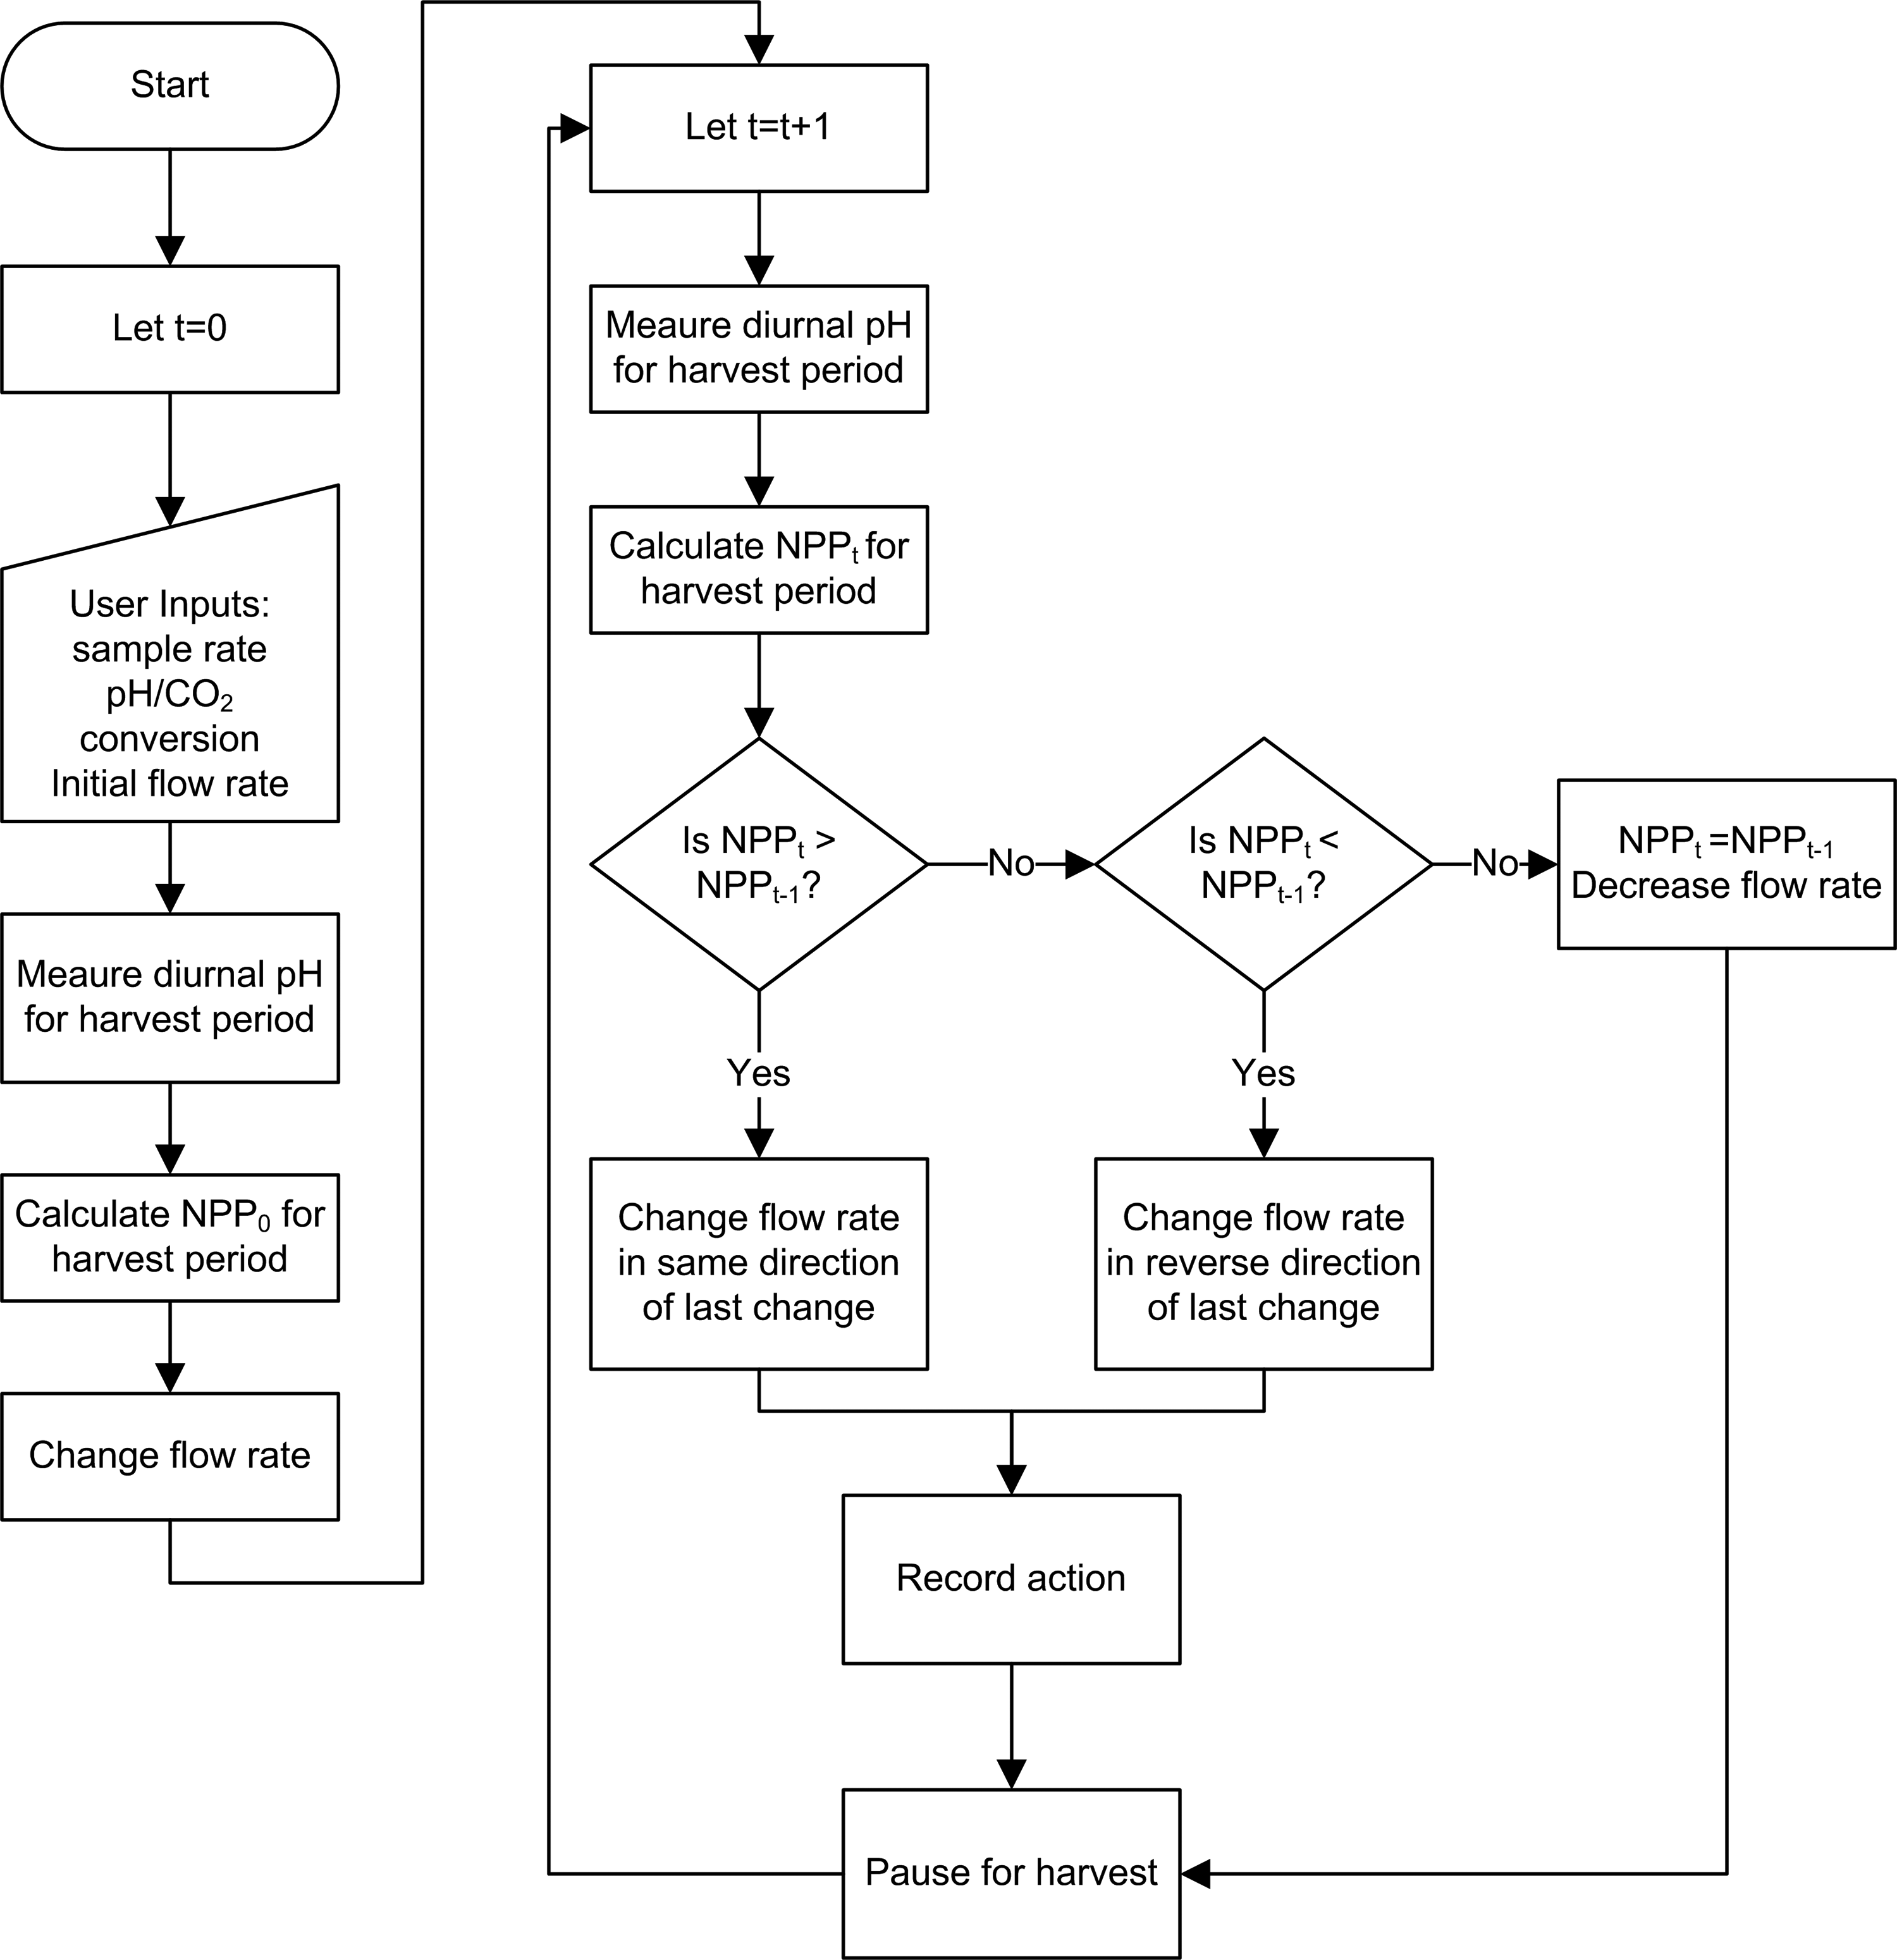
Simplified flow chart showing the logic that underlies the basis of the control algorithm for optimizing flow for maximum net primary productivity (NPP) over time (t).
Three trials of the algorithm's operation were conducted, one using a manure nutrient solution (Trial 1), and two using Bristol's solution (Trials 2 and 3) with a harvest period of 4 diurnal light cycles. Operation began with initialization of the control program with user-input parameters (Table 2), which included the sample rate and period for each pH data point; harvest period (in hours), which defined the time for integration of the pH-derived IC concentration changes for NPP calculation; pH–IC polynomial coefficients; and initial pump state for the trial. After parameter entry, the control algorithm was started immediately and allowed to run uninterrupted for the extent of the harvest cycle, at which time data collection automatically paused, awaiting operator intervention. During this pause, algal biomass was harvested, and water samples were analyzed for pH–IC conversion. After harvest, the control program was reinitialized with updated pH–IC polynomial coefficients, whereupon automated changes in pump activation state commenced. Trials were run through multiple subsequent harvest cycles to record trends. For comparison, an experimental control cultivator with no feedback control system was operated for multiple harvest periods (n>5) at three different flow rates each (2, 40, and 140 L/min, corresponding to Pump States 0, 2, and 7, respectively) using Bristol's solution for nutrients.
IC, inorganic carbon.
Data collection and analysis
The data logged throughout each harvest cycle included the timestamp; measured voltage; calculated pH based on voltage; calculated IC concentration; average rate of change in IC concentration in the preceding time interval; cumulative negative change in IC concentration as NPP for current harvest period; and Pump State. The biomass production rate was determined for each harvest cycle from the sacrificial harvests. Algal subsamples were keyed to the genus level, and the relative abundance of the three major genera of algae was calculated. Data were analyzed by plotting Pump State and NPP versus the harvest cycle and examined for trends. The NPP was plotted versus the biomass production rate, and the correlation between the two was examined by linear regression analysis.
The convergence of the control algorithm was visualized by generating phase plots of output versus input power, an efficiency measure expected to trend toward an optimum value for self-organizing systems (Odum, 1996; Cai et al., 2006). Although total input power included all material and energetic inputs, including lights, nutrients, and material infrastructure, variation in input power was a function of the volumetric flow rate as set by the Pump State, the only variable changing throughout a trial. The power of the water flow was calculated as the sum of the power of the base flow rate (Ef) and the power of the wave surge (Ew). The power of the base flow rate was calculated from the equation for the kinetic energy of motion:
where ρ is the density of water (1000 kg/m3); A is the cross-sectional areal of the flow (1 m wide by 0.015 m deep); and v is the velocity of the water (measured at 0.2 m/s). The power of the wave surge was calculated as the product of the wave energy density per unit surface area (Phillips, 1977) and frequency of the wave surge:
where ρ is the density of water (1000 kg/m3); g is the acceleration of gravity (9.8 m/s2); a is the initial wave surge amplitude (0.075 m); As is the horizontal surface area (1 m2); and f is the frequency of the wave (s−1). The power of the output production was calculated from the NPP measurements, using the energetic equivalence relationship of 8 kcal/g C fixed in production (Odum, 1996). The phase plots of the power of production versus the power of Pump State were examined for trends and compared to the experimental control. Also, the production efficiency, calculated as the ratio of output power (from NPP) to input power (from Pump State), was plotted versus harvest cycle number and examined for trends. Abundances of algal species were plotted versus harvest cycle number and analyzed for trends in time in comparison to the control.
Results
Multiple exploratory trials were performed to determine the optimum ranges of operating parameters and for debugging the algorithm. Three trials successfully operated through at least 10 harvest cycles that allowed observations for trends in flow turbulence (as Pump State) and NPP as daily average rate of carbon metabolized. All the three trial combinations exhibited the behavior of convergence to lower values of turbulence at low Pump State values (Fig. 3). Initial increases in NPP corresponded to initial decreases in Pump State, trending toward vacillating behavior around moderate NPP values experienced at the lower turbulence levels of lower Pump States. For all trials, mean NPP showed no correlation with biomass productivity, with coefficients of determination of <0.3 for all trials (Fig. 4). Mean biomass productivity was 12.8±2.6, 6.8±2.4, and 6.1±2.2 g dry weight [DW]/m2 per day for Trials 1, 2, and 3, respectively. The overall mean NPP measurements showed a significant difference [t(16)=2.224, p=0.0409] at Pump State 2 between trials (M=0.418, SD=0.0407, n=14) and the control (M=0.653, SD=0.0145, n=4), whereas no significant differences were observed for Pump States 0 and 7 (Fig. 5).
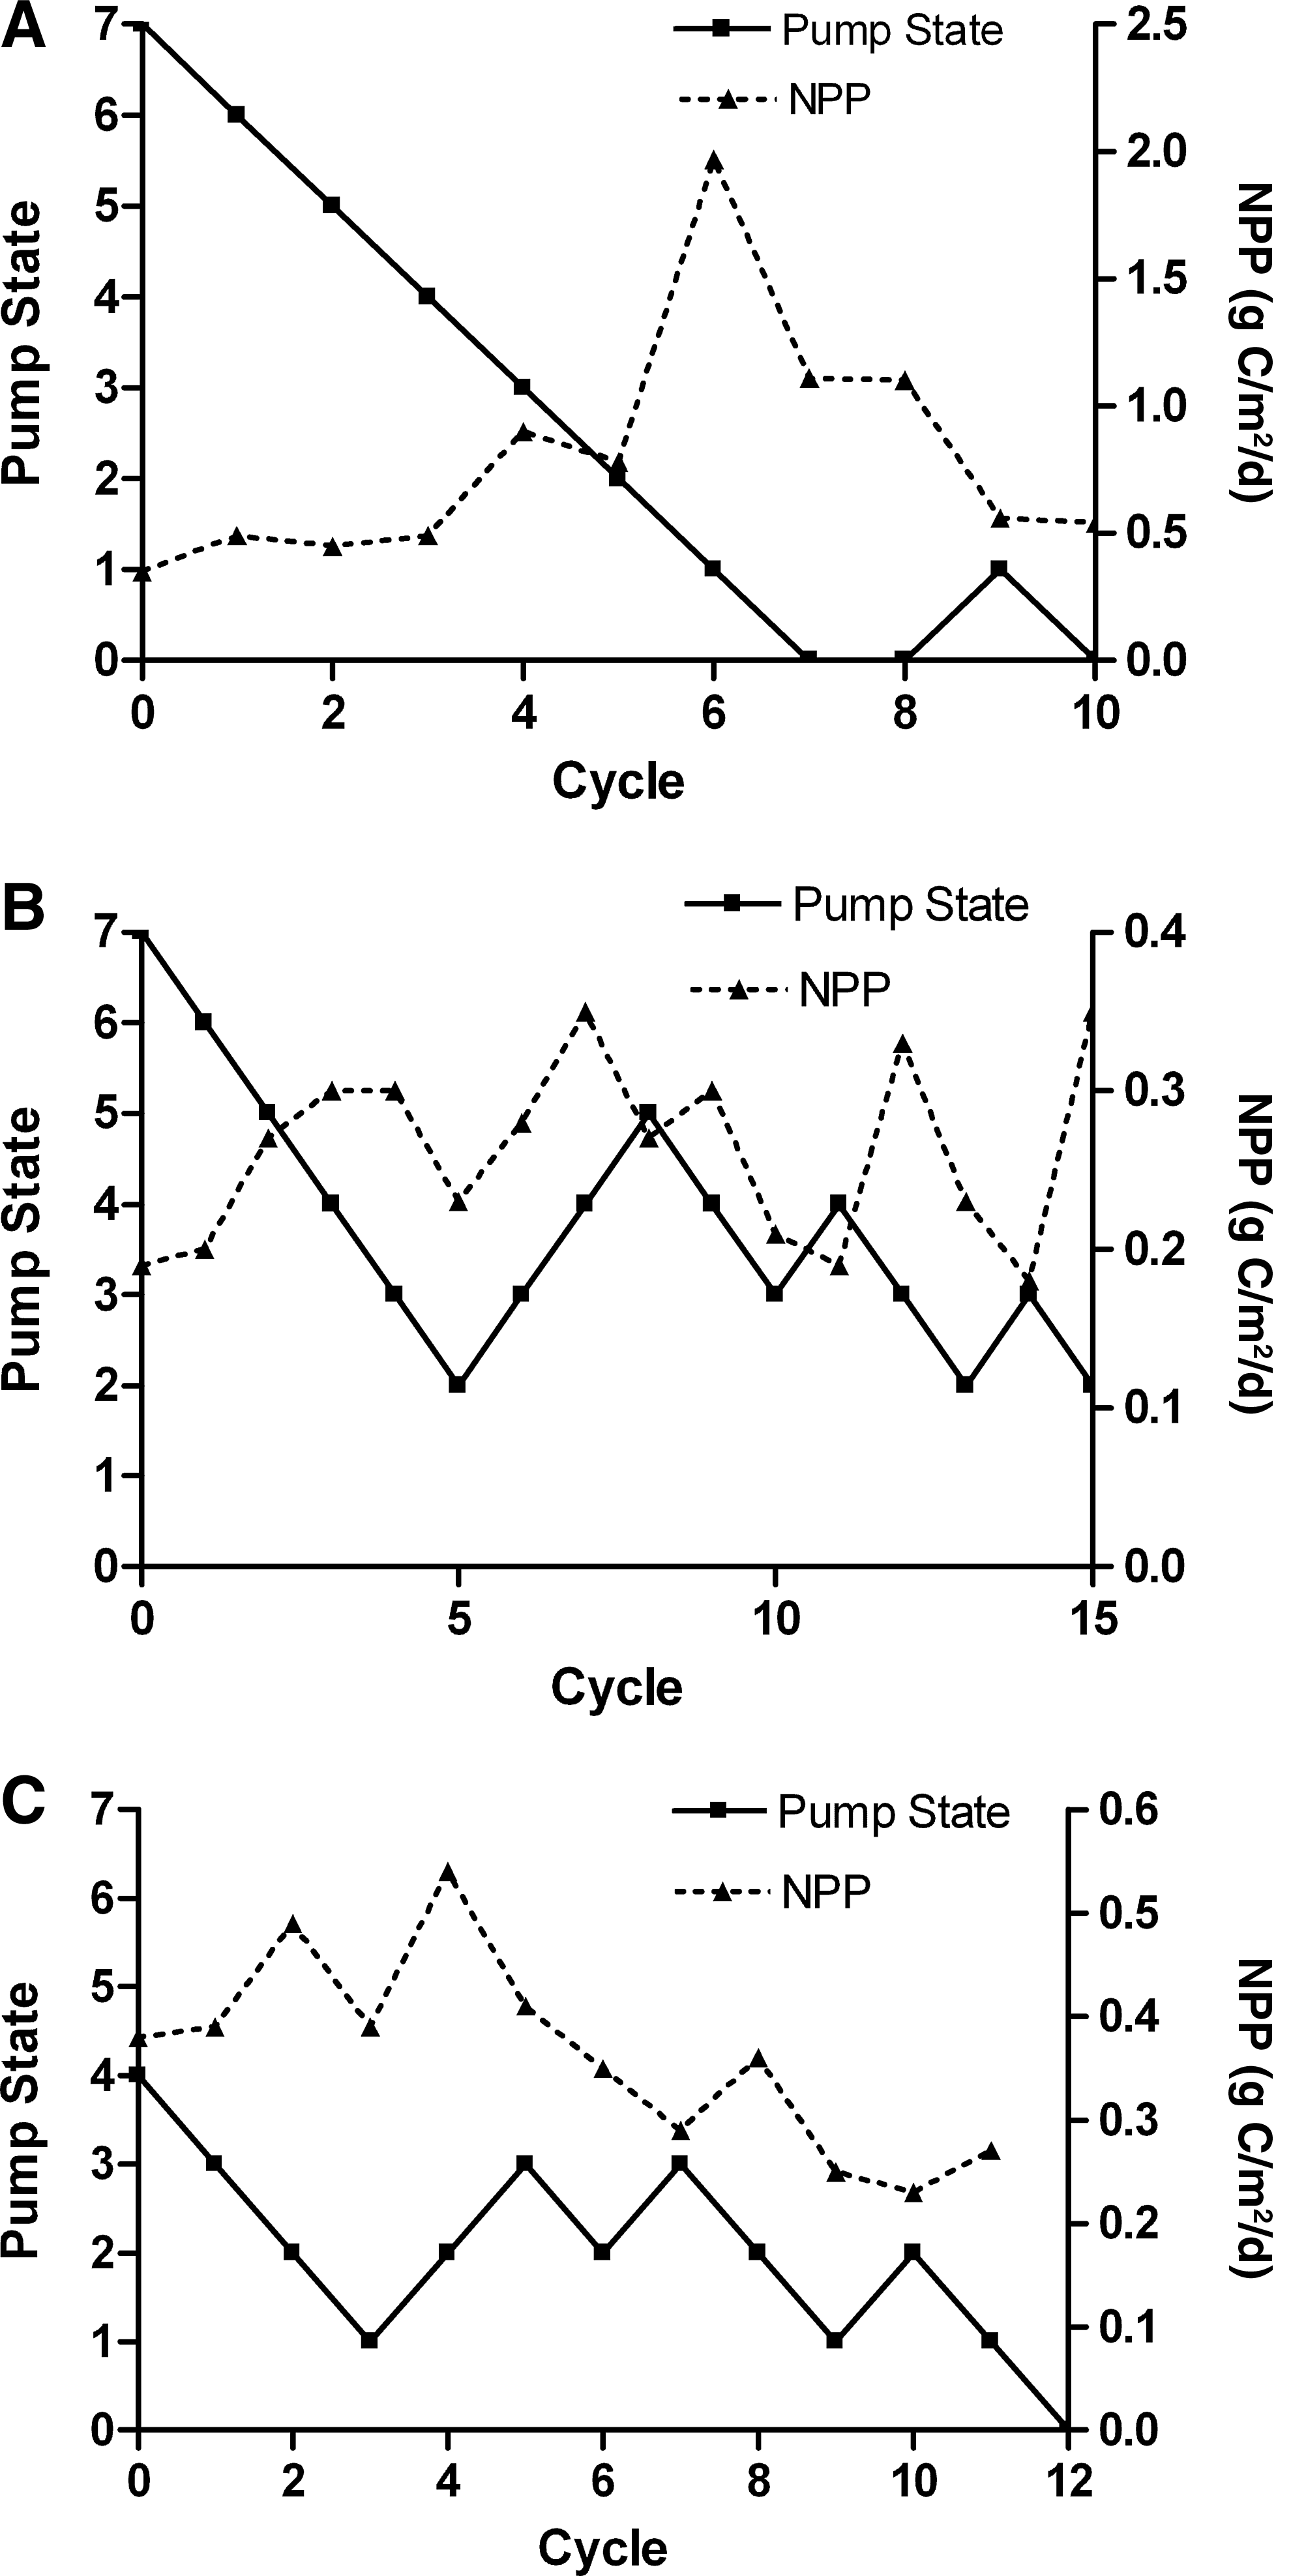
Pump State and NPP versus harvest cycle for
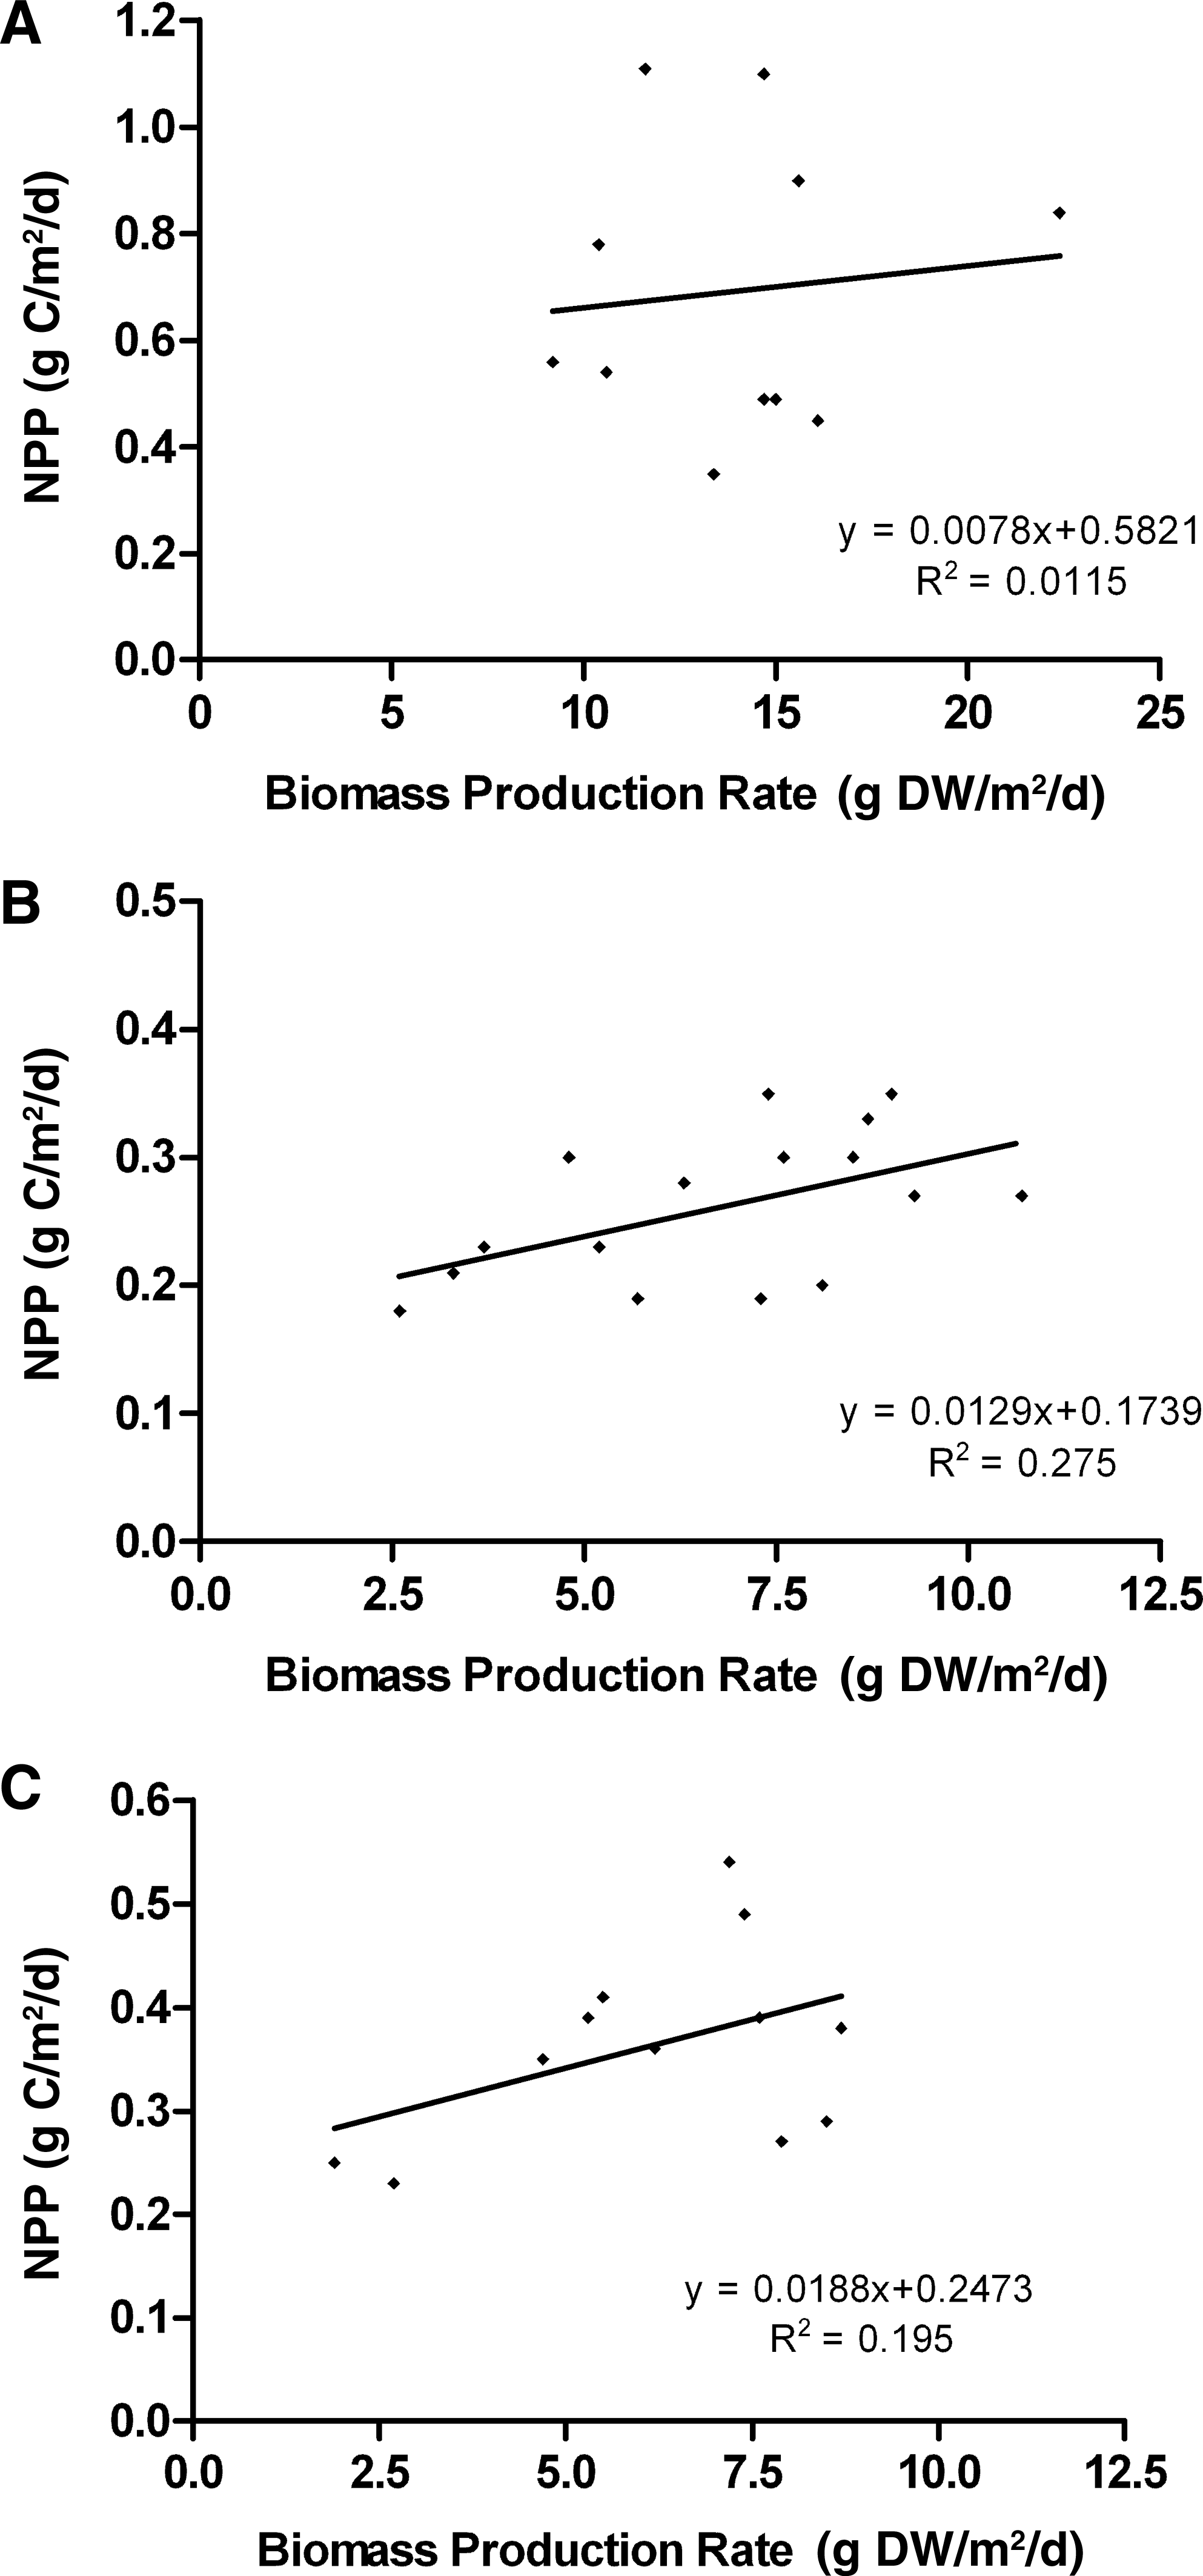
NPP versus biomass production rate for
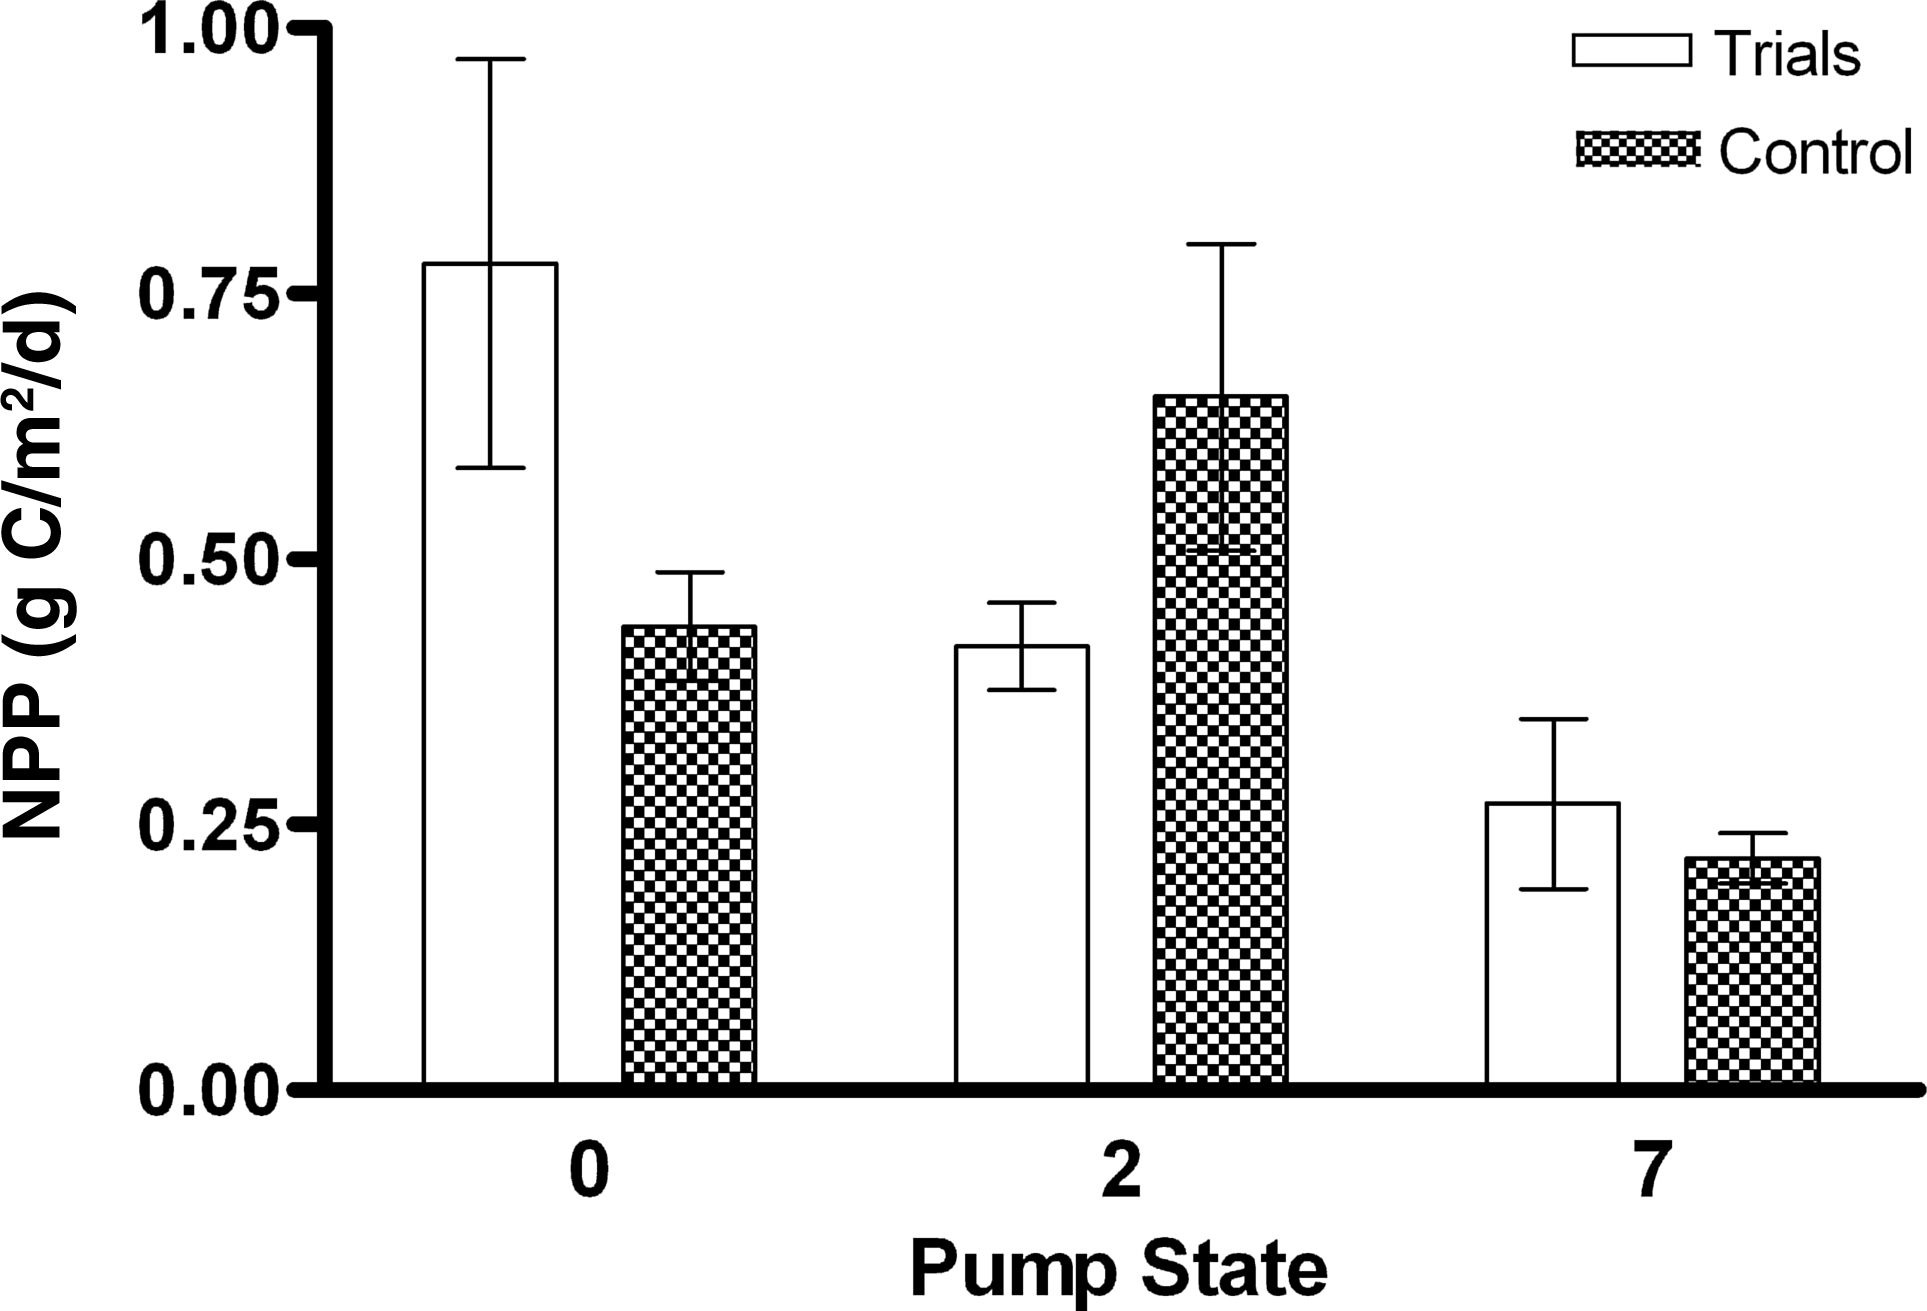
NPP versus Pump State for automated trials and experimental control.
The results of power phase plots for the trials show that the Pump State trended toward lower power, while production either remained relatively constant or increased (Fig. 6). The power of production was generally greater for Trial 1 than for other trials. For all trials, the power of production fell within one standard deviation of that for the experimental control at the three different Pump State powers. The production efficiency generally increased for all trials in early cycles (Fig. 7). Production efficiency in Trial 1 increased to a maximum of 0.684 by cycle 8, whereas in Trials 2 and 3, it increased to local maxima of 0.040 (cycle 5) and 0.109 (cycle 3), respectively, after which an oscillating pattern was observed in all trials.
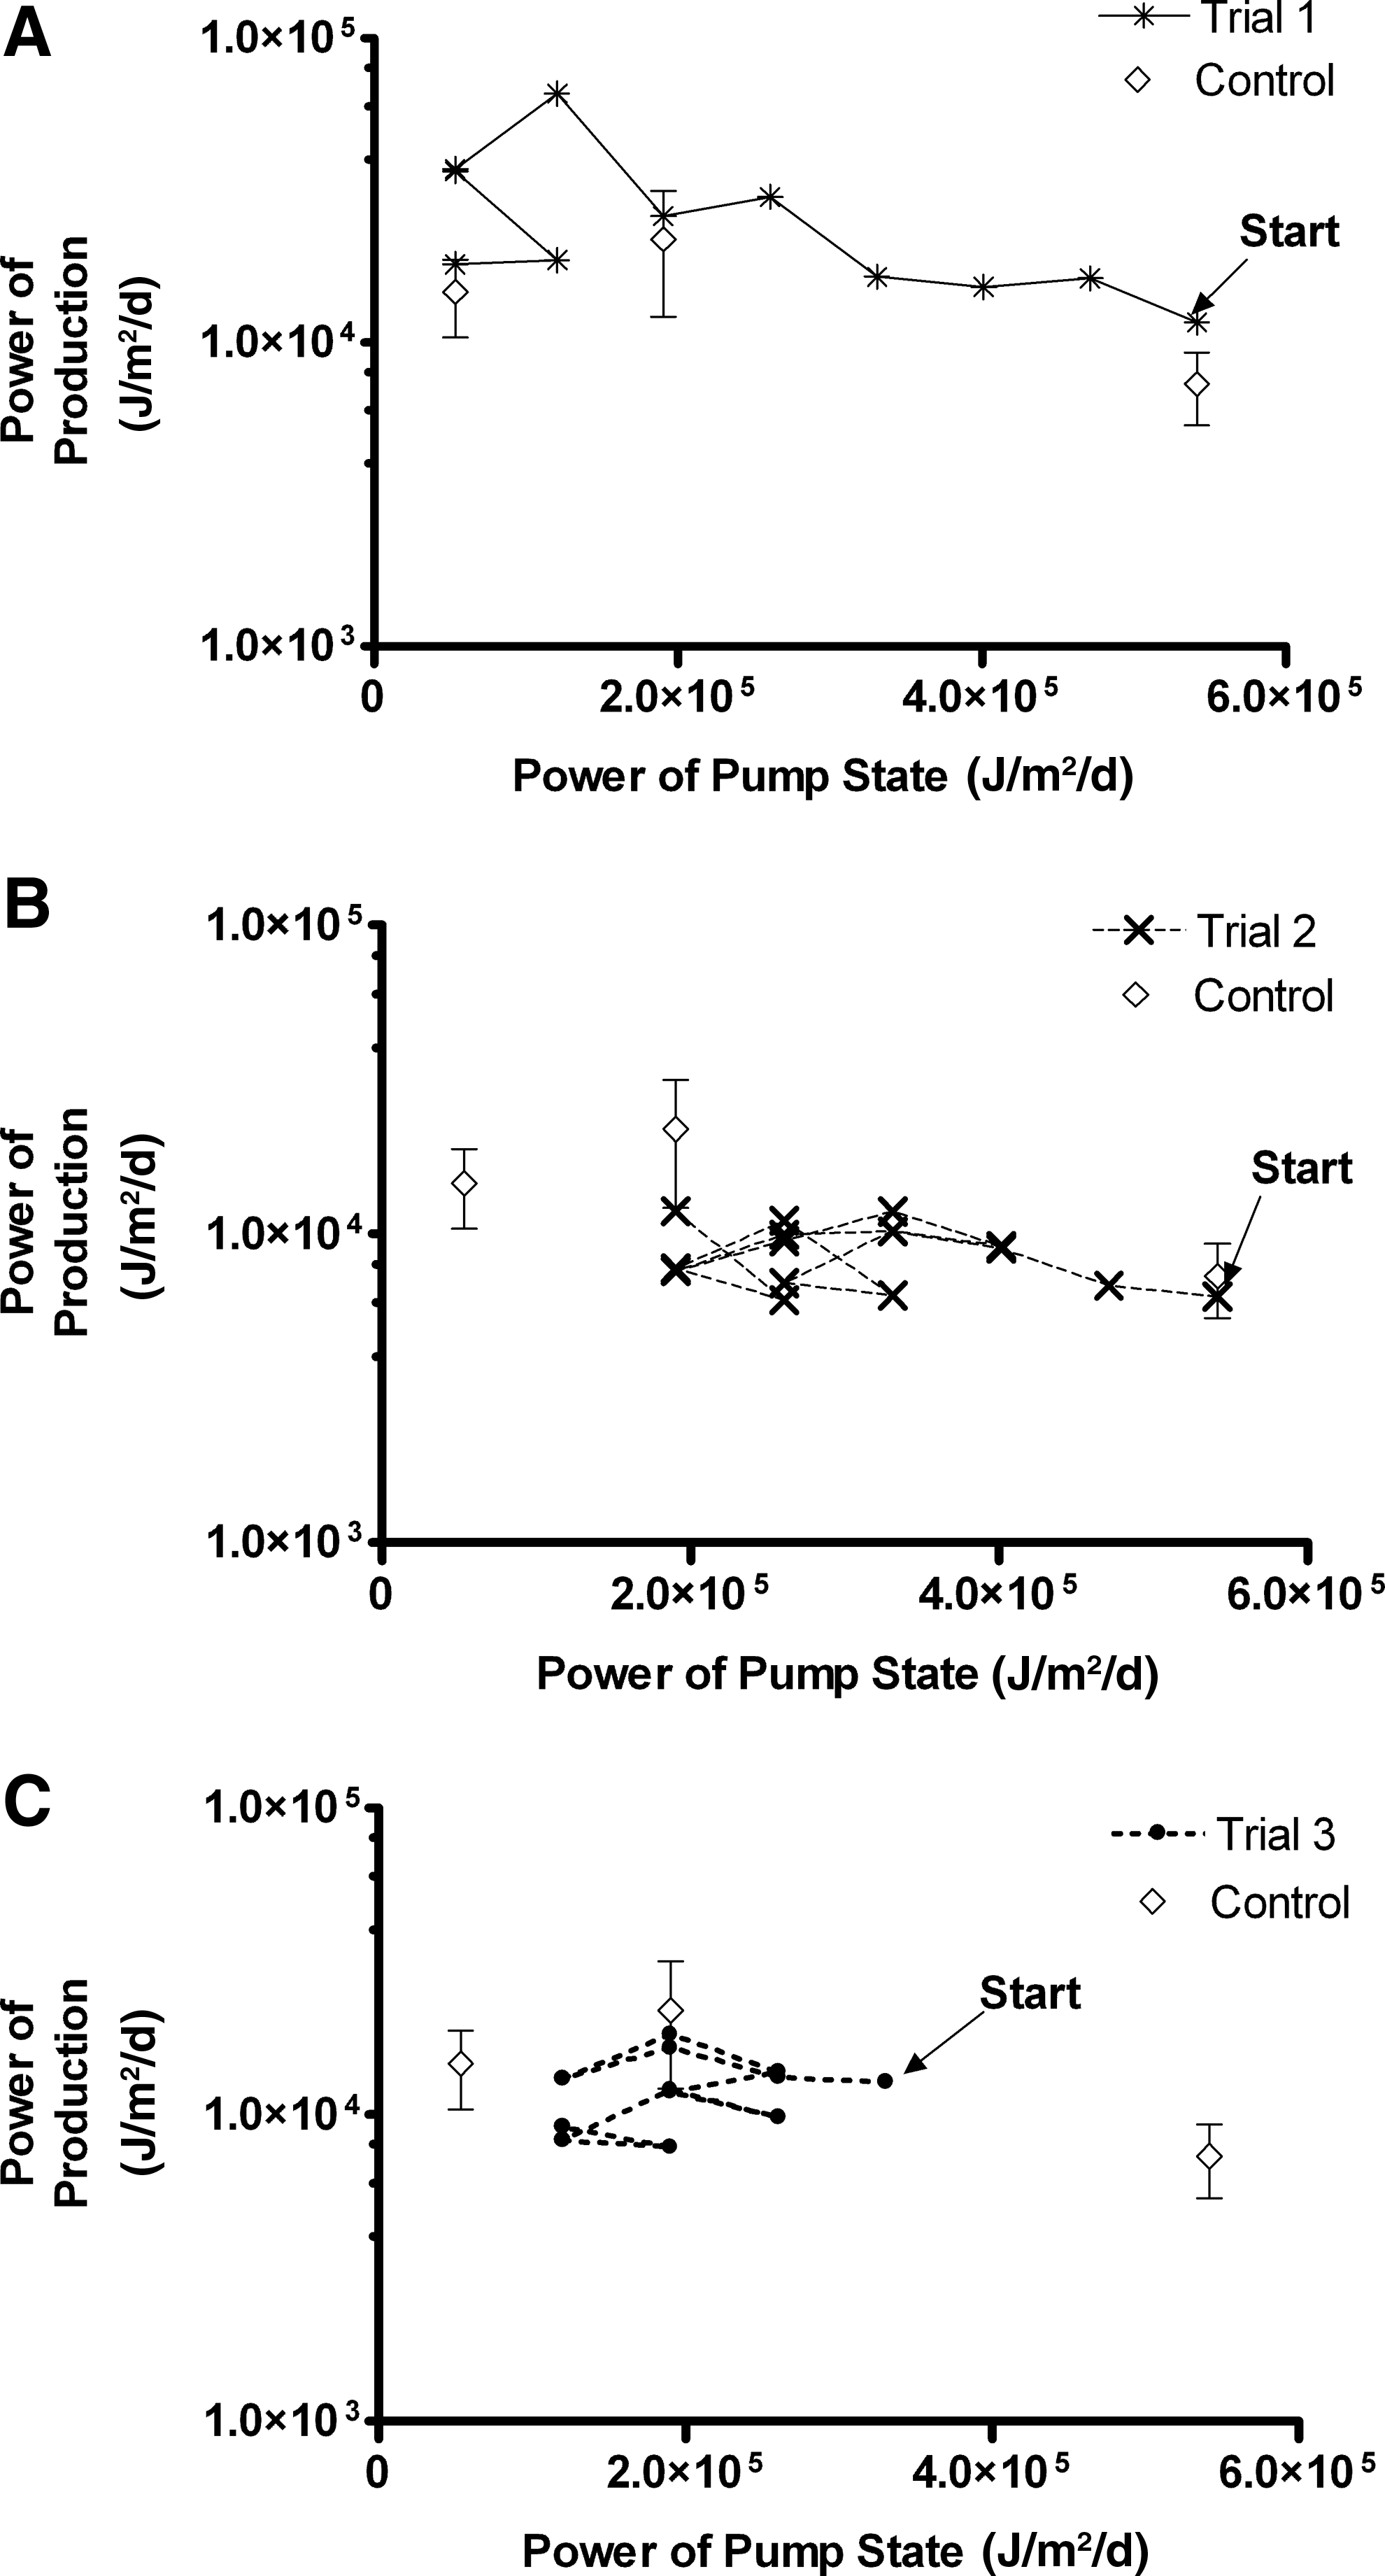
Power of net primary production versus power of Pump State for the experimental control compared to

Production efficiency versus harvest cycle for automated trials.
The relative abundances of algal species were plotted versus day of operation for the experimental control at Pump State 0, 2, and 7 (Fig. 8A–C) and for experimental trials operating under Bristol's solution (Trials 2 and 3) for the first 45 days of operation (Fig. 8D, E). For all, the algal community was dominated by Microspora and Rhizoclonium throughout most of the operation time. The abundance of Oscillatoria was observed to decrease in all trials and control states, exhibiting a slight increase only near the end of data collection for the experimental control operating under the highest flow rate (Pump State 7).

Relative abundance of various algal genera versus day of operation for
Discussion
The control algorithm operated as expected, seeking the lowest Pump State for the highest measured productivity. In all trials, the system exhibited the expected behavior throughout the trace of the Pump State versus harvest cycle (Fig. 3), maintaining the direction of pump state increment as NPP increased (e.g., cycles 1, 2, and 3 of Trial 2), reducing the pump state when NPP stayed the same (e.g., cycles 4 to 5 of Trial 2), and changing the direction of pump state increment when NPP decreased (e.g., cycles 5 to 6 of Trial 2). After numerous harvest cycles, the Pump State overall decreased. This trending pattern of lower Pump State over time was observed for all trials.
Variation in the NPP at a given pump state affected the operation of the system. For example, in Trial 3, the peak in NPP at cycle 4 was higher than at any other pump state, and there is a general downward trend in NPP in subsequent cycles, which is the opposite of what was expected. This trial exhibited the action of the programmed minimization convention, where the Pump State decreased when the NPP of successive harvest cycles fell within a tolerance setpoint. The decrease in NPP was possibly the result of other factors that had accumulating effects over time, such as a progressive buildup of a chemical constituent in the water. Moreover, the control system was susceptible to errors from general measurement noise. Further development of the control algorithm might entail noise reduction of the pH diurnal signal and assessment of the veracity of NPP values in relation to those expected, based on past performance. The lack of an observed correlation between NPP and biomass production rate (Fig. 4) poses a potential operation problem. Biomass production rates were lower (5–10 g DW/m2 per day)], but less noisy for Bristol's nutrient solution compared to those (8–23 g DW/m2 per day) using manure as a nutrient solution, suggesting the likelihood that the variance in the measurement of NPP effectively flattens the expected subsidy–stress distribution of metabolism to Pump State. The decoupling of biomass production and measured NPP may result from variation of biomass nutrient content, not measured in this investigation, which may fluctuate with the changing flow conditions of different Pump States. This decoupling may also result from measurement noise that outweighs the expected variation in NPP correlating with Pump State. The trends in NPP as a function of Pump State for automated trials showed relative agreement with the experimental control (Fig. 5), suggesting that the control system successfully and automatically replicated manual experimentation on the subsidy–stress relationship between flow turbulence and productivity.
The power-phase plots of productivity versus Pump State show the trend of self-organization of the system, as all trials exhibited a convergence toward lower-power Pump States, as the power of production vacillated around a value near the maximum. The values of NPP observed at each Pump State were consistent with those observed for the experimental control at similar flow rates (Fig. 6). For all trials, the production efficiency (the ratio of output to input power) increased over the first 4–6 harvest cycles, attained a maximum, and then vacillated around a value somewhat less than the maximum for that trial (Fig. 7). This would support the interpretation that self-organization in a coupled technoecosystem seeks the optimum efficiency in the transformation of input energy to output energy. The maximum power principle contends that in self-organizing systems, system designs prevail that maximize power use and energy transformation at an optimum efficiency (Odum and Pinkerton, 1955; Odum, 1995). The vacillation of the production efficiency in all trials may be explained by this principle, demonstrating the action of self-organization in the technoecosystem as a whole. The greater production efficiencies observed for Trial 1 compared to the other trials likely result from the difference in nitrogen availability of the nutrient solution that allowed for greater primary production.
The relative abundance of species in the autonomous trials most closely reflected the species distribution in the lower-flow states of the experimental control (Fig. 8), where Oscillatoria species decreased, and Rhizoclonium and Microspora species increased throughout the first 45 days of operation. Throughout this time, the autonomous trials passed through successively lower Pump States and approached lower states of flow turbulence; hence, the algal community shifted to resemble that observed for lower flow in the control. For the automated trials, however, the change in species mix over time is in response to changes in the energy signature of the system (Odum, 1994), which itself results from measured changes in NPP, exhibiting the role of feedback control in the organization of the ecological system. One might expect that the algal community in the autonomous system would organize to a new state that is particular to it, where the metabolic characteristics of a species position it to use the information feedback advantageously. This phenomenon has been observed in other studies (Cai et al., 2006), where an increase in acid-secreting blue-green algae was seen in microcosms that developed under automatic control of lights compared to those that did not when feedback control of pH was employed. The interpretation here is that the internal system components, both technological and ecological, respond in such a way that the energy signature and ecosystem structure organize around each other to find the optimum level of operation. While this phenomenon could not be substantiated with the set of experiments reported here, this work suggests further hypotheses that might be tested experimentally.
The trends in ecosystem metabolism in the trials display the potential of system operation to increase the utility of the algal cultivation in remote deployments, where a caretaker technological system could maintain optimum conditions to maximize productivity in a changing environment. While improvements to the monitoring and control components of the system can certainly be suggested, the system in its current state offers a platform on which more sophisticated decision-making algorithms can be developed and employed. The benthic algal technoecosystem platform may also be developed into a standard experimental unit for testing of fundamental organizing principles of technoecological hybrids. Technoecosystem microcosms such as this may supply a class of experimentation with complex adapting systems unavailable at the larger scale, yet that may provide insight into general rules of organization applicable at all scales.
Summary
The automated control system for benthic algal cultivation operated as designed, seeking the highest productivity at low volumetric flow rates. The activity of the control algorithm was sensitive to the variance characteristics of the measured signal of primary production, which is thought to flatten the relationship between production and flow rate. Operation of the algorithm demonstrated signatures of convergence over a number of harvest cycles, as it generally minimized the Pump State while attempting to maintain higher production values. In this way, the system trended toward a state of optimum efficiency for the net production that was greater than the minimum, but somewhat less than the maximum measured, a result consistent with the maximum power principle. The trajectory followed by the automated system as the Pump State was changed replicated results observed on nonautomated experimental controls, displaying the potential for the system to seek out optimum production efficiency at the highest ratio of output-to-input power that could be maintained. The shift in relative abundance of algal species over time in the autonomous trials was reflective of nonautomated experimental controls, except it was in response to novel engineered feedback loops. These factors suggest that the algal system with automated feedback control of metabolism as a function of flow turbulence internally self-organized as a technoecosystem.
Footnotes
Acknowledgments
We gratefully acknowledge Shannon Kondrad Ingram of the USDA ARS EMBUL for help with experiments. Dr. David Tilley of the Environmental Science and Technology Department at the University of Maryland provided technical advice and review for this research. Support for D.M.B. during these experiments was provided by the USDA Food and Agricultural Sciences National Needs Graduate Fellowship Grants Program.
Author Disclosure Statement
No competing financial interests exist.
†
Kania, H.J., and Beyers, R.J. (Unpublished report). Feedback control of light input to a microecosystem by the system. Savannah River Ecology Laboratory, Aiken, SC.
*
Blersch, D.M., Kangas, P.C., and Mulbry, W.W. Turbulence and nutrient interactions that control benthic algal production in an engineered cultivation raceway. Algal Res. (In review).