
Abstract
Abstract
Evaporation from exposed, contaminated earthen surfaces is important from an air pollution risk assessment perspective. Earthen cracks are formed in drying exposed earthen solids, such as soils, mudflats, exposed dredged sediment, or sludge. Evaporation of hazardous chemicals from exposed flat surface solids has been reported in literature. This study focuses on evaporation from within the cracks formed in these earthen materials. Evaporation of water vapor and phenanthrene from a simulated crack-like surface was measured using a flux chamber. Evaporation flux was measured as a function of the crack aspect ratio (depth/length) and air velocity. Postexperiment sectioning of the crack surface revealed the vertical profile of drying within the crack. It was generally observed that the flux (based on the actual crack surface area) was higher for wider cracks than that for narrower cracks. Computational fluid dynamics simulations were also carried out to visualize circulation of air within a crack. These studies provided estimates of the vertical extent of convection within a crack. Flux data from all experiments were used to obtain a correlation for the mass transfer coefficient with crack dimensions as a parameter. A simplified chemodynamic model was presented and the model predictions are compared with experimental data.
Introduction
Drying of earthen solids leads to the formation of shrinkage cracks. There have been few reports on evaporation from within crack-like surfaces as a function of crack size and wind speed. Miller (1979) conducted experiments to measure the evaporation of organic solvents from beakers and obtained a correlation for mass transfer coefficient based on the turbulent boundary layer theory [Eq. (1)].
where z is the depth of the vapor cavity, d is the diameter (or length) of the cavity, and
Adams et al. (1969) measured evaporation of water vapor from simulated rectangular cracks. The data from this study was used to obtain a correlation shown in Equation (2) (Ravikrishna, 2000).
Other than these, no systematic study of evaporation rates of hydrophobic organics from within an earthen crack was found in literature. The primary objective of the current study was to measure the evaporation rates of water vapor and phenanthrene from an earthen crack and correlate with relevant physical parameters for application in a chemodynamic model to predict emissions from earthen cracks.
Materials and Methods
Flux chamber
Experiments were conducted in a flux chamber (Valsaraj et al., 1999) where a synthetic crack was placed in a cavity with air passing over the mouth of the crack (Fig. 1). Three different wedges were fabricated with different depth/length (z/d) ratios to represent different aspect ratios of cracks (Fig. 1b). The depth (z) and width (w) of each wedge was 10 cm, but their lengths (d) were varied as 9, 6.5, and 4.3 cm in the direction of air flow and the corresponding aspect ratios (z/d) were 1.1, 1.5, and 2.3.

Experimental run
Clean sediment, obtained from a local lake (Indian Institute of Technology-Madras, Chennai, India), was sieved through a 400-μm screen. For all experiments, a 5-mm-thick layer of earthen material was applied to the inner surface of the wedges. For phenanthrene evaporation runs, clean sediment was contaminated with phenanthrene using a slow equilibrium technique (Thoma, 1994). The wedge was then placed inside the cavity of the flux chamber, which was then sealed air-tight. Ambient air was pushed through the chamber using an air pump. Separate experiments were conducted to measure the evaporative flux of water vapor and phenanthrene. Table 1 lists the relevant properties of the sediment and phenanthrene used in this study.
Thibodeaux (1996).
Mackay et al. (1979).
OC, organic carbon; KOC, OC–water partition constant.
Water vapor evaporation flux was measured as (ρout−ρin)·Q/A, where ρin and ρout were the inlet and outlet water vapor concentrations, estimated from the inlet and outlet relative humidity measured using thermohygrometers (Testo®). Q is the flow rate of air and A is the actual crack surface area, estimated as 219, 210, and 204 cm2 for the aspect ratios of 1.1, 1.5, and 2.3, respectively. Evaporation flux of phenanthrene was measured by collecting the emissions in an adsorbent bed (200 mg of XAD-2®). The amount of phenanthrene accumulated in the adsorbent was measured (ΔmA) and flux was obtained as ΔmA/(A·Δt), where Δt was the sampling interval (which varied between 2 and 24 h). An “end of time interval” approach was used for the display of all measured flux data. Flux experiments were conducted with three different air flow rates: 0.5, 1.0, and 1.6 L/min (corresponding to linear air velocities of 1.7, 3.4, and 5.3 cm/s, respectively). At the end of the flux experiments, the earthen material in the cracks was sectioned into thin layers of 1.0–2.5 cm thick and analyzed for residual chemicals. The amount of phenanthrene in inlet ambient air was measured and found to be below detection limits for the corresponding time intervals of sample collection used in the experiment.
Analytical methods
The moisture content in the earthen solid was measured gravimetrically after drying at 110°C. Phenanthrene on the XAD resin in the adsorbent tube was extracted with 6 mL of acetonitrile and analyzed with high-performance liquid chromatography (Jasco®) using a diode array detector. A gradient method was used with an initial solvent composition of 60:40 (acetonitrile:water [v/v]) to 100% acetonitrile after 25 min at a flow rate of 1.5 mL/min. The UV absorption spectra were collected for the entire chromatogram. The loading of phenanthrene in the earthen solids was measured by ultrasonic extraction using a 1:1 mixture of hexane-acetone (based on US EPA SW-846 Method 3550C). Organic matter of the earthen material sample was analyzed gravimetrically using a combustion method at 550°C. The organic matter value was converted to organic carbon by multiplying the organic matter fraction by the van Bemmelen factor (0.58; Buringh, 1984).
Results and Discussions
Effect of airflow rate and crack aspect ratio
Figure 2a–c shows the effect of air velocity on the evaporation flux of water vapor from different crack aspect ratios. Figure 2a also shows the evaporation from a flat surface in addition to the flux from the three crack-like structures. The water evaporation flux from a flat surface was constant for a certain period of time and then decreased with time. During the constant flux duration, the constant air-side mass transfer resistance controls evaporation rate. The decrease in flux indicates the increase in the mass transfer resistance on the solid side (rate of movement of water vapor within the thin earthen material layer). The water evaporation fluxes from the three cracked surfaces showed similar trends. The initial flux was the highest for the case z/d=1.1, and decreased with increase in z/d. The time at which the decrease begins varies with the z/d ratio. The decrease in the flux commenced after 6.2, 5.6, and 5.7 h for the z/d=1.1, z/d=1.5, and z/d=2.3 cases, respectively. In comparison, the average initial water vapor flux decreased by 22%–29% for an air flow rate of 1.0 L/min and by 47–59% for 0.5 L/min for the three z/d values.

Water evaporation flux as a function of flow rate and crack aspect ratio.
As seen in Fig. 2a, the initial constant flux from a flat surface is almost twice as large as the flux from cracks. This clearly indicates the influence of increased mass transfer resistance in the case of cracks despite the higher exposed surface area. The flux from wider cracks (with a higher projected mouth area) showed a larger flux compared with that from narrower cracks. This is also supported by the observation of the sectioning profile of the crack surface (Fig. 3a), which shows that the sections near the top of the crack wall show a higher evaporation loss than from deeper layers of the crack.
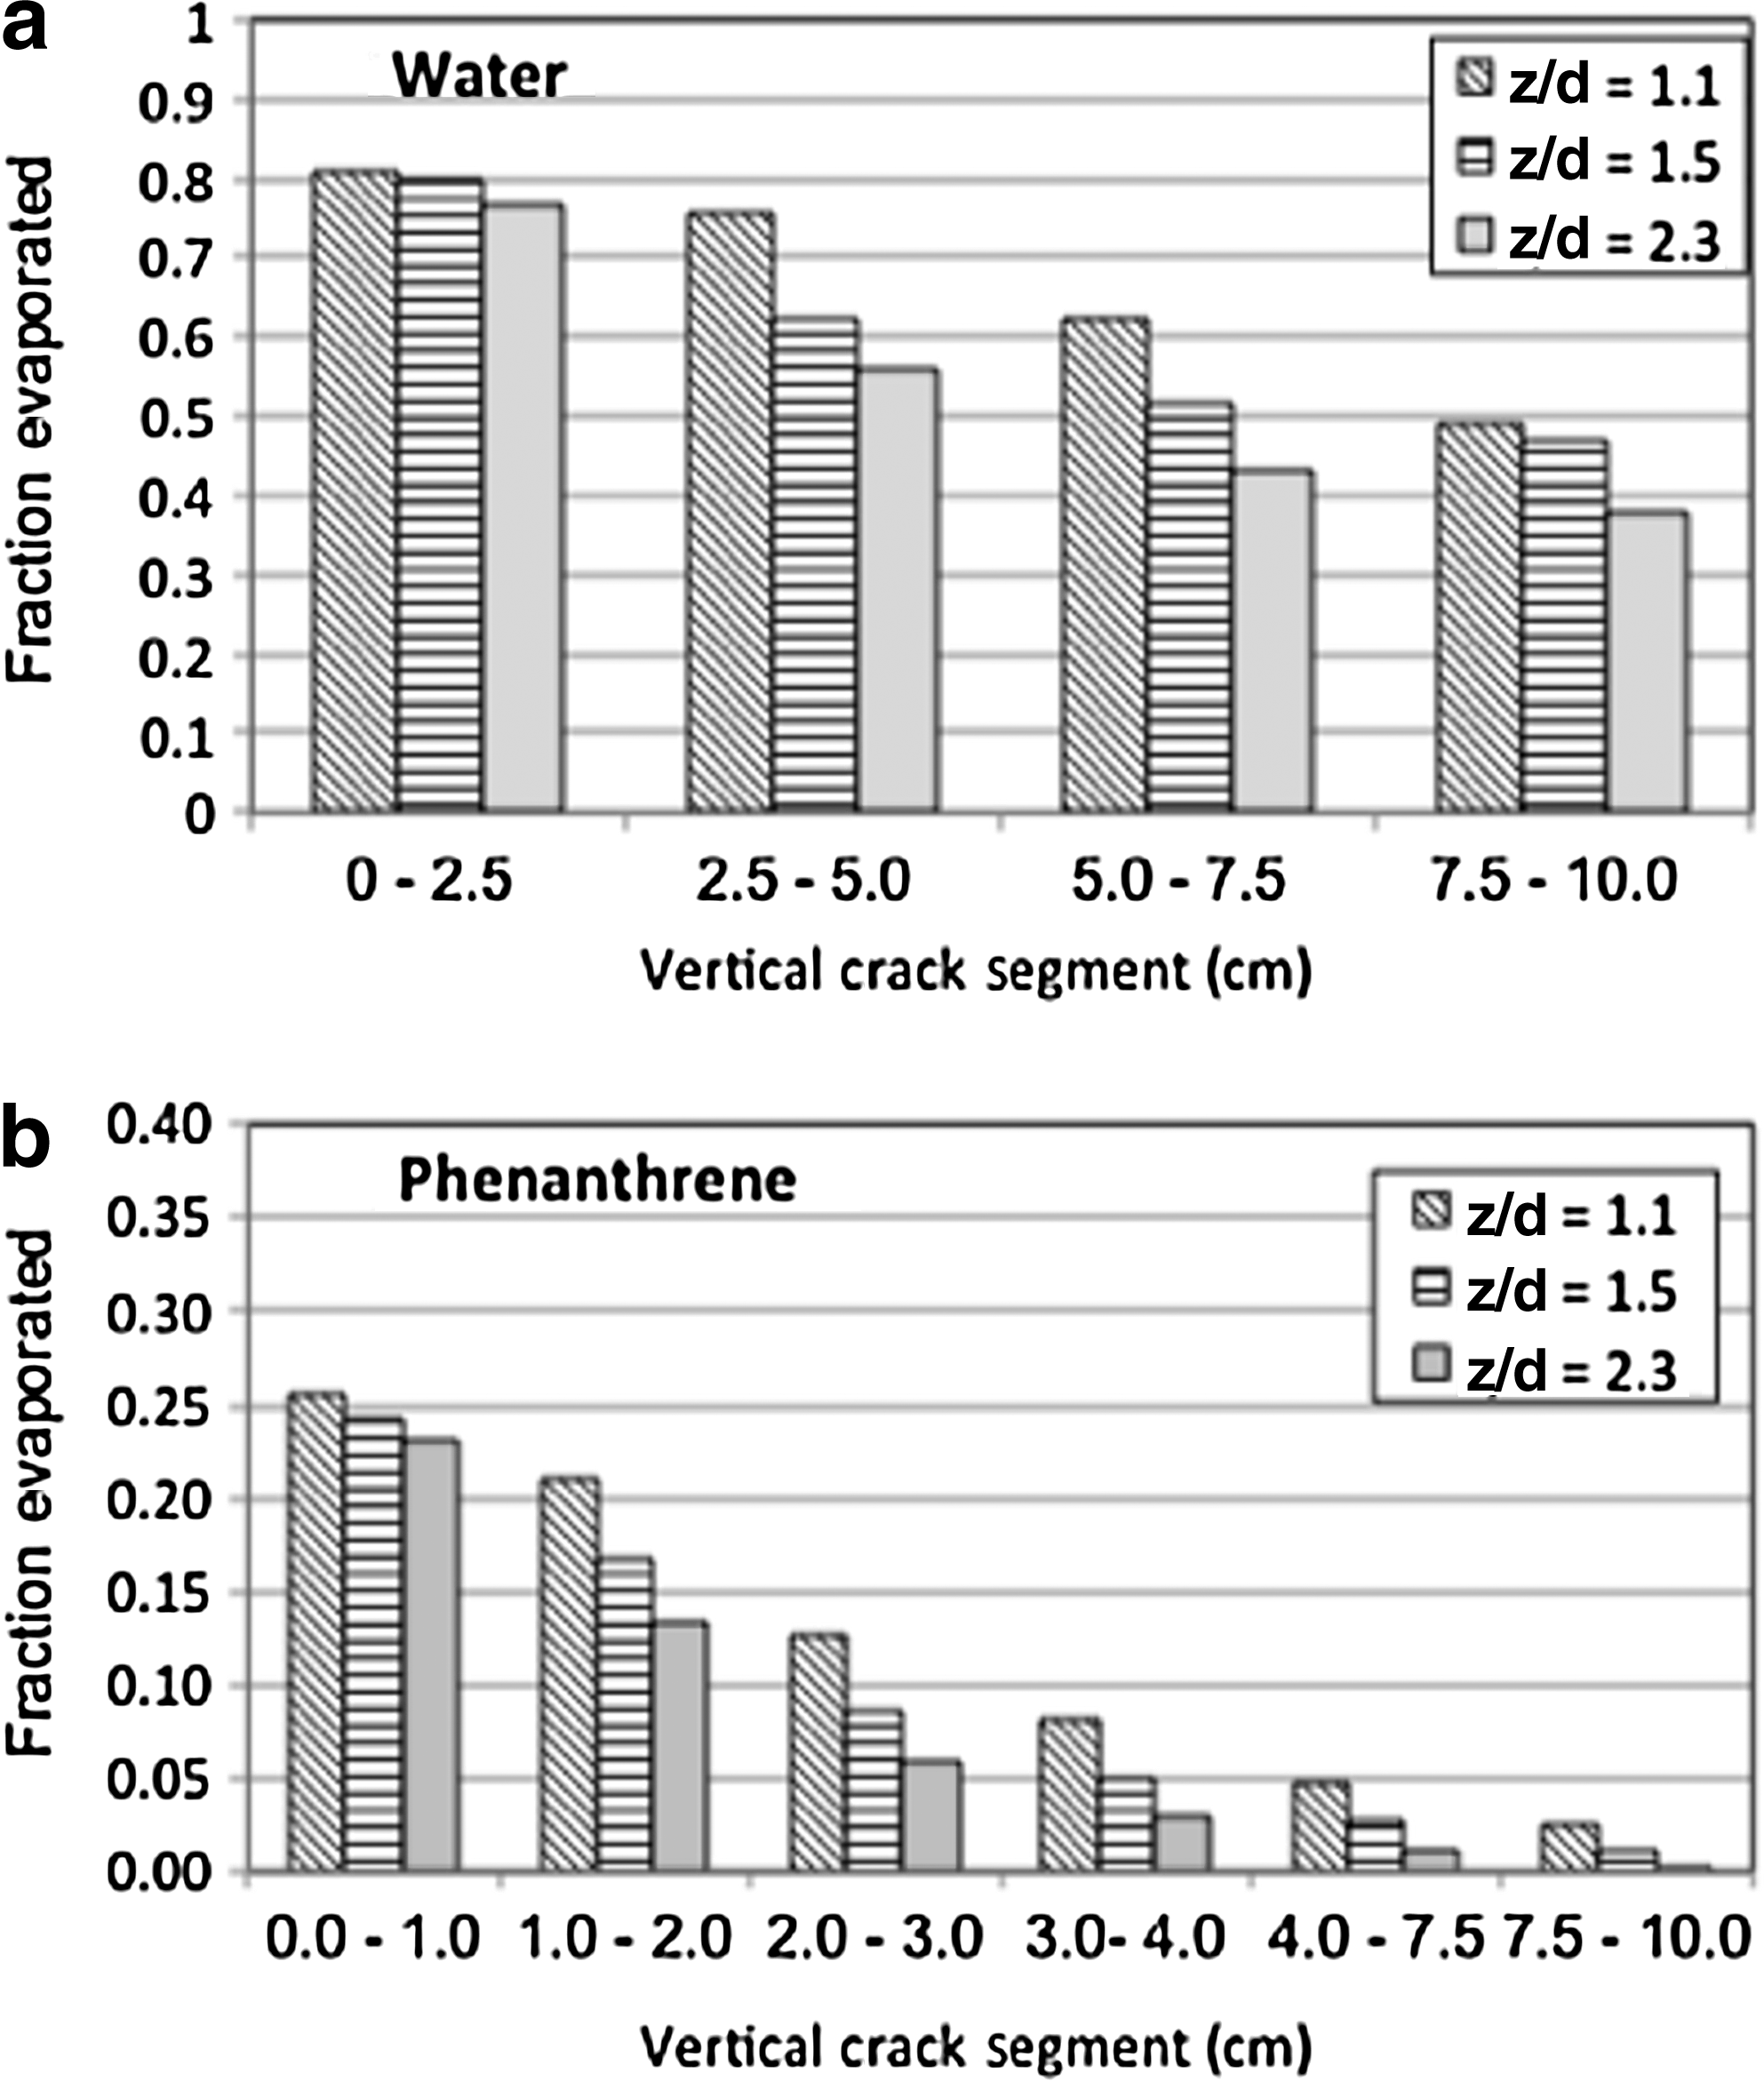
Sectioning profile in cracks:
Figure 4a–c shows the time-averaged flux of phenanthrene from the different crack aspect ratios for 1.6, 1.0, and 0.5 L/min air flow rates, respectively. The phenanthrene flux drops rapidly initially and slowly at longer times. This is observed for both the flat and the cracked surfaces. For the flat surface, this decrease indicates that the solid-side mass transfer resistance dominates after the initial period as surface depletion occurs. The solid-side resistance is influenced by the diffusion in the pore spaces retarded by adsorption on the solids. The initial flux for the flat surface was 4.46 ng/cm2 per hour, while the initial fluxes for the z/d of 1.1, 1.5, and 2.3 were 2.06, 1.38, and 1.04 ng/cm2 per hour, respectively, for a flow rate of 1.6 L/min. It is also observed that the values of the fluxes were lower for smaller air velocities. In comparison, the initial fluxes decreased by 9% for the flow rate of 1 L/min and by 14% for 0.5 L/min. For all the flow rates, the fluxes were lower for higher z/d. Though the trend is retained at higher times, the relative difference is smaller, indicating that as time progressed, the mass transfer resistance from within the crack dominated. This hypothesis is also supported by the observation that the flux in all the cases (including the flat surface) tends toward a common level. Figure 3b shows the relative fractional evaporative losses from cracked surfaces for a flow rate of 1.6 L/min.

Phenanthrene evaporation flux as a function of flow rate and crack aspect ratio.
Correlation with experimental data
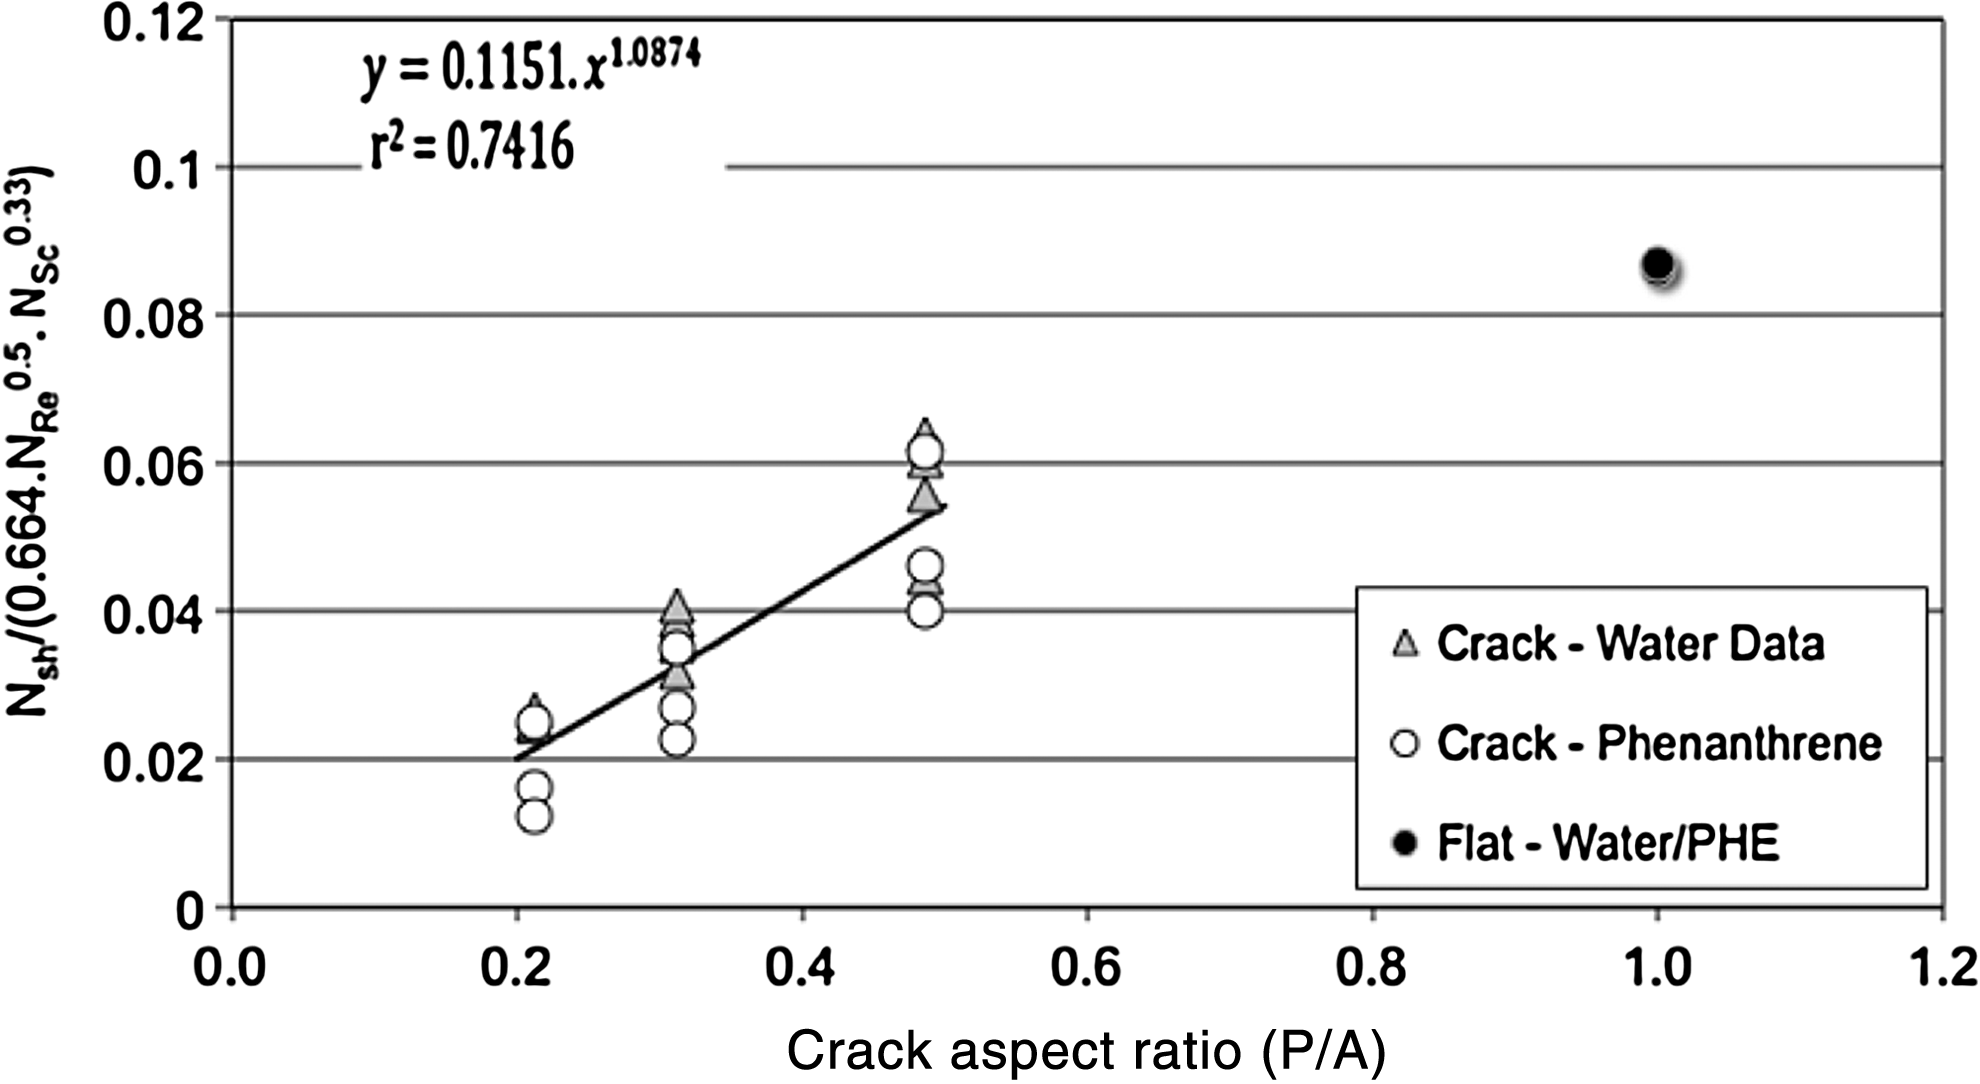
Figure 5 shows the correlation of P/A with
Correlation for mass transfer coefficient.
Based on the correlation shown in Fig. 5, the plot did not tend toward the laminar flow correlation
where α=0.1151 and β=1.0874. This correlation can be used to predict the overall mass transfer coefficient as applicable to evaporation from cracked surfaces when air flows across the mouth of cracks.
Computational fluid dynamics simulation
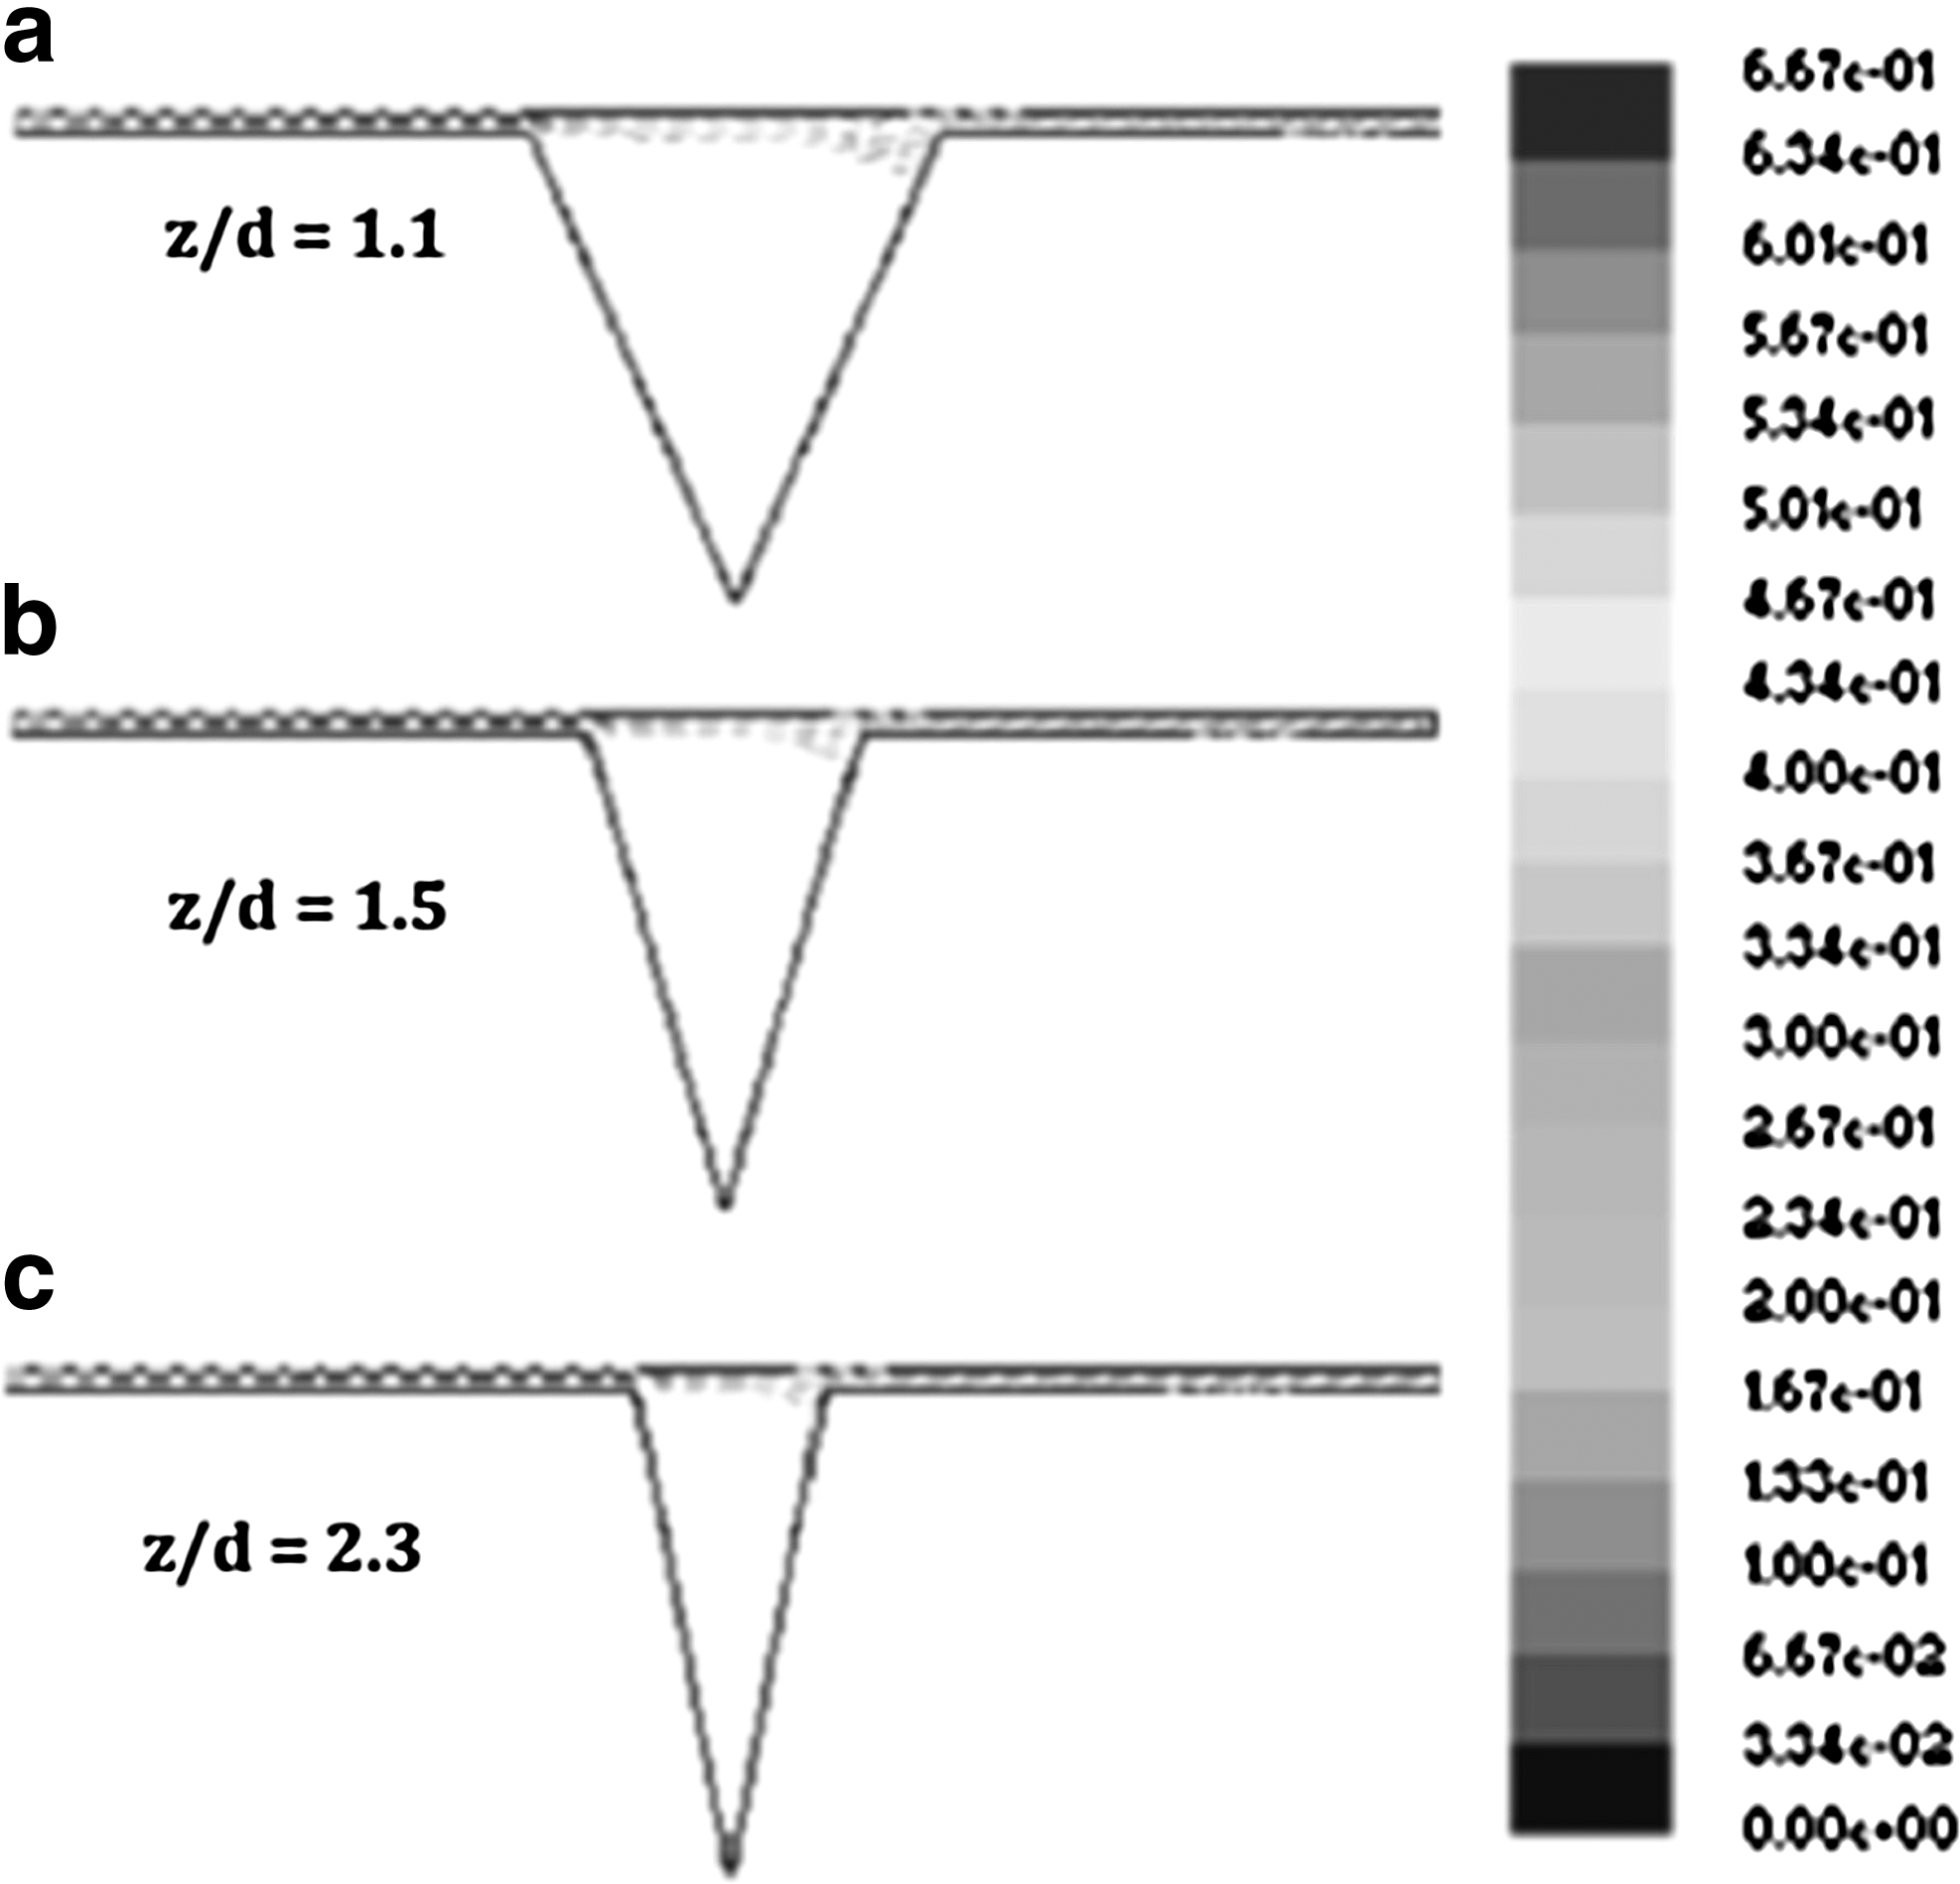
Computational fluid dynamics (CFD) simulations were used to visualize the air circulation within cracks under different conditions of crack aspect ratios and flow rates. A two-dimensional flow model using experimental inlet velocities was applied with a mesh size of 1 mm. Figure 6a–c shows the comparison of the CFD simulations in a simulated crack for a flow rate of 1.6 L/min for different crack aspect ratios, respectively. The quantity “δ” in Fig. 6a–c refers to the vertical extent of convection, indicated also by the lowest velocity streamline (shown just above the dashed line shown in each figure). The value of δ increases with increasing crack length, indicating that air penetration is higher with wider cracks. In the narrower cracks the entire streamline system shifts slightly toward the exit section. The effect of air flow rate is seen clearly with flow simulations performed at a much higher flow rate (13 L/min). Figure 7, representing these simulations, shows that δ reduces drastically. This indicates that, in a confined headspace, larger velocities do not induce deeper air circulation into a crack, which provides some insight into the response of flow within cracks.

CFD simulations of flow field at the mouth of crack at 1.6 L/min flow (velocity scale in m/s). Streamline immediately above dashed line represents zero velocity. CFD, computational fluid dynamics.
CFD simulations for a flow rate of 13 L/min.
Chemodynamic model
Equation (3) may be applied to predict vapor-phase mass transfer coefficient in a crack using a simple pseudo steady state model shown in Equation (4):
where
The first term on the right hand side of Equation (4),
Figure 8a–d shows the comparison of the simplified model [Eq. (4)] and experimental data for a case of phenanthrene flux. All model parameters (Table 1) were determined a priori, except for the air- and water-filled porosity of the thin earthen layer. For the case of evaporation from the flat surface, the values of the total, water-filled, and air-filled porosities were optimized for the best fit between experimental and model and were found to be 0.54, 0.49, and 0.05, respectively. These are reasonable estimates especially for the thin solid layers and relatively small time scales used in this study. For the flat surface, only the first term in Equation (4) was used and the laminar boundary layer theory correlation for the mass transfer coefficient was applicable (Valsaraj et al., 1999). The comparison for the flat surface is shown in Fig. 8a. The model comparison is reasonably good for all the cases. One observation is that as z/d increases, the model overpredicts the flux. This suggests that as the crack becomes narrower, there is more mass transfer resistance than what the model predicts perhaps due to the different region of convective influence. Also, the assumption of one-dimensional transport is perhaps not adequate to explain the behavior in such crack systems. Further studies must be conducted where a two- or three-dimensional transport evaluation must be performed. This demonstrates the usefulness of the CFD simulations in combination with the empirical correlation obtained for the estimation of emission fluxes from cracked surfaces.

Comparison of experimental and modeled flux.
Conclusions
Experimental data essentially show that emission from a wider crack is greater than that from a narrower crack and is further corroborated by the CFD simulations. A correlation based on the laminar boundary layer mass transfer correlation was obtained using the flux data for both water and phenanthrene. The correlation reasonably extrapolates to experimental observations from a flat surface. The CFD simulations and the correlation provide means to model chemical evaporation from within a crack. The simplified chemodynamic model combined the CFD simulation results and the mass transfer correlation to obtain a reasonable estimate of emission from cracked surfaces. Further CFD simulations may be conducted using a rigorous transport model to generate equivalent mass transfer coefficients.
Footnotes
Author Disclosure Statement
No competing financial interests exist.