
Abstract
Abstract
Rapid urbanization imposes significant pressure on land resources and land use structures and leads to many serious socioeconomic and environmental consequences. In contrast, there has been inadequate attention to application of comprehensive studies using environmentally focused urban development approaches. This fact with inaccuracies associated with spatial and nonspatial data layers necessitates adoption of a structured and insightful approach in the assessment procedure. In this article, a geographic information systems–based spatial analysis and an appropriate model for urban land use decision making, combined with uncertainty analyses, are implemented. The assessment draws on the capabilities of multicriteria evaluation, sensitivity analysis, Monte Carlo simulation, and probability classification methods. Results show the usefulness of these methods as an approach to handling uncertainties in land use planning procedure. The method also provides a soft medium to negotiating among different decision makers when they disagree on data accuracy and claim that this may affect the end results, namely, the selected sites. This helps in deciding on the location and quantity for development of new urban areas, because it is possible to find a common denominator that is agreed by all the stakeholders. As results are systematic and reproducible, the approach can be used for other land use planning procedures in order to reduce the negative consequences of imbalanced and controversial land development.
Introduction
According to the literature, many studies of urban land use management have been conducted over the past years (including Awad and Ela, 2003; Svoray et al., 2005; Taleai et al., 2007; Yang et al., 2008; Adhvaryu, 2010; Pütz, 2011; Zhang et al., 2011), but the successful integration of uncertainty analysis into these studies has often been overlooked or only touched on the surface. There are some applications of uncertainty analysis in different fields. For instance, Yeh and Li (2006) discussed errors and uncertainties in urban cellular automata for modeling complex urban systems and simulating urban dynamics, and Chen et al. (2011) developed an uncertainty analysis module for use within a geographic information systems (GIS)–based multicriteria analysis tool for catchment management. Chen et al. (2010) also presented a novel approach for examining multicriteria weight sensitivity of a GIS-based multicriteria decision making (MCDM) model and Convertino et al. (2012) quantified the epistemic uncertainty in the species distribution modeling. Linkov and Burmistrov (2005) provided a unique international forum for assessing the relative contribution of different sources of uncertainty associated with environmental modeling to predict contaminant accumulation in forest ecosystems and later Linkov et al. (2009) reviewed recent applications of weight of evidence used in human health and ecological risk assessment. Palme et al. (2005) ranked technical options of sludge handling using uncertainty assessment, among other methods.
Some examples of the use of Monte Carlo simulation in environmental management include exploration of the interactive impacts of land use and climate change on runoff characteristics (Samaniego and Bárdossy, 2006), sensitivity analysis to investigate the irrelative impacts of variation in decision weights on rank ordering of the potential sites for landfill site selection Chang et al. (2008), hydrological Monte Carlo simulation model (Jones et al. 2009), and second-order Monte Carlo uncertainty analysis for salmonid survival risk assessment (Wu and Tsang, 2004). Moschandreas and Karuchit (2002) also used Monte Carlo simulation to quantify health risks associated with exposure to pesticides. Also, application of other methods such as Dempster-Shafer theory can be seen in service management (Sikder and Gangopadhyay, 2007), landslide hazard mapping (Tangestani, 2009), fuzzy wilderness mapping problem (Comber et al., 2010), sustainable transport measures (Awasthi and Chauhan, 2011), forest management (Varma et al., 2000), silvicultural decision-making (Ducey, 2001), environmental impact assessment problems (Wang et al., 2006), and urban power network planning (He et al., 2011). However, the review of the literature reveals few efforts devoted to handling uncertainty in urban land use planning, especially in Iran where objections to data quality, data uncertainty, and their effects on final decision are common. This often leads to unsuccessful implementation of the plans and unsustainable results. In addition, the application of Monte Carlo simulation and probability classification in uncertainty analysis of land suitability assessment are rarely seen in the literature. Application of these approaches can be showcased in urban land suitability assessment where considering inherent random and systematic errors in the layers employed is necessary to achieve a consensus on the best lands for urban development. This can be specifically useful where there are several sources of uncertainty that interact to produce an outcome. Paying inadequate attention to these studies normally produces conflicts among decision makers and jeopardizes the outlook of arriving at sustainable plans.
In topical issues such as urban development plans, objections from the part of different stakeholders are common in Iran. One solution is provision of more and more accurate data, which needs more time and money, and the other is consideration of soft approaches such as uncertainty management as described in this article. Normally, the latter is cheaper and easier to implement. As such, this article attempts to exemplify the application of uncertainty for urban land use planning. If successful, this can be presented as a formal part of the land use planning system for other sectors. Finally, a comprehensive approach using the concept of Monte Carlo simulation and probability classification is proposed for formulating urban land use strategies to improve urban sustainability. Here we roughly equate sustainability with less conflict in the results and higher consensus among decision makers. The resolution of the conflicts can also be achieved through recognition and application of errors in data and models used. We apply the approach to Tehran Province as a topical area of continuous developments and conflicts among stakeholders.
Experimental Protocols
Study area description
Tehran Province is one of the 31 provinces of Iran, with a total area of 12,981 km2. It is located to the north of the central plateau of Iran, spanning over 34°–36°5′N and 50°–53°E (Fig. 1). Its population is ∼13 million people, and the province includes ten cities. Tehran Province is the richest in Iran and contributes ∼29% of the country's gross domestic product. Furthermore, it houses ∼18% of the country's population. Tehran Province has over 17,000 industrial units, employing 390,000 people—26% of all units in Iran—indicating the level of conflict that may arise during normal development of the area (Iranian Census Center, 2012).
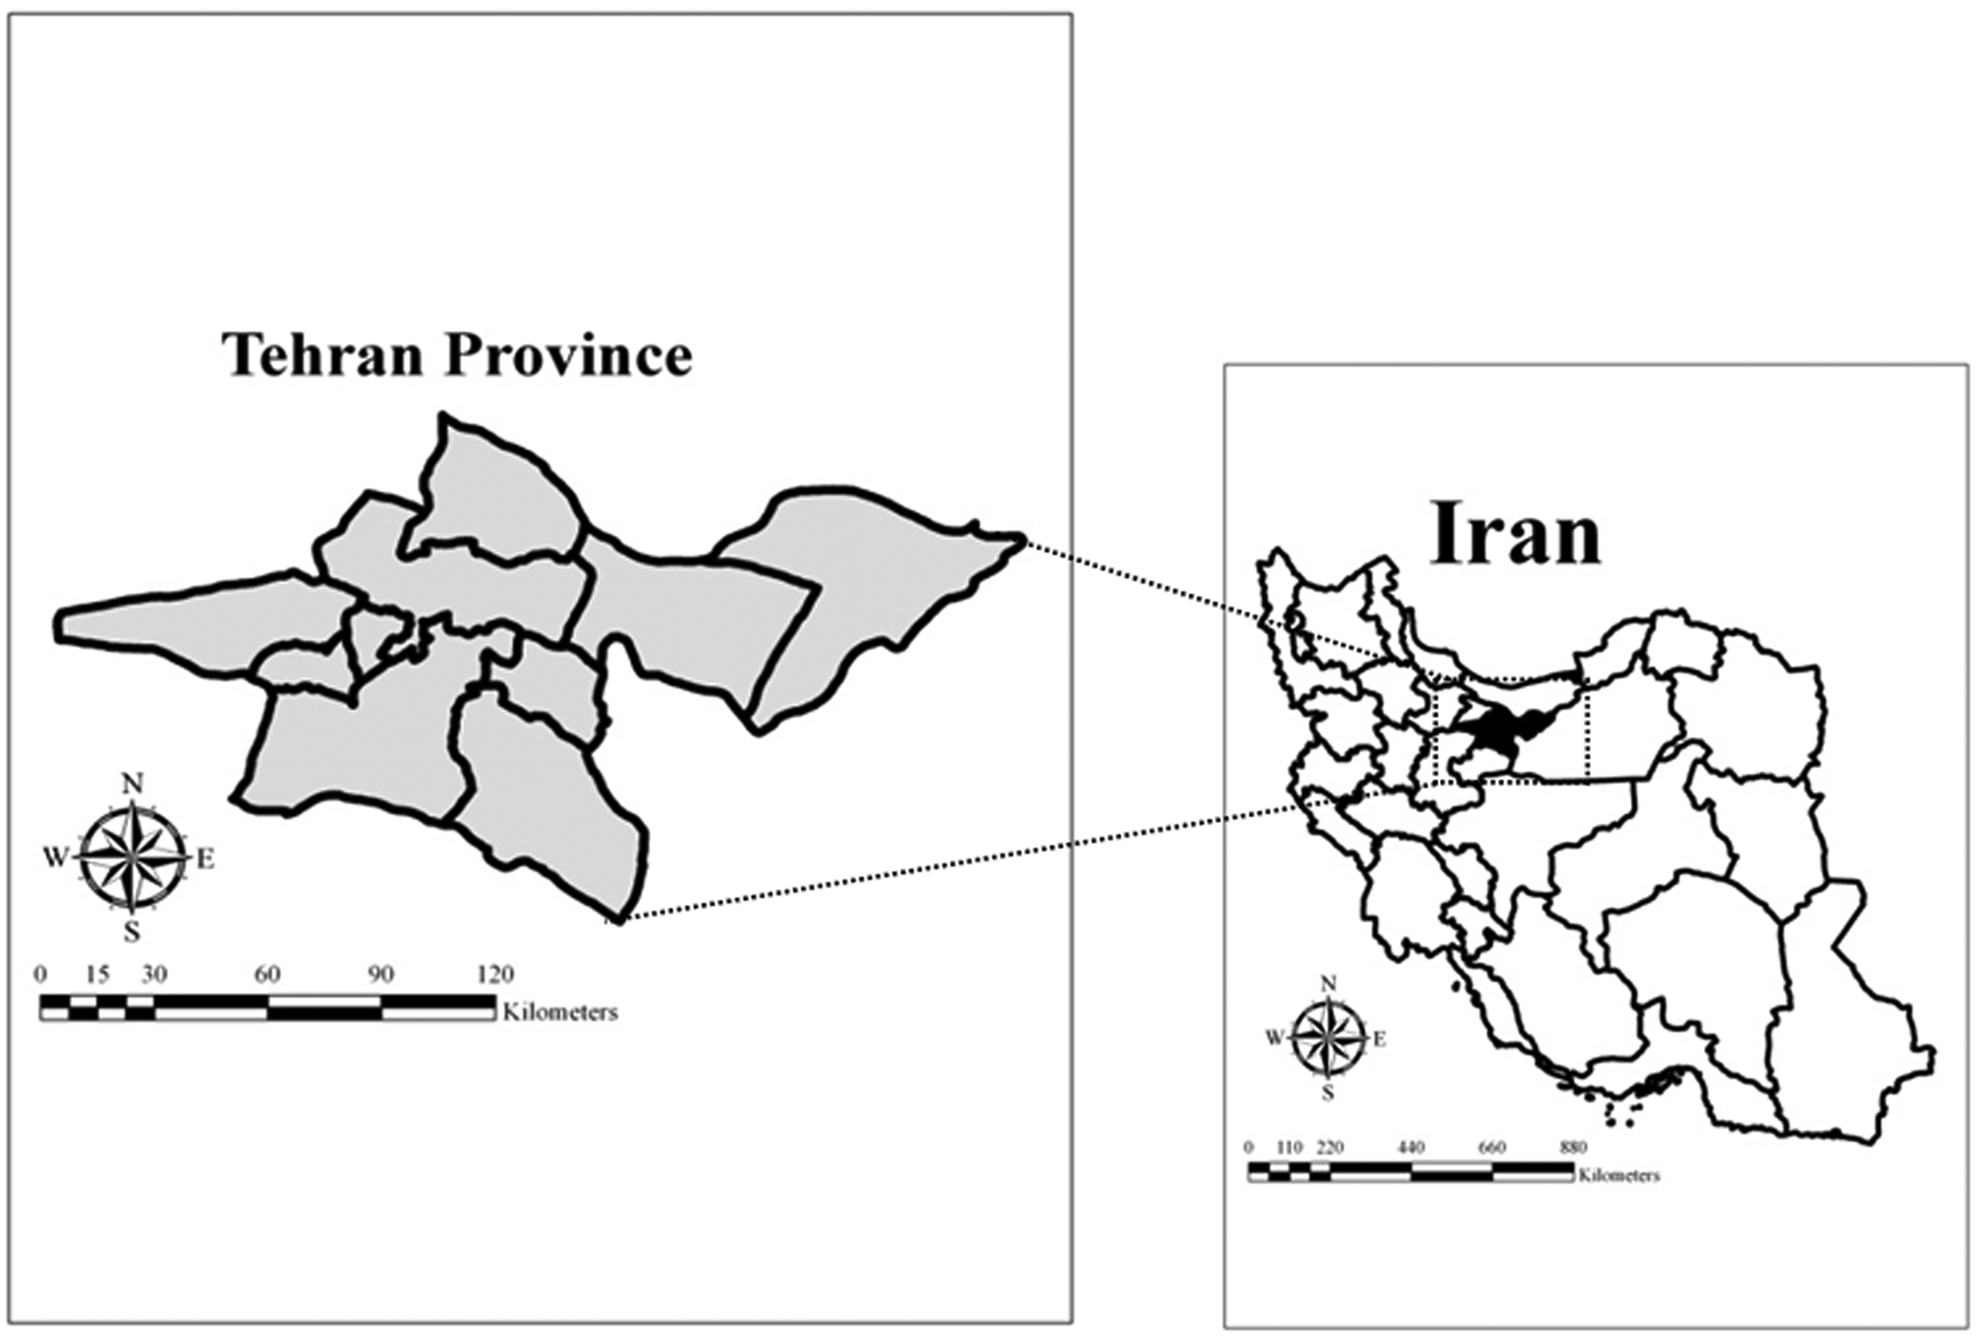
Location of Tehran Province.
Land evaluation process
According to the FAO (1976) guidelines, the land evaluation process for urban area can be divided into three steps: (1) selection of the evaluation factors that are deemed to have first-hand effects on the suitability of the required development, (2) modification and standardization of the factors, and, finally, (3) factor combination. We have taken the same procedure here and describe the steps as below. The novelty of this research lies in the integration used for handling uncertainty in urban land suitability assessment with the aim of reaching a sustainable urban development plan while minimizing interested parties' disagreement arising from inaccuracies in data. The latter issue has proved to be problematic in Iran in situations where stakeholders object to the quality of the data used for urban site selection. The general flowchart of the steps taken in this study is shown in Fig. 2.
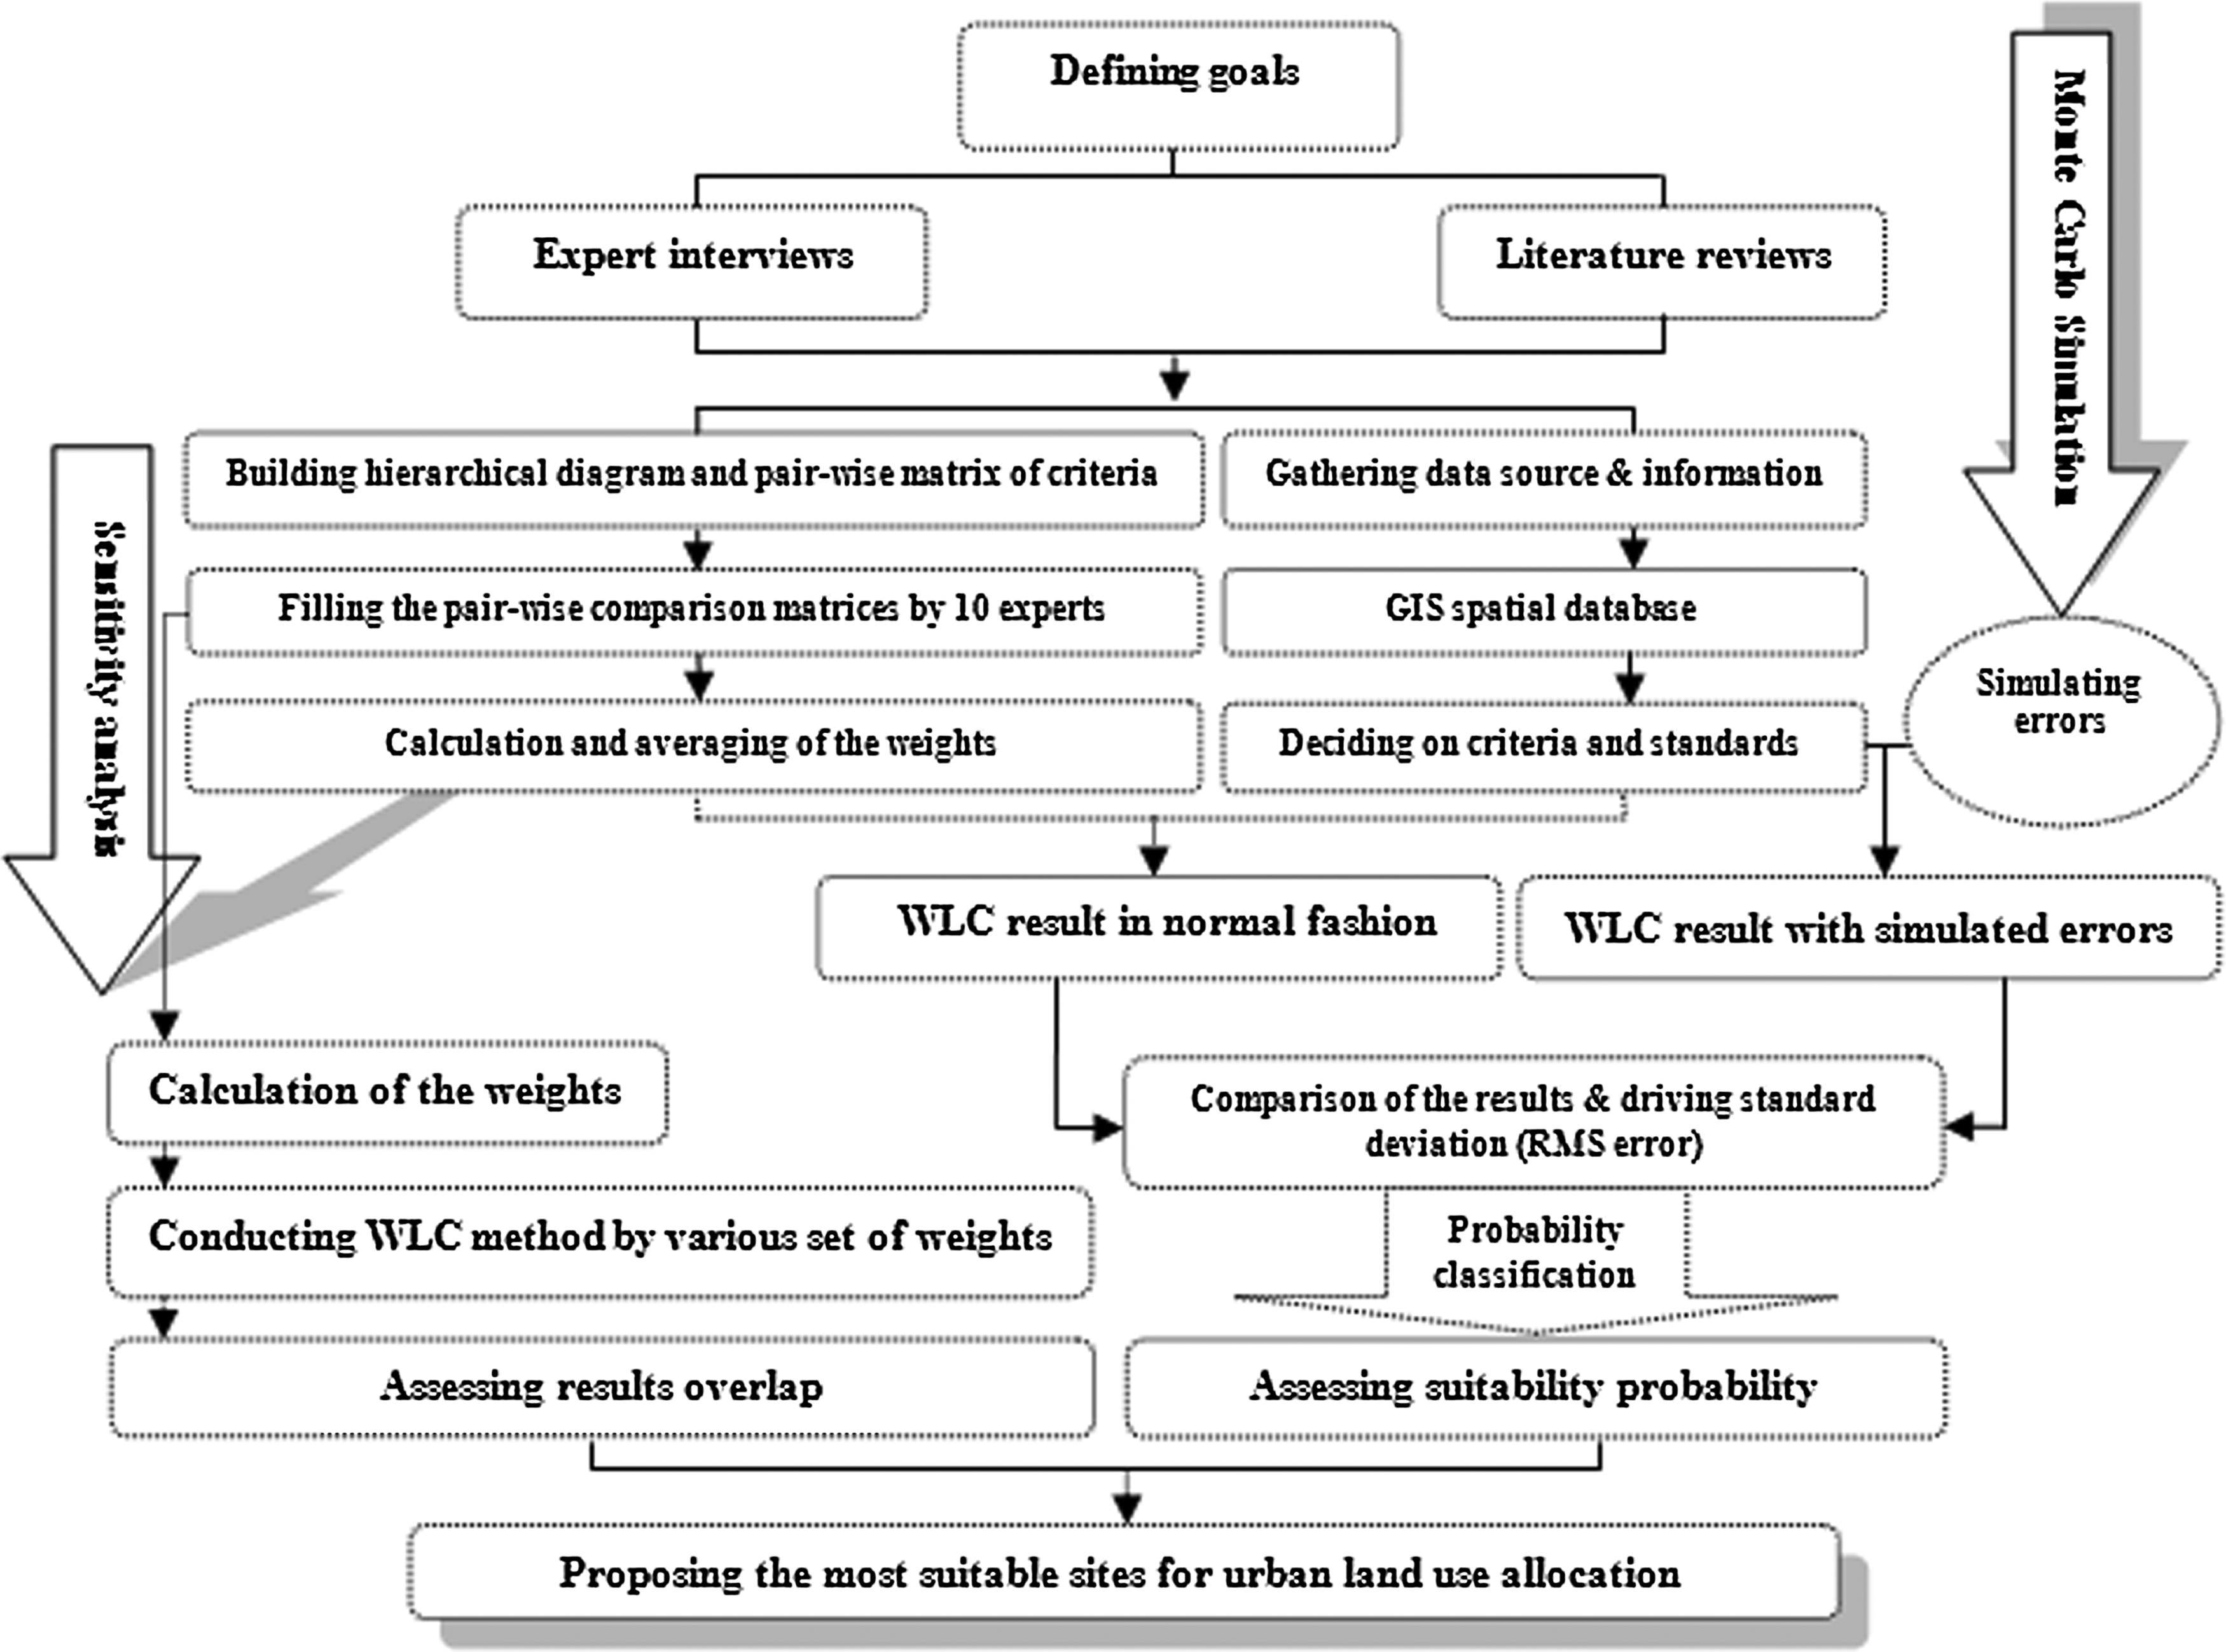
General flowchart of the study. WLC, Weighted Linear Combination.
Data preparation
Factors
Urban land-use suitability can be influenced by a large number of environmental, economic, and social factors. After literature reviews and discussions with researchers and local experts, the criteria for an integrated urban land-use suitability assessment in Tehran Province were selected from a long list that included natural and ecological attributes, and socioeconomic factors. Clearly, each criterion should be carefully chosen with respect to the local conditions. Totally, 15 factors including main criteria and their subcriteria were selected for the assessment (Table 2). The criteria selection was backed by discussions with researchers and local experts and comprehensive literature review that included Merwe and Hendrik (1997), Ahsan (2003), Makhdoum (2003), Karam (2005), Tofigh (2005), Svoray et al. (2005), Mansor et al. (2006), Monavari and Tabibian (2006), Abasspour and Gharaguzlu (2006), Liu et al. (2007), and Lotfi et al. (2009). In the next stage, a standardization process of the factors to a continuous scale and a byte-level range of 0–255 by the user-defined fuzzy set membership function were implemented.
Constraints
Constraint layers show absolute unsuitability for the development at hand. Constraints serve to exclude certain areas from consideration. Restricted areas in this study are those inhibited by legal requirements and laws, attributes drawn from the literature reviews, protected areas, and hazard zones to avoid risks. Each of these constraints was buffered according to the legal limitations and severity of the hazard. The restricted areas are protected strictly and not allocated to urban land use. By implementing Boolean logic, a value of one was assigned to cells available for development, while unavailable cells received a zero-value and were excluded in this fashion. Table 1 portrays the list of constraint layers.
Analytical hierarchy process
In a multicriteria analysis, normally factors are given various weights to imply their importance and their share in the final suitability ranking. The technique implemented here is the pair-wise comparisons developed by Saaty (1977) in the context of a decision-making process known as the analytical hierarchy process. Using this method, a matrix is developed in which every criterion attains a value based on its importance in relation to all other criteria (Saaty, 1980). As such, we provided a matrix of 15×15 criteria to be filled by 10 urban experts and decision makers. Working with matrices of 15-by-15 criteria for urban land use is completed by examination of the experts' consistency in developing each matrix. Using Saaty's method (1980), this examination was carried out as follows. To determine the overall weight of each index, the normalized weights were integrated in each column of the matrix and then a consistency relationship (CR) was calculated. To begin with, the weighted sum vector was calculated by multiplying the overall weight of each criterion by the pair-wise comparison score of each cell in the matrix. Next, the consistency vector was determined by dividing the weighted sum vector by the relevant index weight. This step was carried out for all criteria. Following that, lambda (λ), which is defined as the average consistency vector, was calculated. The consistency index is based on the assumption that λ is always larger than or equal to the number of criteria in matrix (n) for positive and reciprocal matrices and λ=n if the pair-wise comparison matrix is consistent. The subtraction of n from λ expresses the level of consistency deviation (or the level of inconsistency). The measurement can be normalized by means of Equation (1).
Next, the CR was calculated by means of Equation (2).
RI is the random index (Saaty, 1977), and is a constant that depends on the number of criteria in the matrix. In our case, with 15 criteria, the appropriate value of RI is 1.57. According to Malczewski (1999), CR values <0.1 indicate a sufficient level of consistency. In our study, the consistency ratio was <0.1 for all the pair-wise matrices. Based on the hierarchy structure (Table. 2), the relative importance of factors was analyzed according to the advice given by 10 urban experts and decision makers. Then, by averaging the weights of each factor derived from each pair-wise matrix, the single rank of each factor was determined. Table 2 shows the average weights.
In order to accommodate different values and beliefs of the experts and decision makers, we also changed weights systematically assessed and their effects on the final outcome to extract the interests of the parties involved. This can be considered as an approach for examining multicriteria weight sensitivity of a GIS-based MCDM and for exploring the dependency of model output on the weights of input parameters.
Urban land suitability assessment
Once the importance weights for each criterion have been attained, the assessment needs to be implemented over the entire study area. The Weighted Linear Combination is a common approach in MCE that can easily accommodate the application of Monte Carlo simulation and probability classification in land suitability assessment. It requires the decision maker to directly specify the number of constraints and the weights (preferences) of the criteria. Thus, the total value of land use suitability for one assessment unit is calculated using the following equation:
Where S is the integrated evaluation value of grid i, wi is the weight for factor i, and xi is the value of factor i, Π is product, and cj is criterion score of constraint j (Eastman, 2006). Π is used here in addition to the multiplication symbol to show that first all the constraints are multiplied together and then the result is multiplied to the left part of the equation. The result of conducting Equation (3) is shown in Fig. 3.
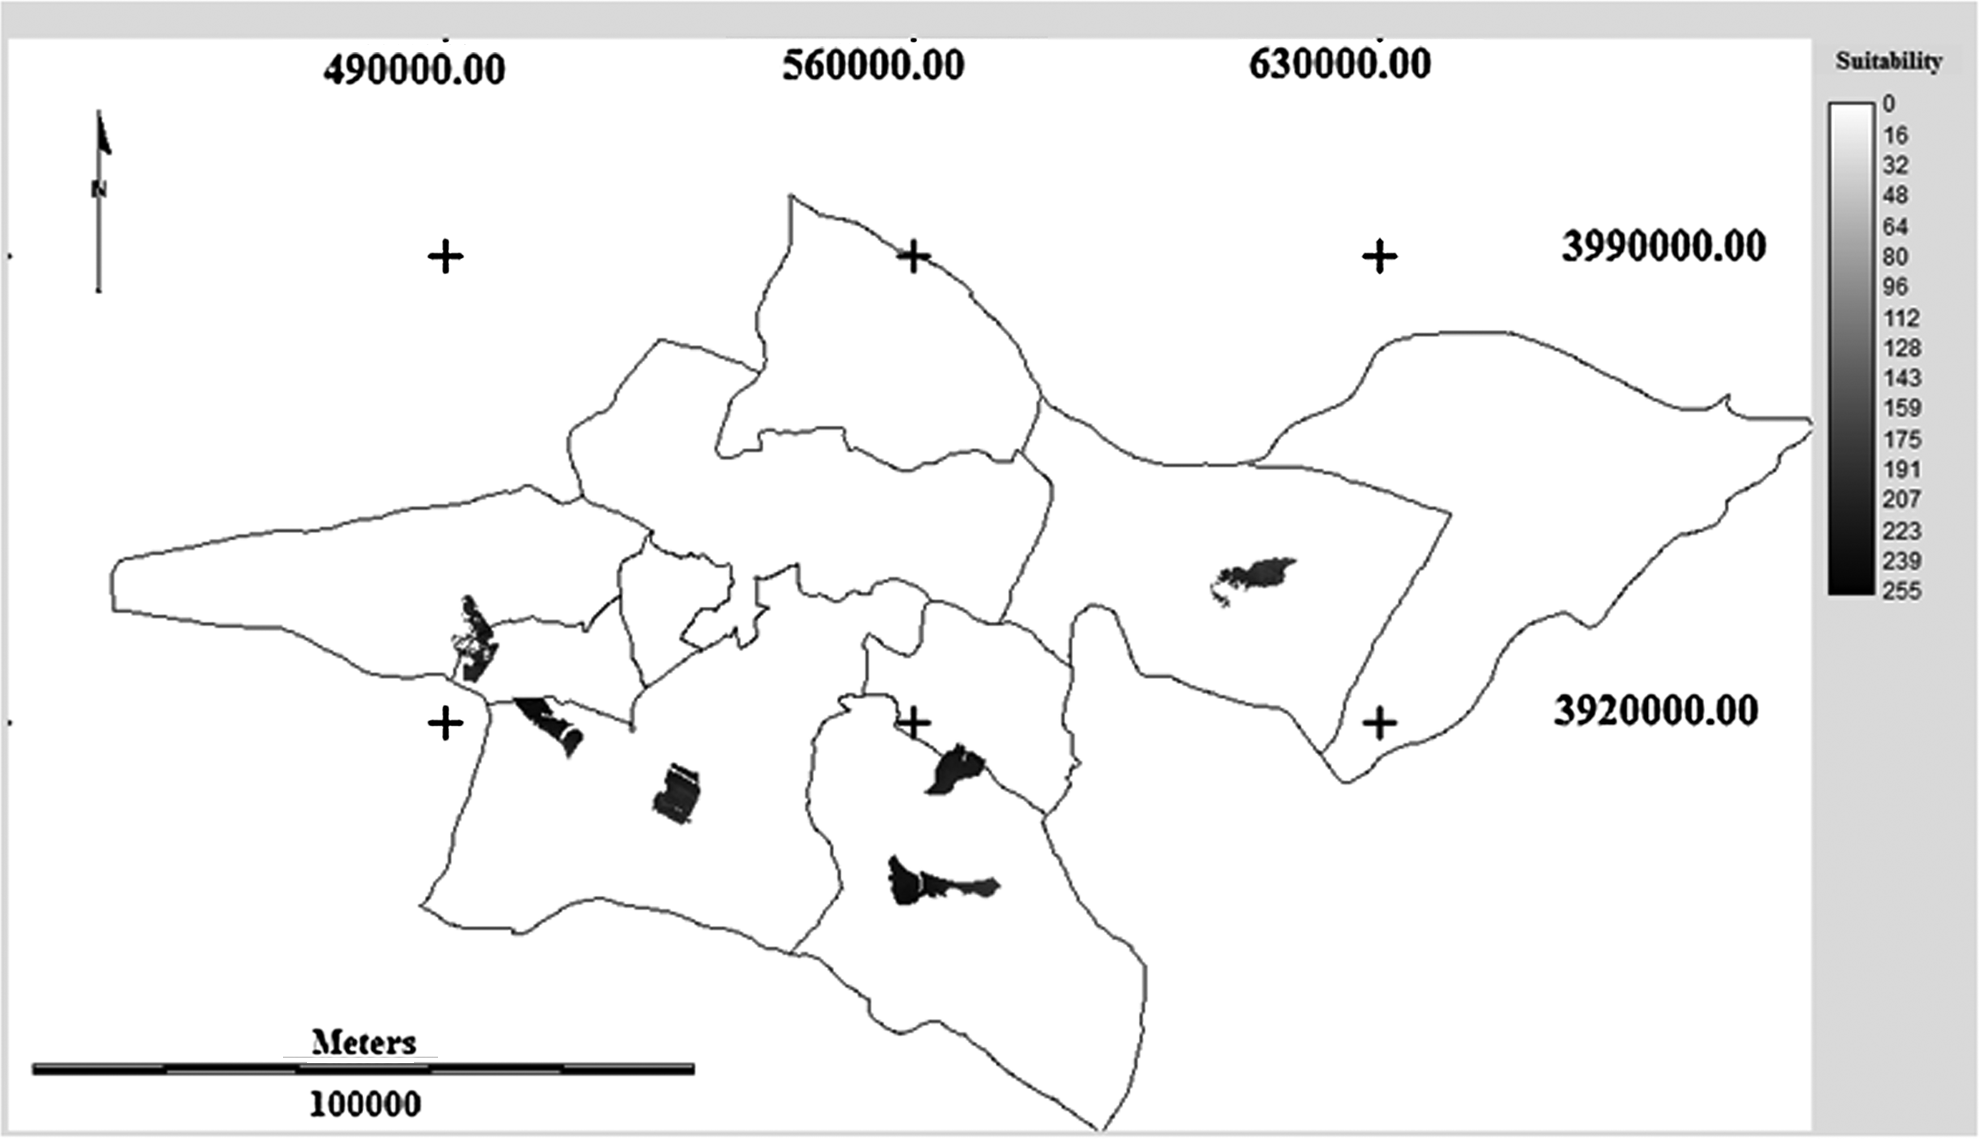
Result of conducting WLC method. The darker the area, the more suitable it is.
Uncertainty analysis
Uncertainty analysis calculates the impact of uncertain parameters and decisions on the final outcomes of decision making. The Monte Carlo method is just one of the many methods of analyzing and documenting uncertainty, where the goal is to determine how random variation, lack of knowledge, or error in data affects the sensitivity, performance, or reliability of the system that is being modeled. Monte Carlo simulation is especially helpful when there are several different sources of uncertainty that interact to produce an outcome (Eastman, 2006). It can perform risk analysis by building models of possible results by substituting a range of values (a probability distribution) for any factor that has inherent uncertainty.
Monte Carlo simulation
The uncertainty assessment and management undertaken here involves application of Monte Carlo simulation, using the resultant root mean square (RMS) error in probability classification of the suitability map. In the analysis of error propagation through Monte Carlo simulation, we simulated the effects of error in each of the data layers to assess how it propagates through the analysis. In this way, the analysis was run twice, first in the normal fashion and then a second time using data layers containing the simulated error, satisfying views of the stakeholders and ensuring their participation. By comparing the two results, the effects of the error were assessed. The only reason the two resultant layers differ is the error introduced. In order to assess the effects of errors, a difference image was attained through simple overlay of the resultant suitability maps. Then, a histogram examination of the difference image was conducted to see the distribution of the errors. According to Eastman (2006) with a normally distributed result, the standard deviation of the difference image can be used as a good indicator of the final RMS error. We also used the probability classification to estimate the probability that each value in the image lies either above or below a specified threshold (Eastman, 2006). This was achieved through measuring the area delimited by that threshold under a normal curve with a standard deviation equal to the RMS (Fig. 4). The method assessed the probability that any pixel in an image exceeds or is exceeded by a specified threshold value.
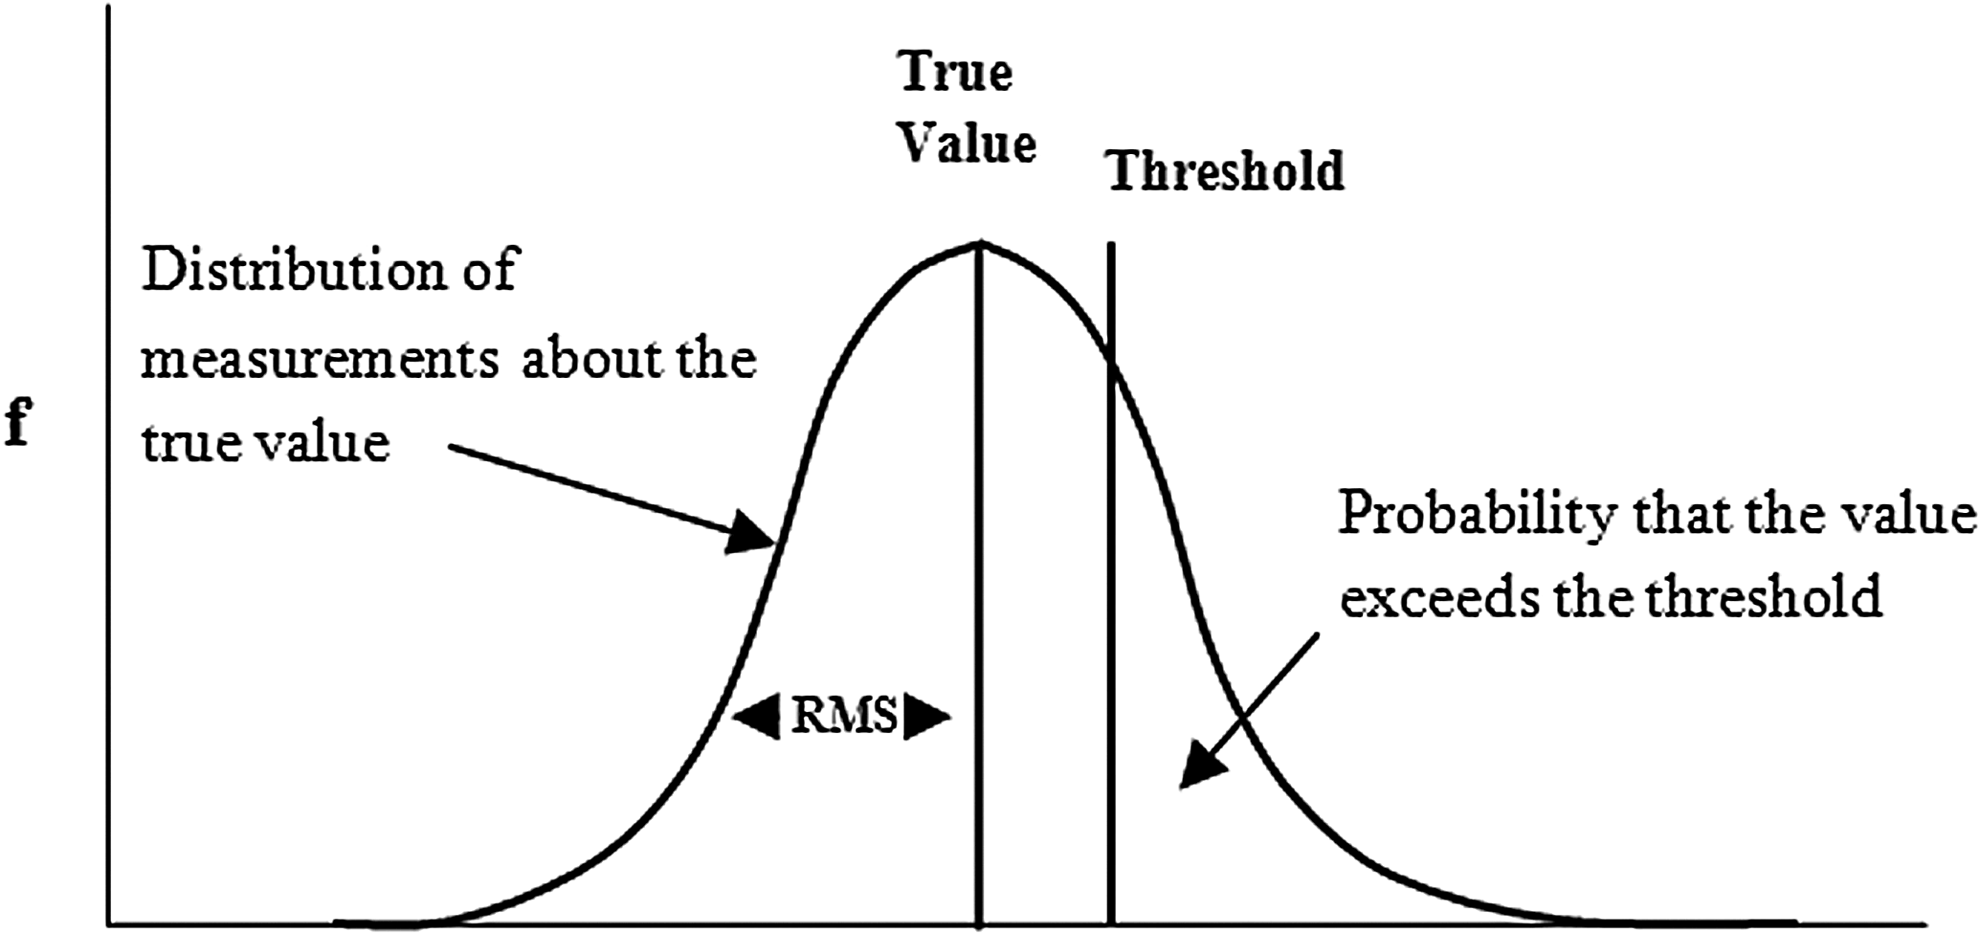
Using root mean square (RMS) error in determining probability classification.
Sensitivity analysis
In the second simulation, sensitivity analysis using Monte Carlo simulation was performed by variation of the decision weights that were provided by 10 urban experts and decision makers to investigate the relative impacts of changing criteria weights on the final outcomes. Hence, the decision weights from each of the experts were systematically applied and the overlap among them studied. In this way, it was possible to delimit areas where the results of the experts' weights were similar and where they were different. This helped to pinpoint the most suitable sites based on the highest overlapping areas when weights given by all of the experts were considered. It also helped us to determine the dependency of the model outputs on the weights of input parameters. Here again, we could provide a medium for stakeholders participation and achieving consensus among them.
Results and Discussion
The result of urban land suitability assessment using Equation 3 and normal data layers is shown in Fig. 3. As it is shown in this figure, some suitable sites were recognized in southern and central parts of the province.
Monte Carlo simulation
As probability distribution is a much more realistic way of describing uncertainty in variables of a risk analysis, we generated random values and added them to quantitative factors. The accuracy of the various data layers was first determined through referring to the documents prepared by the organizations generating these data. Hence, if, for example, ±10 m accuracy had been reported, we applied a random error of normal distribution within ±10 m with a mean of 0 m and a standard deviation of ±2 m. For the qualitative data, the accuracy referred to the boundaries of different features for which we designed algorithms that moved the features within the reported accuracy. The result is not meant to have any specific claim to reality—just that it contains error of the same nature as that believed to exist in the original. The amount of error that has been introduced to each layer through Monte Carlo simulation is shown in Fig. 5. According to Eastman (2006), Monte Carlo simulation relies upon the use of a very large set of simulations to derive its characterizations. In cases such as this where each cell provides a new simulation, the total composite of cells can provide such a large sample.
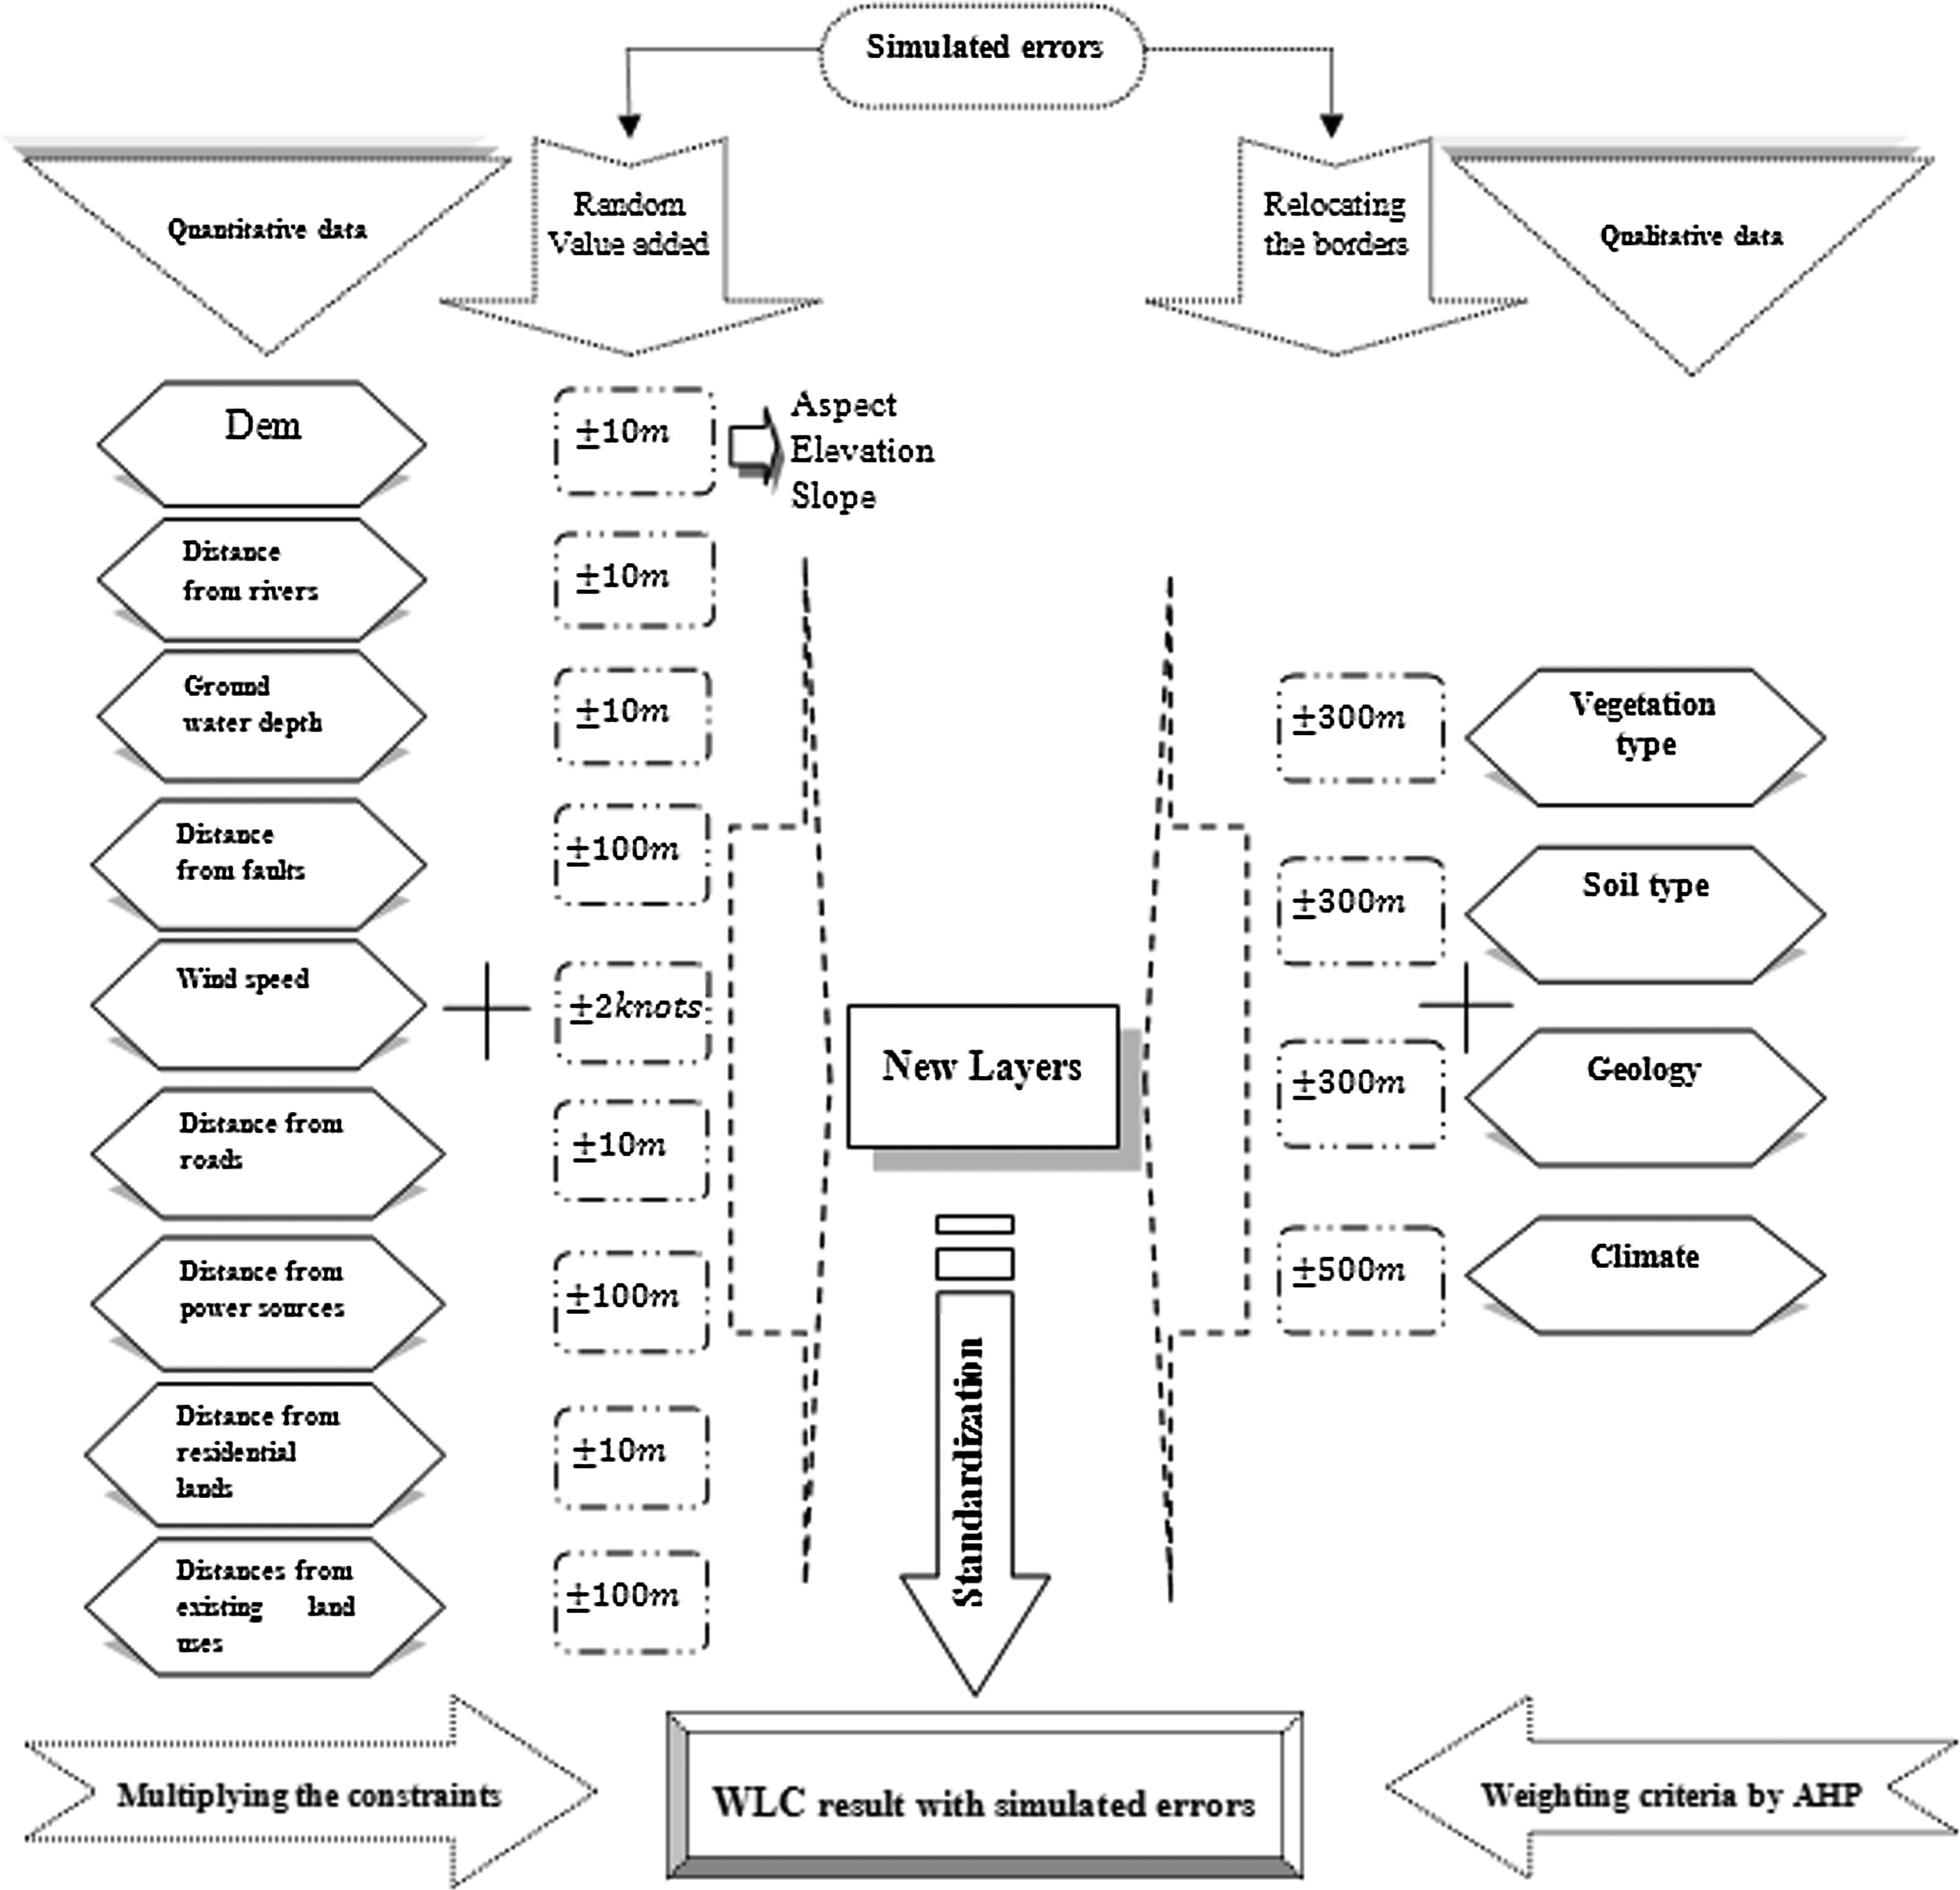
Flowchart of simulating errors in each of the layer. AHP, analytical hierarchy process.
So, the analysis was run two times, first normally (the result of which can be seen in Fig. 3), and then a second time by simulated error (Fig. 6). As it is shown in Fig. 6, with introducing the simulated error, more areas were found suitable for urban development, which is due to the relaxation of quantitative criteria value distribution and relocation of qualitative criteria borders. This stage can show how inaccurate the results will be when the process is based on poor and invalid data.

Result of conducting WLC method using data layers containing the simulated errors. The darker the area, the more suitable it is.
By comparing the two results (with and without simulated error), the effects of the error were assessed. The standard deviation of the difference image (37.35) was computed and used as the RMS error of our integrated MCE of the area for urban development. With the estimate of measurement error and an analysis of its propagation now available, the probability classification was used to determine a final decision in full consideration of the decision risk that the uncertainties present. The probability classification result is a probability map, with continuous values from 0 to 1, exhibiting the likelihood that each area belongs to the decision set. In Fig. 3, we just showed the suitable lands for urban land development, but by introducing the simulated errors to the layers and conducting multicriteria analysis, we obtained the RMS error, which is crucial in considering measurement error and its propagation in the analysis. Finally, with probability classification module and by considering RMS error, we obtained a soft equivalent of a hard reclassification operation.
With the continuous probability map, a final decision is made by reclassifying the probability map according to the level of decision risk (Fig. 7). For example, Fig. 7c shows areas with 70% probability of being suitable for urban land development. It means that the data cells have 70% chance of being suitable for urban development, or conversely, a 30% chance of being unsuitable. As it is shown, by increasing the accuracy probability, the number of zones that are selected becomes smaller. In this way, we can perceive the decision risk that is involved across an entire surface. In this manner, it is possible to change the hard traditional GIS decisions into soft probabilistic results—to talk not of whether an area is suitable or not for land allocation, but of the degree to which it is suitable. This would then allow a final hard decision to be developed based on the level of risk is the group of decision makers are willing to assume. In this way, the decision makers can easily decide only on those lands where the likelihood (or possibility) of a land suitability is much more desirable. Thus, the most suitable sites can be introduced for sustainable land development.
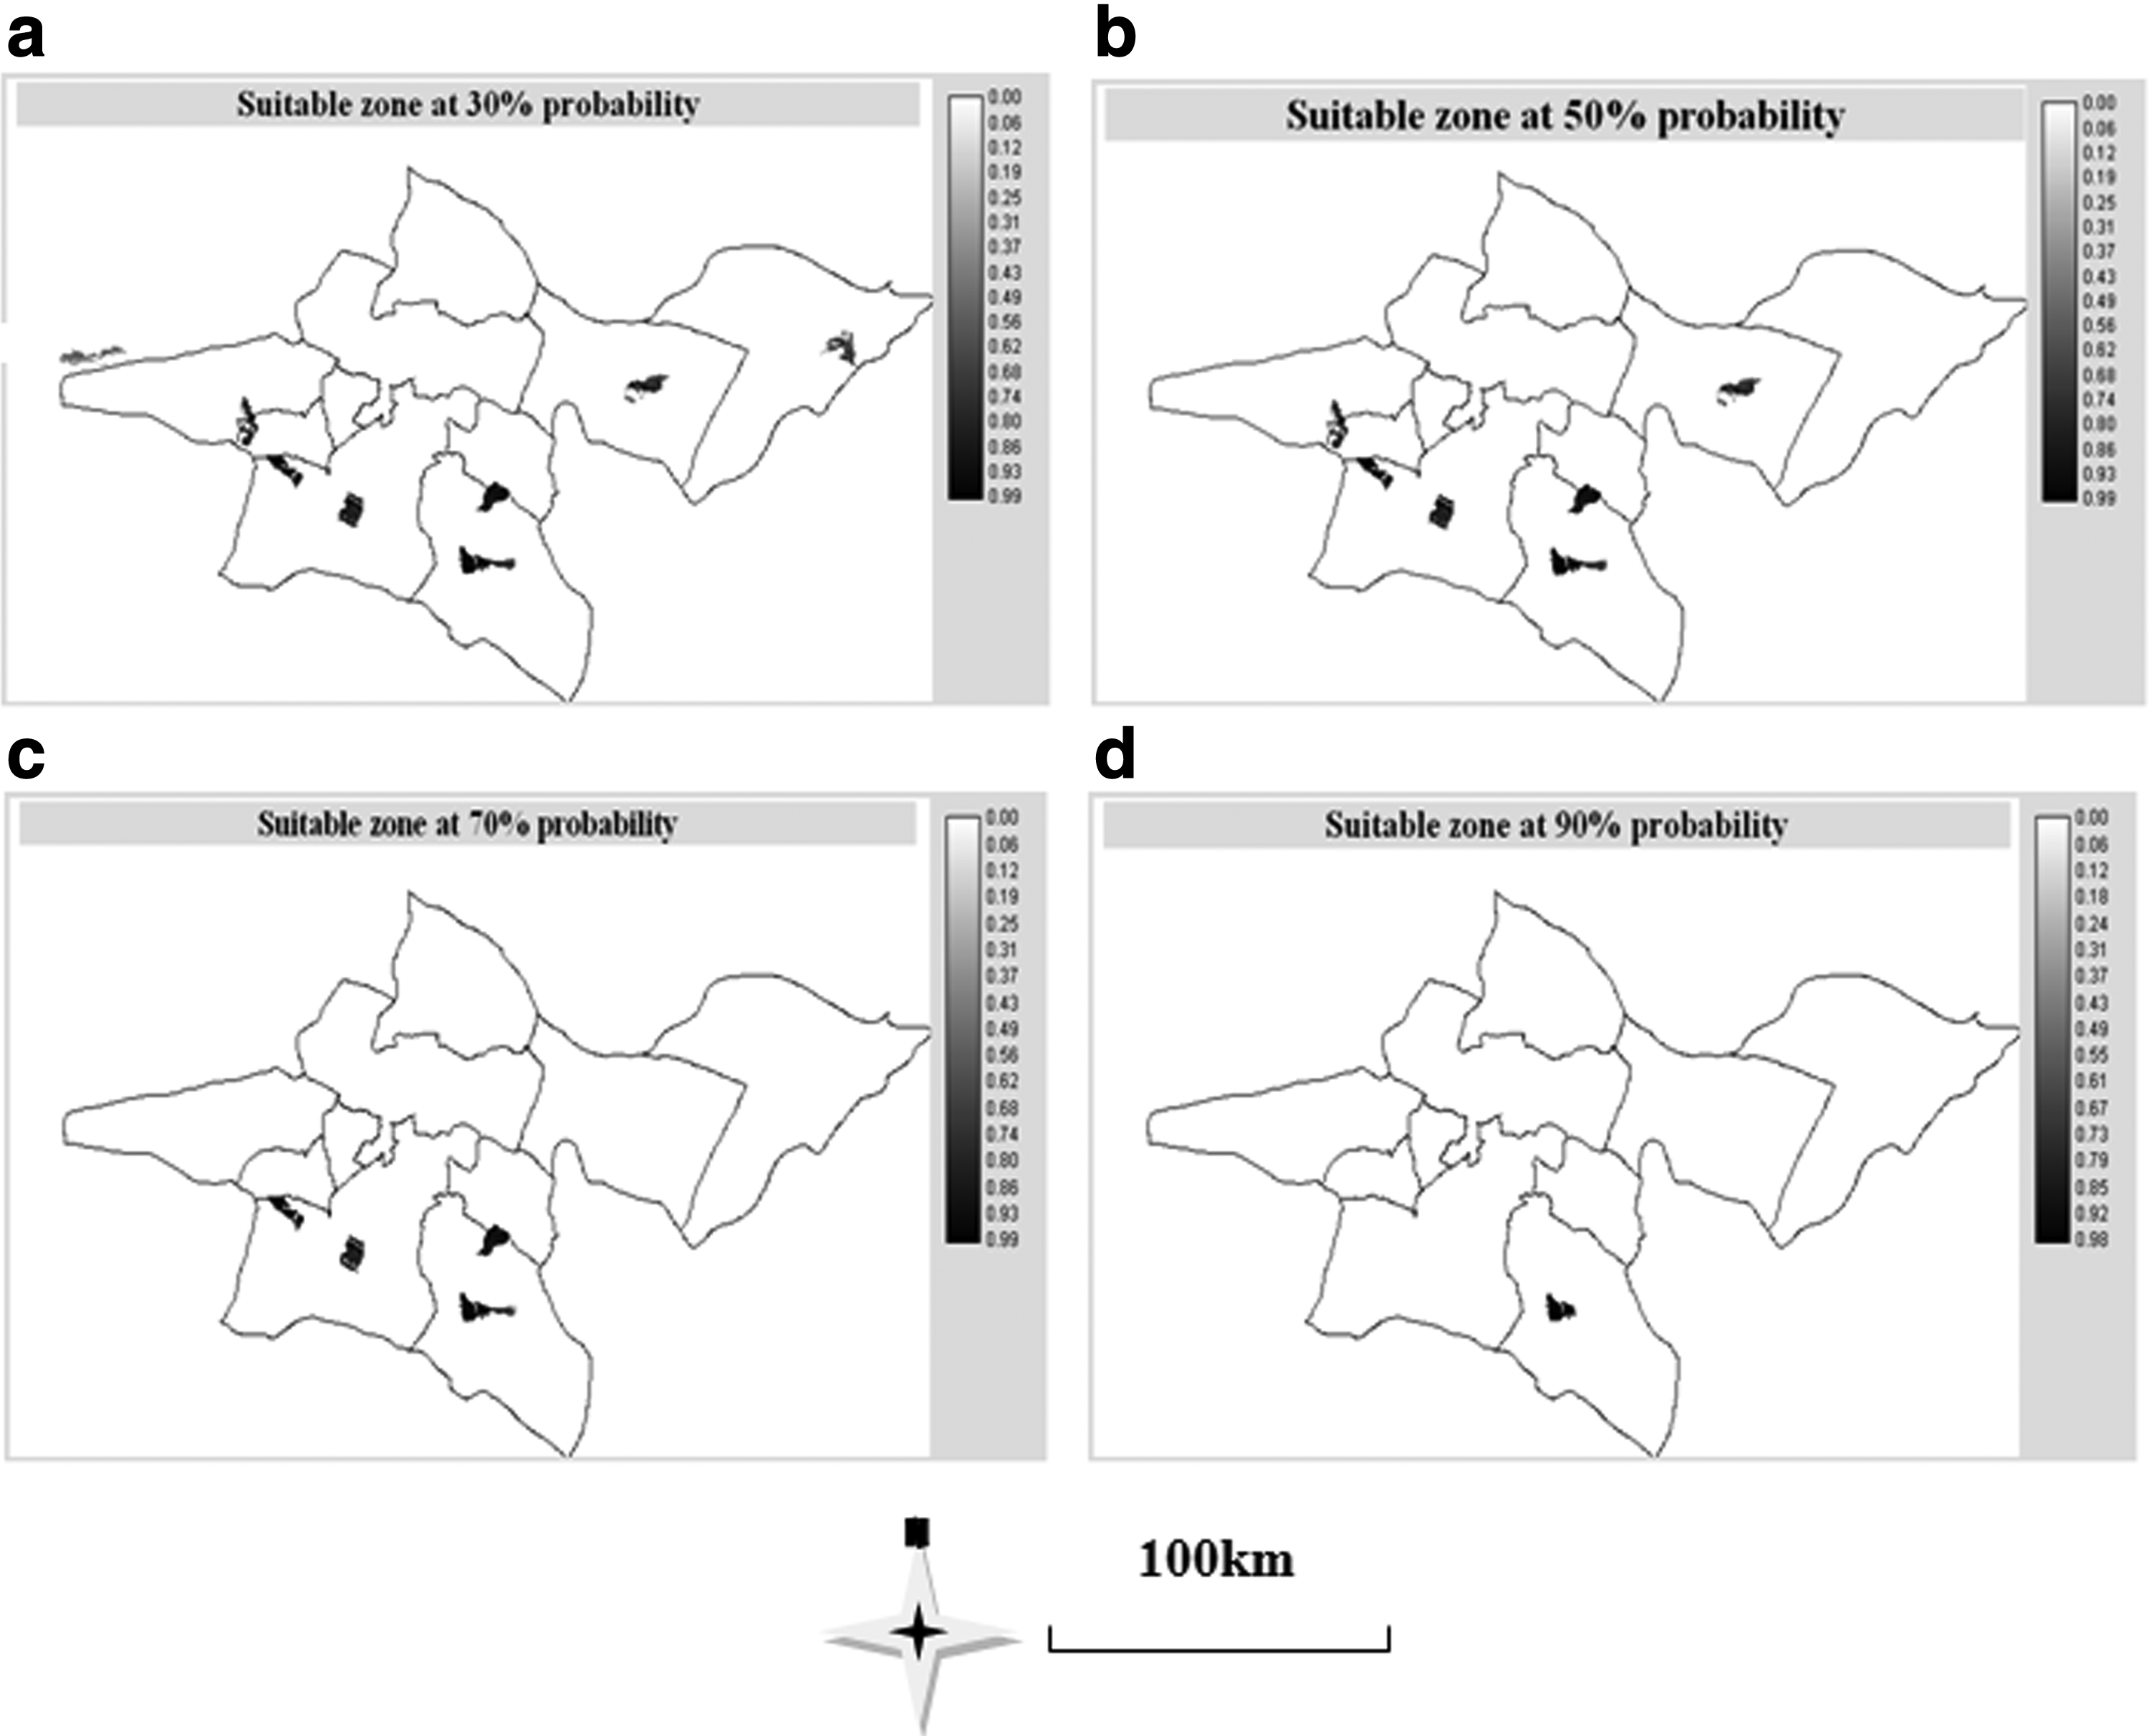
Suitable zones for urban development after application of different probability thresholds. Labels show degree of suitability with higher values (darker areas) showing more suitable areas.
Sensitivity analysis
The results of MCE calculations using urban experts' views on weights were cross-tabulated and the common areas were derived (shown in Fig. 8). This helped to pinpoint the most suitable sites based on the highest overlapping areas when weights given by all of the experts were considered. As such, we found 5 out of 7 areas overlapping where all experts showed total agreement. This adds to the validity and plausibility of the results especially when changing weights do not bear heavily on the final outcomes.
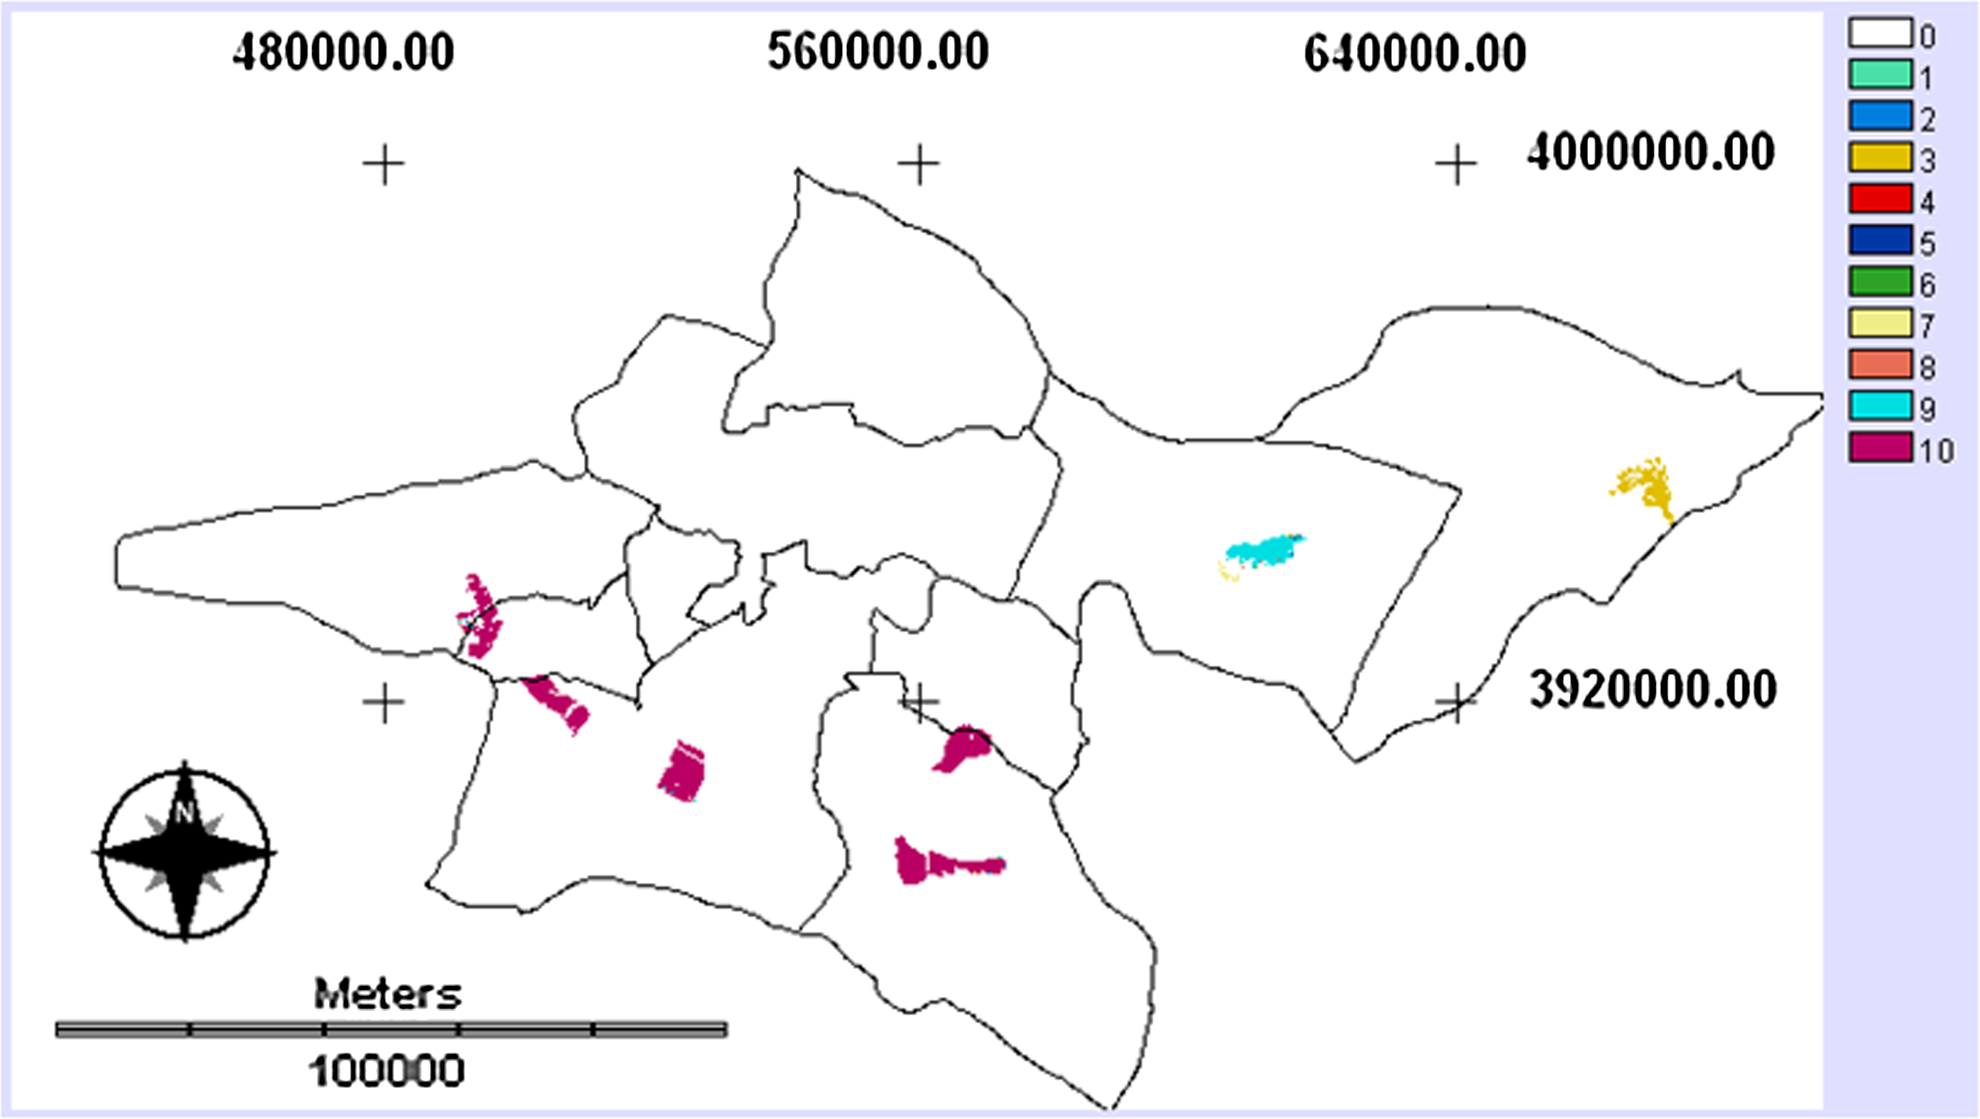
Common areas using different experts' views on weights. The higher the value, the more experts have agreed on the area being suitable.
The result of these two stages can introduce the most proper lands for urban development and reduce conflict in plans. These highly agreed upon sites were checked and found situated on the poorly vegetated and undeveloped lands, away from the high-density built-up areas. These sites are highly recommended for land development as several experts and most of the stakeholders' ideas have been involved in the process, and also due to the consideration of measurement error and its propagation, which led to specification of accuracy probability in the results. Knowing how accurate the results are and agreeing upon a certain level of risk eventually reduces conflicts and increases the chance of the development plan being successfully implemented.
Summary
The main scope of this research is targeting sustainable development and consensus building through considering uncertainty in planning procedures. Commonly, in Iran deciding on the best locations for urban development receives varied ideas as stakeholders point to the quality of the data used and the inherent inaccuracies in them causing biased results. Considering inaccuracies and using scientific methods for their handling provides a medium for participation of the interested parties and their eventual consensus on overlapping results. The spatial analysis for urban land use management applied in this article constituted a holistic index based on surrogate socioeconomic and ecological components that made possible an assessment of the suitability for urban land development in Tehran Province. However, the current model only relies on distance metrics, which evidently lack some of the interests of the decision makers as pertains to socioeconomic factors. Hence, our model can be coupled with other socioeconomic metrics in future applications to provide a more realistic representation of the status quo and ways to achieve consensus on the preferred outcomes.
To the integrated assessment, this article aims at using error propagation in land suitability analysis to enhance the understanding of the effects of errors on the outcomes of land use decision making. The results show that MCE coupled with uncertainty analysis can provide a useful framework for accounting of the complex issues in sustainable urban land use decision making. It also indicates that uncertainty management is necessary to be used when valid and accurate data are not available or when the validity is questioned by the interested parties. The other point of this research is the weighting process, as several experts and decision makers are involved; the approach provides a framework for collective participation in urban decision making. The method provides a means of reaching consensus among varying decision makers in a topical issue such as urban development. Apparently, many governmental and nongovernmental bodies are involved in such a process, and controversy is inevitable. Hence, the decision makers can use the method as a game play tool, apply proven or agreed upon errors to the factor maps, change criteria weights, and provide probability classifications to handle the issue.
We suggest that in similar cases and when the development at hand has large impacts on the environment, this approach can be very useful. With small modifications, the method can be tested and used for other land use planning procedures in order to reduce the negative consequences of land development. Through this approach and based on the level of risk deemed acceptable by all the interested parties, a final soft decision can be achieved. Therefore, the decision makers can perceive the decision risk that is involved across an entire surface, and make collective judgments and decisions about that risk. They also can be satisfied seeing their defensible opinion on data accuracy has been taken into account and the final sites selected are a common denominator of the agreed upon areas for urban development.
Footnotes
Author Disclosure Statement
No competing financial interests exist.