
Abstract
Abstract
Groundwater in Central and South Florida is known to contain high levels of sulfide. A series of shower tests were designed to evaluate hydrogen sulfide (H2S) emissions from sulfide-containing groundwater in residential houses. To our knowledge, indoor H2S levels resulting from regular household usage of water containing sulfide have never been studied or compared to that generated by other sources, such as defective drywall. Our objectives were to determine the factors controlling H2S emissions during a shower; to evaluate indoor H2S levels associated with regular household water usage; and to apply a one-box model to predict indoor steady-state H2S concentration. Shower tests conducted under controlled conditions indicated that pH has a significant impact on emission rate, whereas temperature does not. Both pH and temperature significantly impacted emission percentage. Flow rate and total sulfide concentration in water significantly impacted emission rate, but not emission percentage. Shower tests conducted at six residential houses located in five cities indicated that H2S in the air increased linearly with time during the shower-testing period. A 3- to 20-min shower—using water with total sulfide concentrations ranging from 0.20 to 2.45 mg/L—raised H2S concentrations in the bathroom air to 300–2250 parts per billion by volume. The indoor steady-state H2S concentration caused by regular household water usage can be predicted with a one-box model. Our study suggested that, without proper treatment, groundwater containing high concentrations of sulfide can be a significant source of H2S in indoor air.
Introduction
Potential sources of H2S in indoor air vary by region, but generally include (1) emissions from groundwater containing sulfide (Miller and Mancl, 1997); (2) vapor intrusion associated with muck, septic tanks, wastewater mains, or landfills in the vicinity of the residence (particularly in houses that are vacant for a period of time, allowing water traps to dry out; Devai and Delaune, 2000); (3) the conversion of sulfate by sulfate-reducing bacteria in the water distribution systems (Miller and Mancl, 1997); (4) the chemical and/or biological reduction of sulfate in the water heater; (5) air exchange from outdoor ambient air where high levels of H2S exist (Kourtidis et al., 2008); and (6) emissions from defective drywall (Gauthier et al., 2009). The concentrations of H2S generated from different sources vary greatly. For example, more than 200,000 ppbv of H2S can exist in sewer pipe gas (Tomar et al., 1995; Fan, 2004; Zhang et al., 2008). H2S in urban ambient air has been reported in the range of 12,000–1,045,000 ppbv near creeks where domestic and industrial wastewater was discharged (Muezzinoglu, 2003). The H2S concentration in landfill gas has been reported at 35,500 ppbv (U.S. EPA, 1998). Several hundred to >1000 ppbv of H2S has been measured at locations associated with animal enclosures, such as swine-housing systems (Schnoor et al., 2002). Levels of 0.5–2.5 ppbv H2S have been detected in homes containing imported defective drywall by the U.S. Consumer Product Safety Commission (CPSC; U.S. CPSC, 2010).
Groundwater in Central and South Florida contains high concentrations of sulfide, likely because the aquifers are anaerobic and rich in organic materials (Rye et al., 1981; Haque and Johannesson, 2006). Total sulfide in Florida groundwater was reported to range from 0 to 3.3 mg/L by Rye et al. (1981). A U.S. Geological Survey study indicated that Southwest Florida has some of the highest levels of H2S in the Upper Floridan aquifer, and that the HS− levels in selected wells were as high as 4.7 mg/L (Sprinkle, 1989). Our preliminary data survey suggests the ranges of total sulfide concentrations in groundwater from aquifers underlying Central and Southwest Florida are 0.05–5.1, 0.07–6.5, and 0.12–16 mg/L in the Surficial, mid-layer Hawthorn, and Upper Floridan aquifers, respectively (via correspondence with the Florida Department of Environmental Protection [FDEP], Lee County, Manasota Water Authority, and City of Cape Coral).
The majority of water treatment plants in Florida control taste and odor by degassing and/or direct chlorination to meet the total sulfide limit of 0.3 mg/L for public water systems (Florida Administrative Code Chapter 62-555.315; FDEP, 2010). Therefore, potable water treated by a public treatment system is not likely to be a major source of H2S in indoor air. However, houses using private wells usually rely on aerators to remove H2S. Malfunctioning aerators or under-designed aerators could result in high concentrations of sulfide residue in the water. Water containing H2S at certain concentrations gives water a nuisance rotten egg smell and taste (Megonnell and Spotts, 1994; Miller and Mancl, 1997). At concentrations <1.0 mg/L, H2S will give water a musty odor and water supplies with as little as 1.0 mg/L of total sulfide are directly corrosive, may affect copper and silverware, and may occasionally release a black material that stains laundry and porcelain (Miller and Mancl, 1997). H2S in indoor air emitted from the water can dissolve back into the moisture deposited on copper and silverware and potentially cause corrosion. However, to our knowledge, the indoor H2S levels resulting from the regular household usage of water containing sulfide has never been studied or compared to that generated by other sources, such as defective drywall. Such a comparison will help identify the major indoor source at some specific locations and prevent the potential corrosion or adverse health effects due to long-term exposure. While only 44% of the U.S. population depends on groundwater as a portable water source, more than 90% of Florida residents use groundwater as a potable water source, and about 1.79 million Floridians (10% of Florida's population) obtained their drinking water from domestic or private wells in 2005 (Marella, 2009). Therefore, it is critical to evaluate groundwater as a potential source of H2S in indoor air in this region and understand the potential levels of H2S that the residents could be exposed to.
The sulfide speciation in water and the emission of H2S to the atmosphere are mainly governed by the pH and temperature of the water (Kularatne et al., 2003). Studies have shown that H2S undergoes rapid emission from the aqueous phase to the gas phase (Arogo et al., 1999; Yongsiri et al., 2004; Blunden et al., 2008). The total sulfide concentration in water, air–water contact area and time, level of agitation, air and water temperatures, and water pH all determine how much H2S will be emitted during water usage (e.g., more H2S is likely to be emitted by taking a shower than by washing hands). H2S in the atmosphere can undergo chemical oxidation by oxygen and hydroxyl radicals and also commonly attenuates over time by adsorption, advection, and dispersion in the atmosphere (Kularatne et al., 2003). Bowyer (2003) reported that H2S in the atmosphere has an atmospheric residence time typically <1 day. This timeframe is long enough to cause corrosion, which usually occurs within hours (Rickett and Payer, 1995).
Since the indoor H2S can be attributed to various potential sources and long-term exposure to H2S can be responsible for corrosion, we designed a series of shower tests to evaluate H2S levels in residential indoor air, sourced primarily from sulfide-containing groundwater in Central and South Florida. Our objectives were to determine the factors (such as water temperature and pH, shower water flow rate, and total sulfide concentration in water) controlling the emission of H2S from water during a shower, to evaluate the indoor H2S level raised by regular water usage (primarily shower) in residential houses, and to apply a one-box model to predict the release of H2S in indoor air at steady state, which represents the long-term exposure level.
Materials and Methods
Controlled shower tests in a shower stall
Controlled shower tests were conducted in a shower stall to evaluate the influence of the water temperature and pH, the flow rate, and the total sulfide concentration on H2S emissions from water during a shower. A shower stall without a door and/or ceiling (Durastall, Model #68; 0.8 m×0.8 m×1.9 m) was purchased from a local store; transparent acrylic sheets were utilized as the door and ceiling. The shower head was installed on the ceiling with tubing connected to a 40-gallon electric water heater (Whirlpool) through a Geopump™ peristaltic pump (Geotech Peristaltic Pump). The size of the shower stall is about one-tenth of a regular bathroom; therefore, the flow rates of all controlled shower tests were correspondingly scaled down. The groundwater used in the controlled shower tests was from two locations, Cape Coral and Alva. Since the emission of H2S is rapid, all tests were conducted onsite with freshly pumped water. The groundwater was pumped directly from the well into the water heater and then to the showerhead with the peristaltic pump that controlled the shower flow rate. The water temperature was controlled by adjusting the water heater thermostat or by mixing it with freshly pumped, cold groundwater. The sulfide concentration was controlled by mixing the freshly pumped groundwater with aerator-treated sulfide-free groundwater. The total sulfide concentration in the water was analyzed right before the shower test by the U.S. EPA–approved Hach 8131 method with a DR 2800 portable spectrophotometer (Hach Company). The H2S concentration in the air was monitored onsite at selected time intervals by a Jerome 631-X portable H2S analyzer (Arizona Instrument LLC) through a drilled hole, with the size of the analyzer's sensor on the door of the shower stall (∼0.5 m from the bottom). The Jerome analyzer was calibrated with the analytical standards supplied by Lakeland Laboratories and verified with air samples collected during the tests in the residential houses. Details are described in section 2.2.
The detailed experimental conditions are presented in Table 1. The effect of temperature on H2S emissions was tested at five levels (22°C, 32°C, 35°C, 38°C, and 39°C) at the Cape Coral site with a flow rate of 0.20±0.01 L/min and a total sulfide concentration of 0.98±0.08 mg/L. The effect of flow rate on H2S emissions was tested at three flow rates (0.2, 0.5, and 1.0 L/min) at the Cape Coral site with a temperature of 39.5±0.5°C and total sulfide concentration of 0.81±0.05 mg/L. The effect of total sulfide in water on H2S emissions was tested at five concentration levels at both sites: at 0.064, 0.19, 0.48, 0.71, and 0.96 mg/L at the Cape Coral site (with a temperature of 21.6°C±1.5°C and flow rate of 0.50±0.00 L/min) and at 0.095, 0.19, 0.44, 0.78, and 1.08 mg/L at the Alva site (with a temperature of 23.4°C±0.5°C and flow rate of 0.50±0.00 L/min). The pH value of the water was measured right before the test and was within the range of 6.6 and 8.0 (Table 1). Because the experiments were designed to simulate the regular water usage (primarily shower) in residential houses, and the domestic well water treatment systems in the studied region usually do not include the adjustment of pH with acid or base, the pH values were not controlled in the simulated shower tests, but were monitored while controlling the temperature, flow rate, and total sulfide concentrations.
Each shower test was performed for ∼15–20 min until the H2S concentration in the air reached a plateau. The shower stall was opened to vent after each test, and the background H2S concentration in the air was monitored before starting the next test. Duplicated experiments were performed for selected conditions. Blank experiments were conducted with sulfide-free groundwater treated with the aerator at the Alva site and the potable water from the city of Fort Myers. The measured concentrations of H2S in the air and the total sulfide in the water were used to calculate the emission rate and the emission percentage of H2S from the water to the air based on the flow rate and the dimension of the shower stall (i.e., the air volume inside the shower stall).
Shower tests in residential houses
The shower tests were conducted at six residential houses located in five cities (Palm Bay, Okeechobee, Upper Captiva, Alva, and Cape Coral), covering a large geographic area from Central Florida to South Florida. The GPS locations of the sites are shown in Fig. 1. The Cape Coral residential site is different from where the controlled shower tests were conducted. All six properties withdraw groundwater as the water supply from private wells.
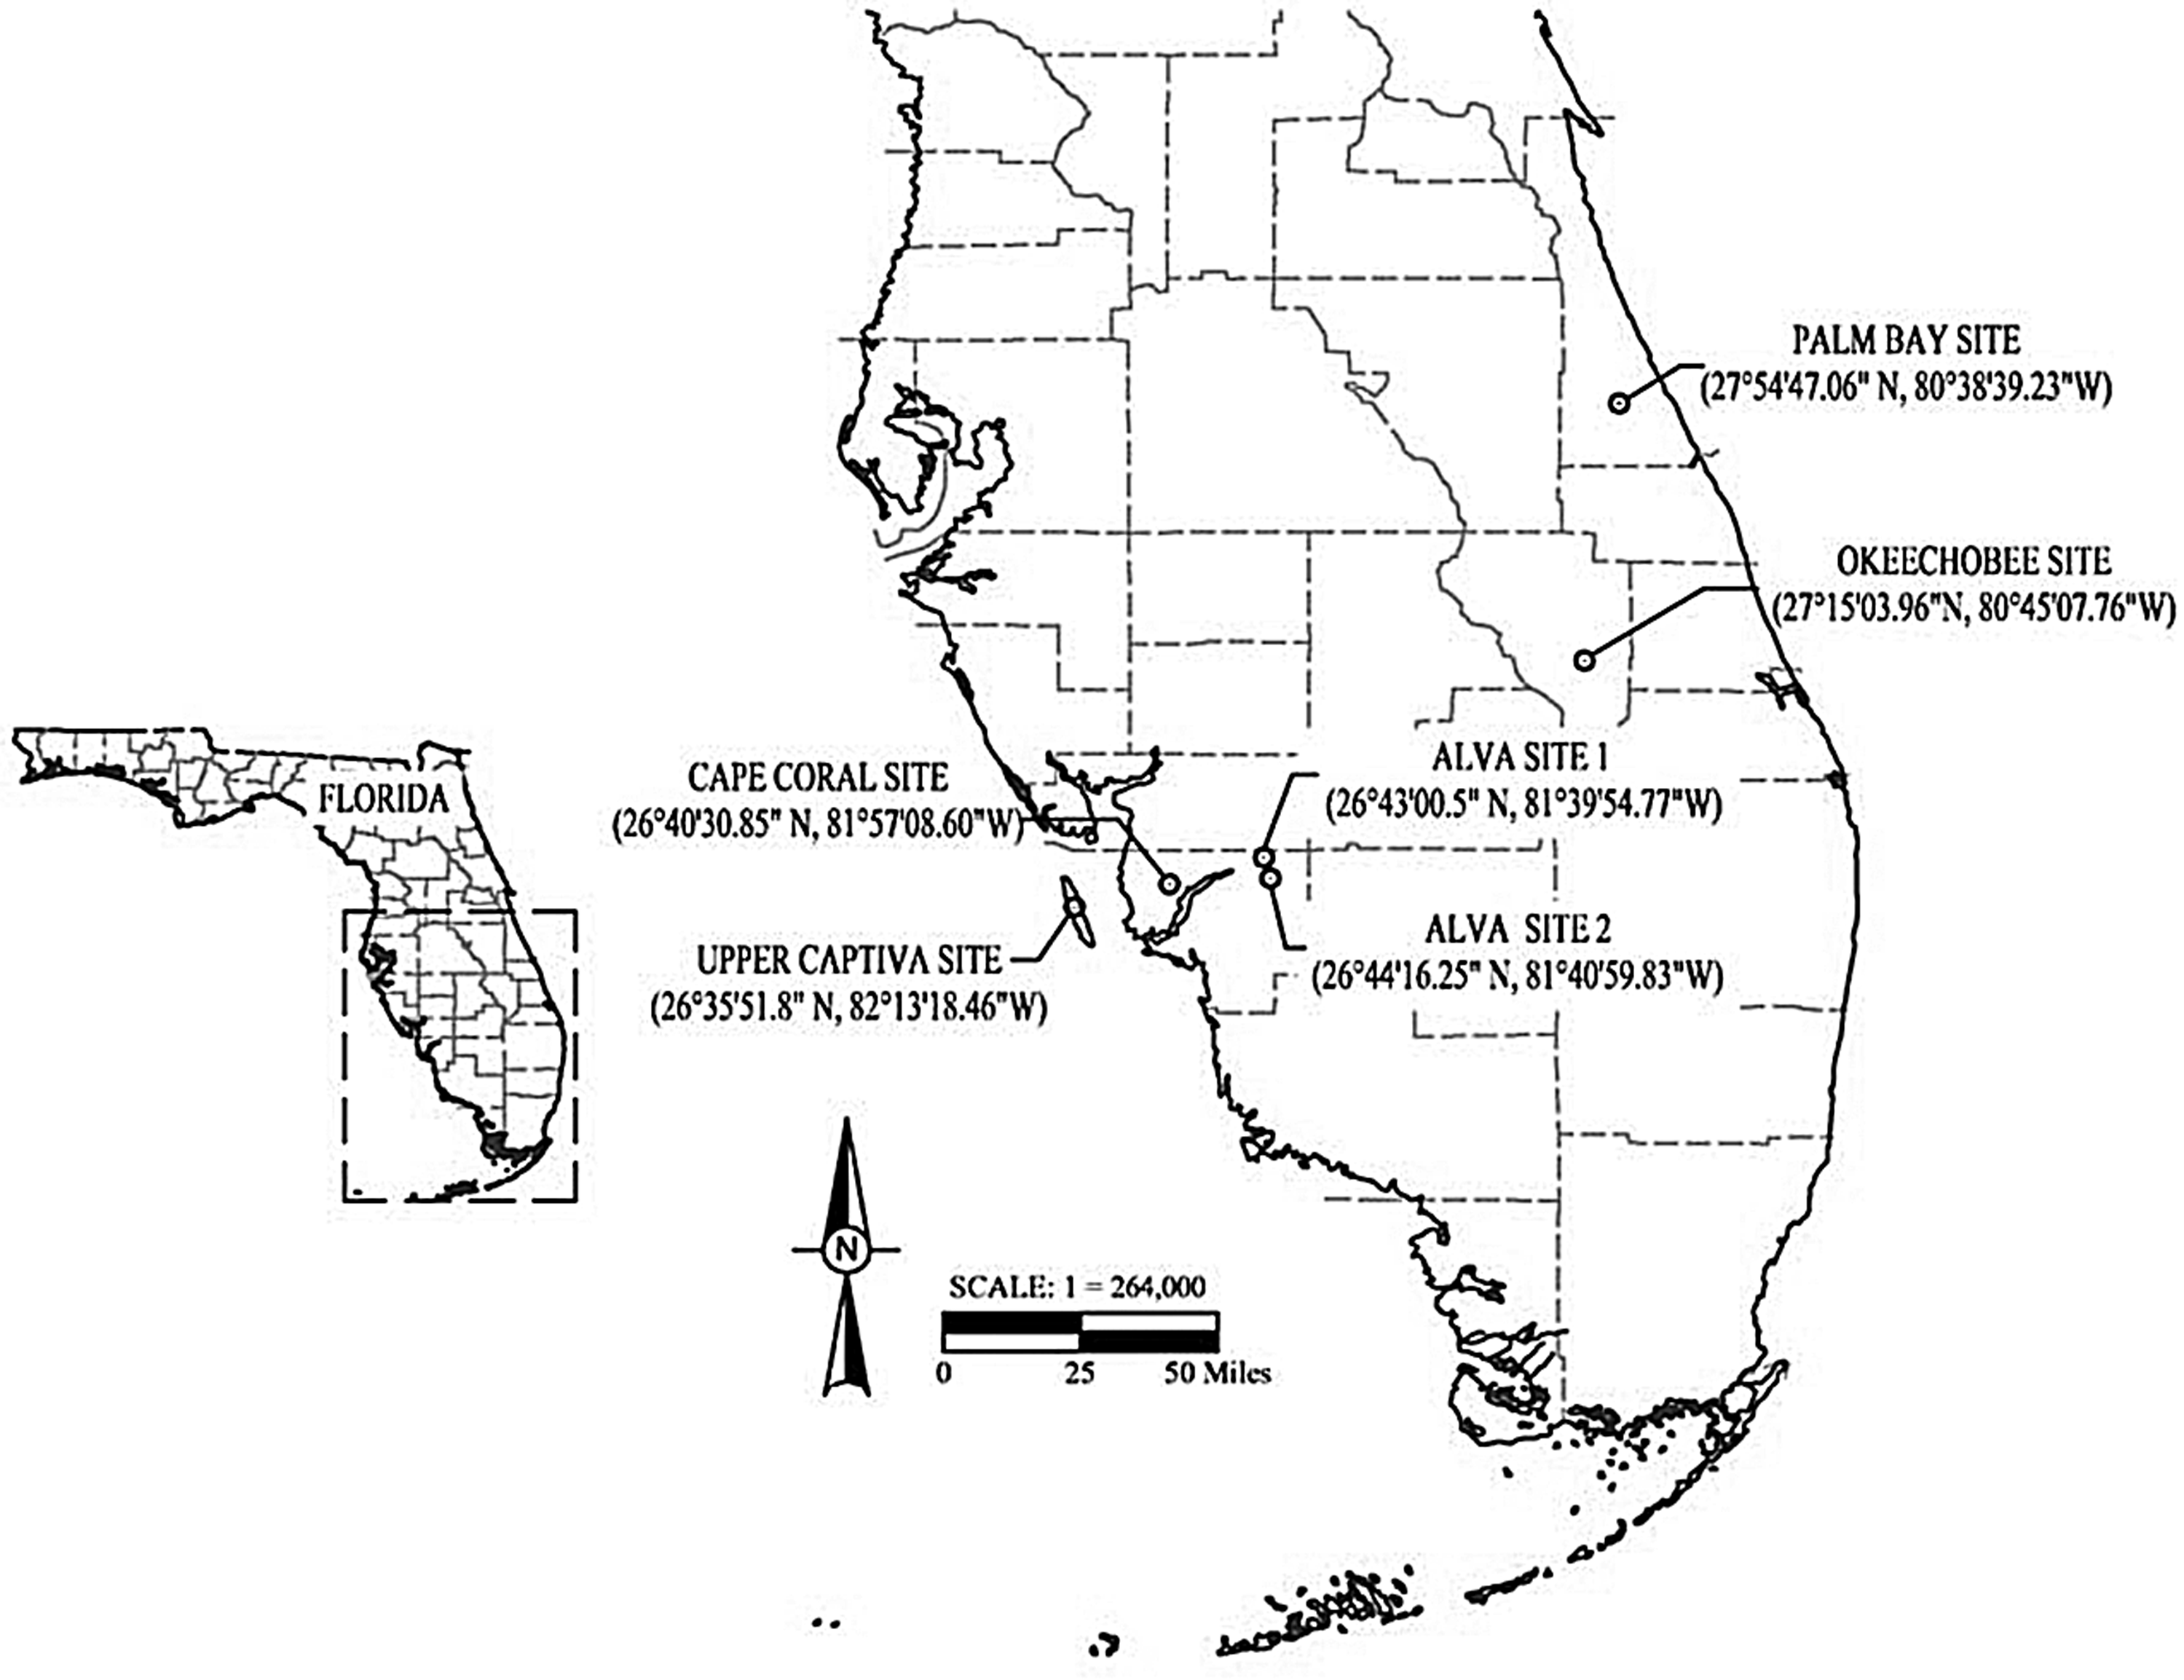
Shower test locations of the residential houses in Central and South Florida.
The shower test at each site was performed with the existing showerheads in each bathroom, following the same procedures as the controlled tests in the shower stall. The water used in the shower tests at each site was either directly pumped from the well or from the existing aeration tank, using the equipment in place at the site. The total sulfide in the water was analyzed with the Hach 8131 method before and after the shower test, and the H2S concentration in the bathroom air was monitored using the portable Jerome 631-X meter at selected time intervals. Air samples were also collected directly into laboratory-supplied Tedlar bags using a lung sampler at selected time intervals during the shower test and submitted to Lakeland Laboratories for H2S analysis following ASTM D5504-08. The laboratory results were compared with those measured onsite by the Jerome meter for calibration and verification. During the shower tests, the bathroom door was closed, and the ventilation fan was turned off. After each test, the door and window were reopened, and the next experiment was not performed until the H2S concentration in the air decreased to the background level. Each shower test was performed for ∼3–20 min until the H2S level in the bathroom exceeded 2250 ppbv or reached a plateau. The experimental conditions, including bathroom dimensions, total sulfide concentrations in the water, water temperature, and flow rate, are presented in Table 2. The measured concentrations of H2S in the air and the total sulfide in the water were used to calculate the emission percentage of H2S from the water to the air based on the shower water flow rate and the dimensions of the bathroom.
Shower test was conducted with cold water, but temperature was not measured.
Continuous H2S monitoring in a residential house
H2S concentrations in indoor air were also monitored at a time interval of 5 min for 24 h in the house at the Upper Captiva site with water usage that simulated normal, daily household usage. Two portable Jerome meters were used for monitoring. One was placed in the center of the downstairs master bedroom; the other was placed in the center of the upstairs living room. The simulated water usage included two 20-min showers in the morning (one in the upstairs bathroom and one in the downstairs bathroom), two 20-min showers at night (one in the upstairs bathroom and one in the downstairs bathroom), a few times of dishwashing (5 or 15 min), and hand washing (1 or 3 min) in the morning, at noon, and at night. The flow rate ranged from 3.75 to 6 L/min, and the water temperature ranged from 27°C to 38°C.
One-box model approach
A one-box model was applied to estimate the mean concentration of H2S in indoor air emitted from groundwater into a residential house:
where Cg is the H2S concentration in the air (M/L3); Cw is the total sulfide concentration in the water (M/L3); Q is the daily water usage (L/T); p is the H2S emission percentage; V is the house volume (L3); e is the air exchange rate (1/T); and k is the H2S decay rate (1/T). The sum of e and k is referred to as the attenuation rate in the following discussion (1/T).
At steady state, the mean concentration of H2S in indoor air due to emissions from water usage can be estimated as follows:
Uncertainty of predicted indoor H2S concentration was estimated by Monte Carlo simulation with Crystal Ball 2000 (Oracle Corp.). The resulting distribution of simulated output was analyzed by a least-trimmed squares regression (Systat 12; Systat Software, Inc.). The estimated means and standard deviation are reported, and the predicted value is compared with the mean concentration obtained by the 24-h monitoring results at the Upper Captiva site.
Results and Discussion
Effects of temperature, flow rate, and total sulfide concentration on H2S emissions
The effects of temperature, flow rate, and total sulfide concentration in the water on H2S emissions tested at the Cape Coral site are presented in Fig. 2a–c. The effect of the total sulfide concentration in the water on H2S emissions tested at the Alva site is presented in Fig. 2d. For all the tests, the H2S concentrations in the air increased linearly with time (p<0.05 for linear regression). From the tests at the Cape Coral site, with a flow rate of 0.20±0.01 L/min and a total sulfide concentration of 0.98±0.08 mg/L, no significant trend in the H2S concentration in the air was observed to be associated with a change in temperature (Fig. 2a). The highest H2S concentration in the air was observed at 32°C (pH 6.6); the lowest concentration was observed at 22°C for the first 13 min (pH 7.7) and at 39°C after 13 min (pH 7.5). The H2S release in the first 10-min shower test followed the pattern reported by Kularatne et al. (2003) that the effect of temperature on H2S emission varied with the pH values, and the H2S concentration generally increased with the decreasing pH below a pH value of 8.5. From the tests at the Cape Coral site with a temperature of 39.5°C±0.5°C and a total sulfide concentration in the water of 0.81±0.05 mg/L, a higher H2S concentration in the air was observed with a higher flow rate (Fig. 2b). From the tests at the Cape Coral site with a temperature of 21.6°C±1.5°C and a flow rate of 0.50±0.00 L/min, a higher H2S concentration in the air was observed with a higher sulfide concentration in the water (Fig. 2c). Similarly, from the tests at the Alva site with a temperature of 23.4°C±0.5°C and flow rate of 0.50±0.00 L/min, a higher H2S concentration in the air was observed with a higher sulfide concentration in the water (Fig. 2d).
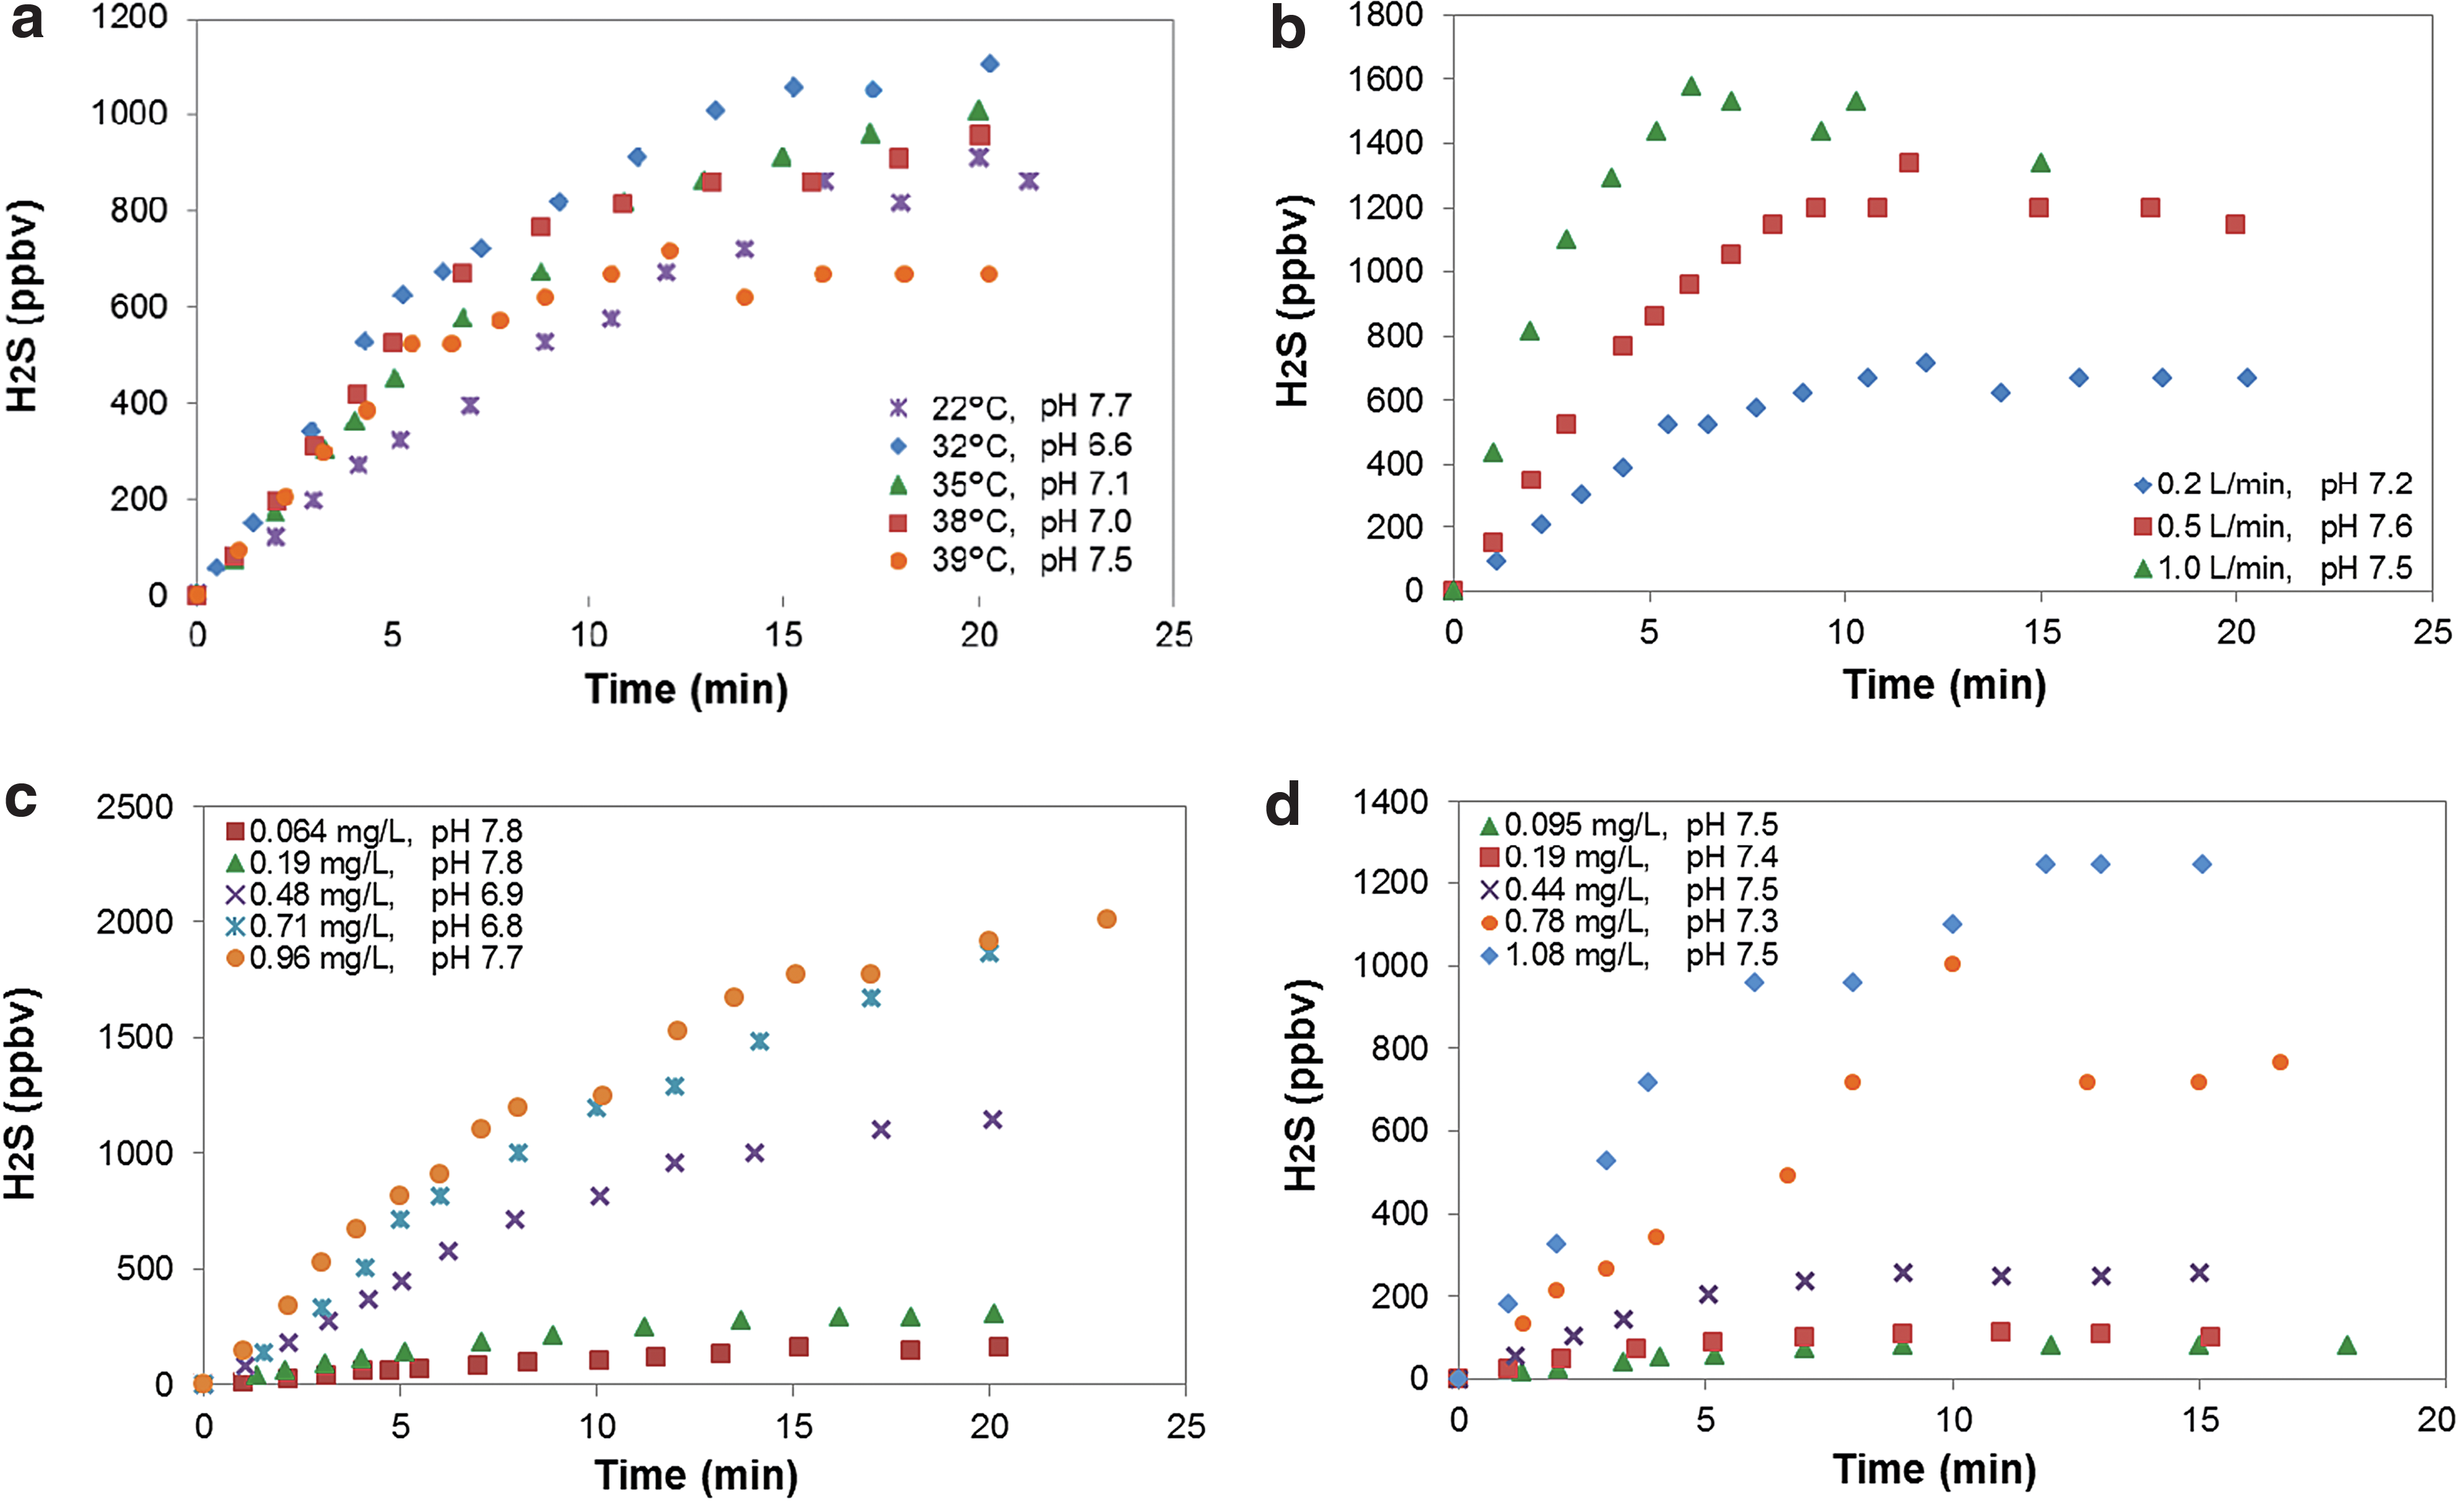
Change of hydrogen sulfide (H2S) concentration in air with time during the shower with water of different temperatures, flow rates, and total sulfide concentrations at the Cape Coral site
The H2S emissions were evaluated as the emission rate and the emission percentage, where the emission rate was defined as the mass of emitted H2S in the air over the time period, and the emission percentage was defined as the mass percentage of sulfide emitted as H2S in the air from the total sulfide in the water used during the shower. The coefficient obtained from the linear regression analysis of the H2S volumetric concentration versus time was converted to mass unit and presented as the emission rate, and the average emission percentage over the testing period was calculated and reported with standard deviation (Table 1). The multiple linear regression analysis (backward stepwise regression) was performed on the emission data, and the results suggested that pH has a significant impact on emission rate (p<0.001), while temperature does not (p=0.354). Both pH and temperature significantly impact emission percentage (p=0.003 for pH and 0.044 for temperature). Flow rate and total sulfide concentration in the water significantly impact emission rate (p<0.001), but not emission percentage (p>0.05). The insignificant effect of temperature on H2S emission rates in our controlled tests was not expected. The effect of temperature on the emission rate could be masked by the effect of pH, in our controlled tests. The rapid emission of H2S in the water heater while adjusting the thermostat resulted in a lower fraction of neutral species in the aqueous phase, less deprotonation, and higher pH of the water. The results obtained from the controlled tests in the shower stall suggest that the emission percentages obtained by the shower tests conducted in the residential houses, where the flow rate and the total sulfide concentration in the water are difficult to control, should not be significantly influenced by these factors.
H2S emission during shower in residential houses
The experimental conditions and emission percentages obtained from the shower tests conducted in the residential houses are shown in Table 2; the H2S concentration in air versus shower time is presented in Fig. 3. The total sulfide concentration in groundwater varied among the tested sites, ranging from 0.20 to 2.45 mg/L. As with the tests conducted in the shower stall under controlled conditions, H2S in the air in the bathroom increased with time, and the increasing trend was linear by regression for all the tests except A2-1 (p<0.05). The A2-1 test was conducted in a small, walk-in shower room (0.9 cm×0.9 cm×2.4 cm) located inside of a large bathroom (5.5 cm×2.7 cm×2.4 cm). The increasing trend tailed-off likely due to the mass transfer from the walk-in shower room to the large bathroom. For all the tests conducted in the residential houses, the H2S in the bathroom air reached >300 ppbv during or after the shower tests. For two tests, conducted at Cape Coral (CC-2) and Alva (A1-1), the H2S concentration in the bathroom air increased to 2250 and 1800 ppbv, respectively, in <5 min. At the Okeechobee site (tests O-1 and O-2), H2S was measured at 43 ppbv in the master bedroom and 22 ppbv in the entire house 1 h after the shower tests were completed, and the bathroom door was opened. At the Alva site 1 (tests A1-1 and A1-2), H2S was measured at 40 ppbv in the entire house 1 h after the shower tests were completed, and the bathroom door was opened. The ratio of H2S concentration in the shower air to that in the remaining house air is similar to that reported for several volatile chemicals in a previous study (e.g., chloroform, perchloroethylene, and carbon tetrachloride; McKone, 1987).
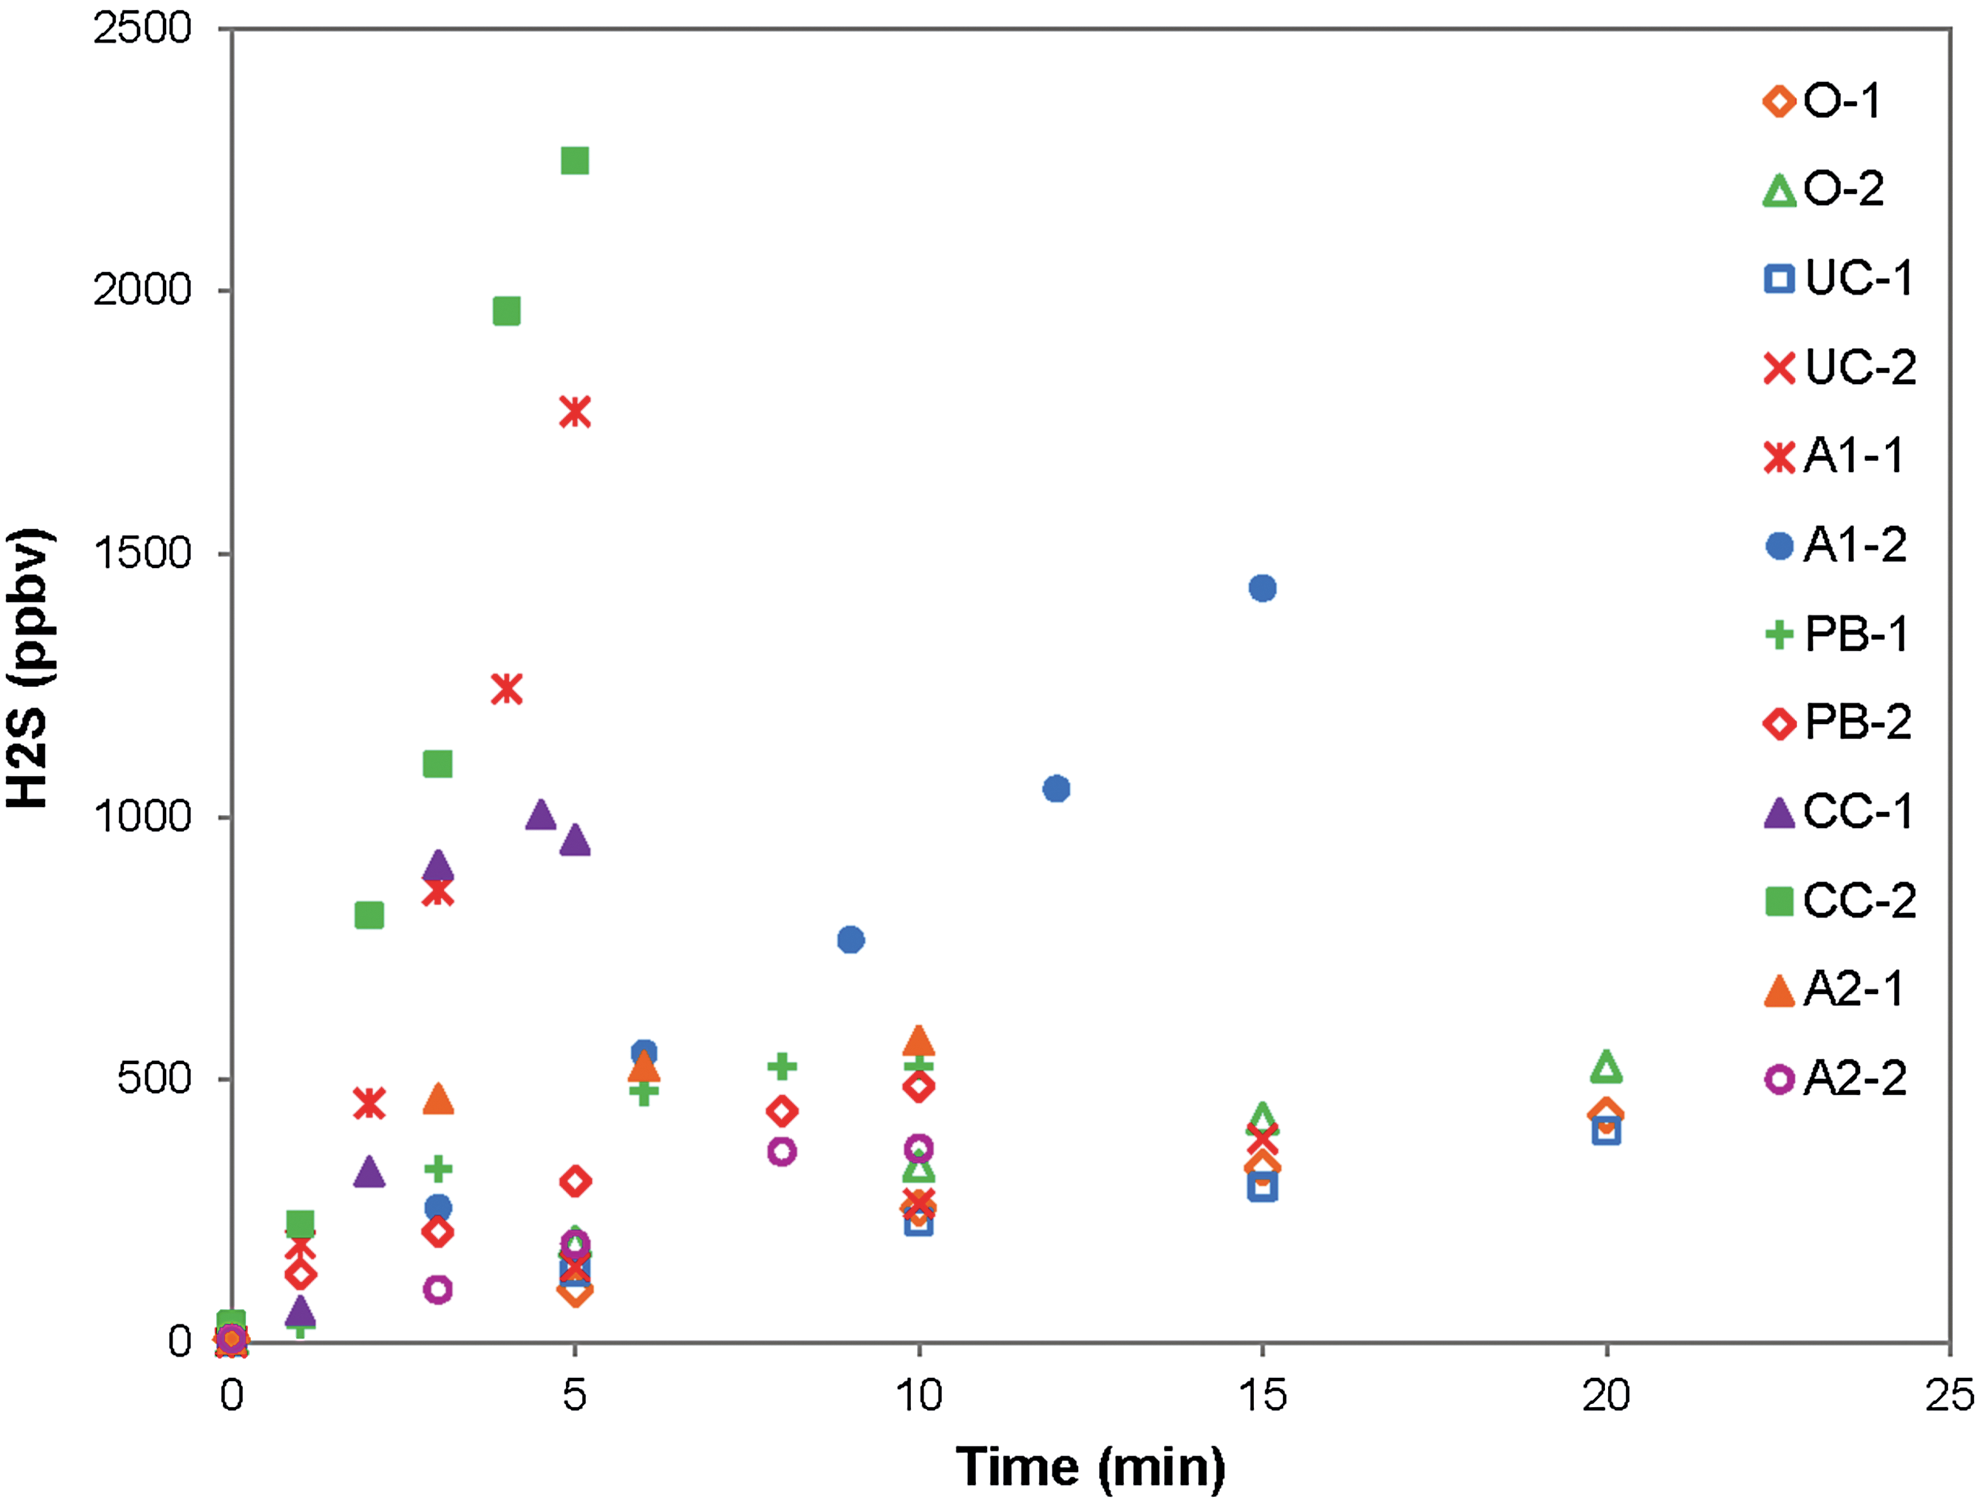
The change of H2S concentration in air with time during the shower tests conducted in six residential houses at five sites.
The average H2S emission percentage over the testing period was calculated and is shown in Table 2. The overall average emission percentage obtained from the shower tests in the residential houses is 32.2%±11.6%, which was expected, because the maximum H2S removal efficiency achieved by conventional aeration system is ∼40%–50% for water with a total sulfide concentration between 0.3 and 0.6 mg/L at a pH of <7.2 (FDEP, 2010).
H2S concentration continuously monitored in a residential house
The H2S concentrations monitored for 24 h in the residential house located in Upper Captiva are presented in Fig. 4. The H2S concentrations in the air fluctuated with the water usage over the monitoring period. After using the tap water for 5–10 min in the kitchen located downstairs, the H2S concentration in the air downstairs increased to 25 ppbv and reached 8 ppbv in the air upstairs. After the first shower in the bathroom downstairs and the second shower in the bathroom upstairs, the H2S concentration in the air reached 54 and 70 ppbv downstairs and upstairs, respectively, while the total sulfide concentration in the aeration tank was measured at 1.34 mg/L. After the third shower in the bathroom upstairs and the fourth shower in the bathroom downstairs, the H2S concentration in the air increased to 20 and 12 ppbv downstairs and upstairs, respectively, while the total sulfide concentration in the aeration tank was measured at 0.60 mg/L. The mean H2S concentration during the entire monitoring period was calculated as 8.7±9.3 and 9.6±11.6 ppbv for downstairs and upstairs, respectively. These levels are comparable to the upper limit of the H2S odor threshold reported by Ruth (1986; 0.5–10 ppbv) and are higher than the H2S concentrations commonly reported to be associated with defective drywall (∼0.5–2.5 ppbv) according to the indoor air measurement by CPSC (U.S. CPSC, 2010).
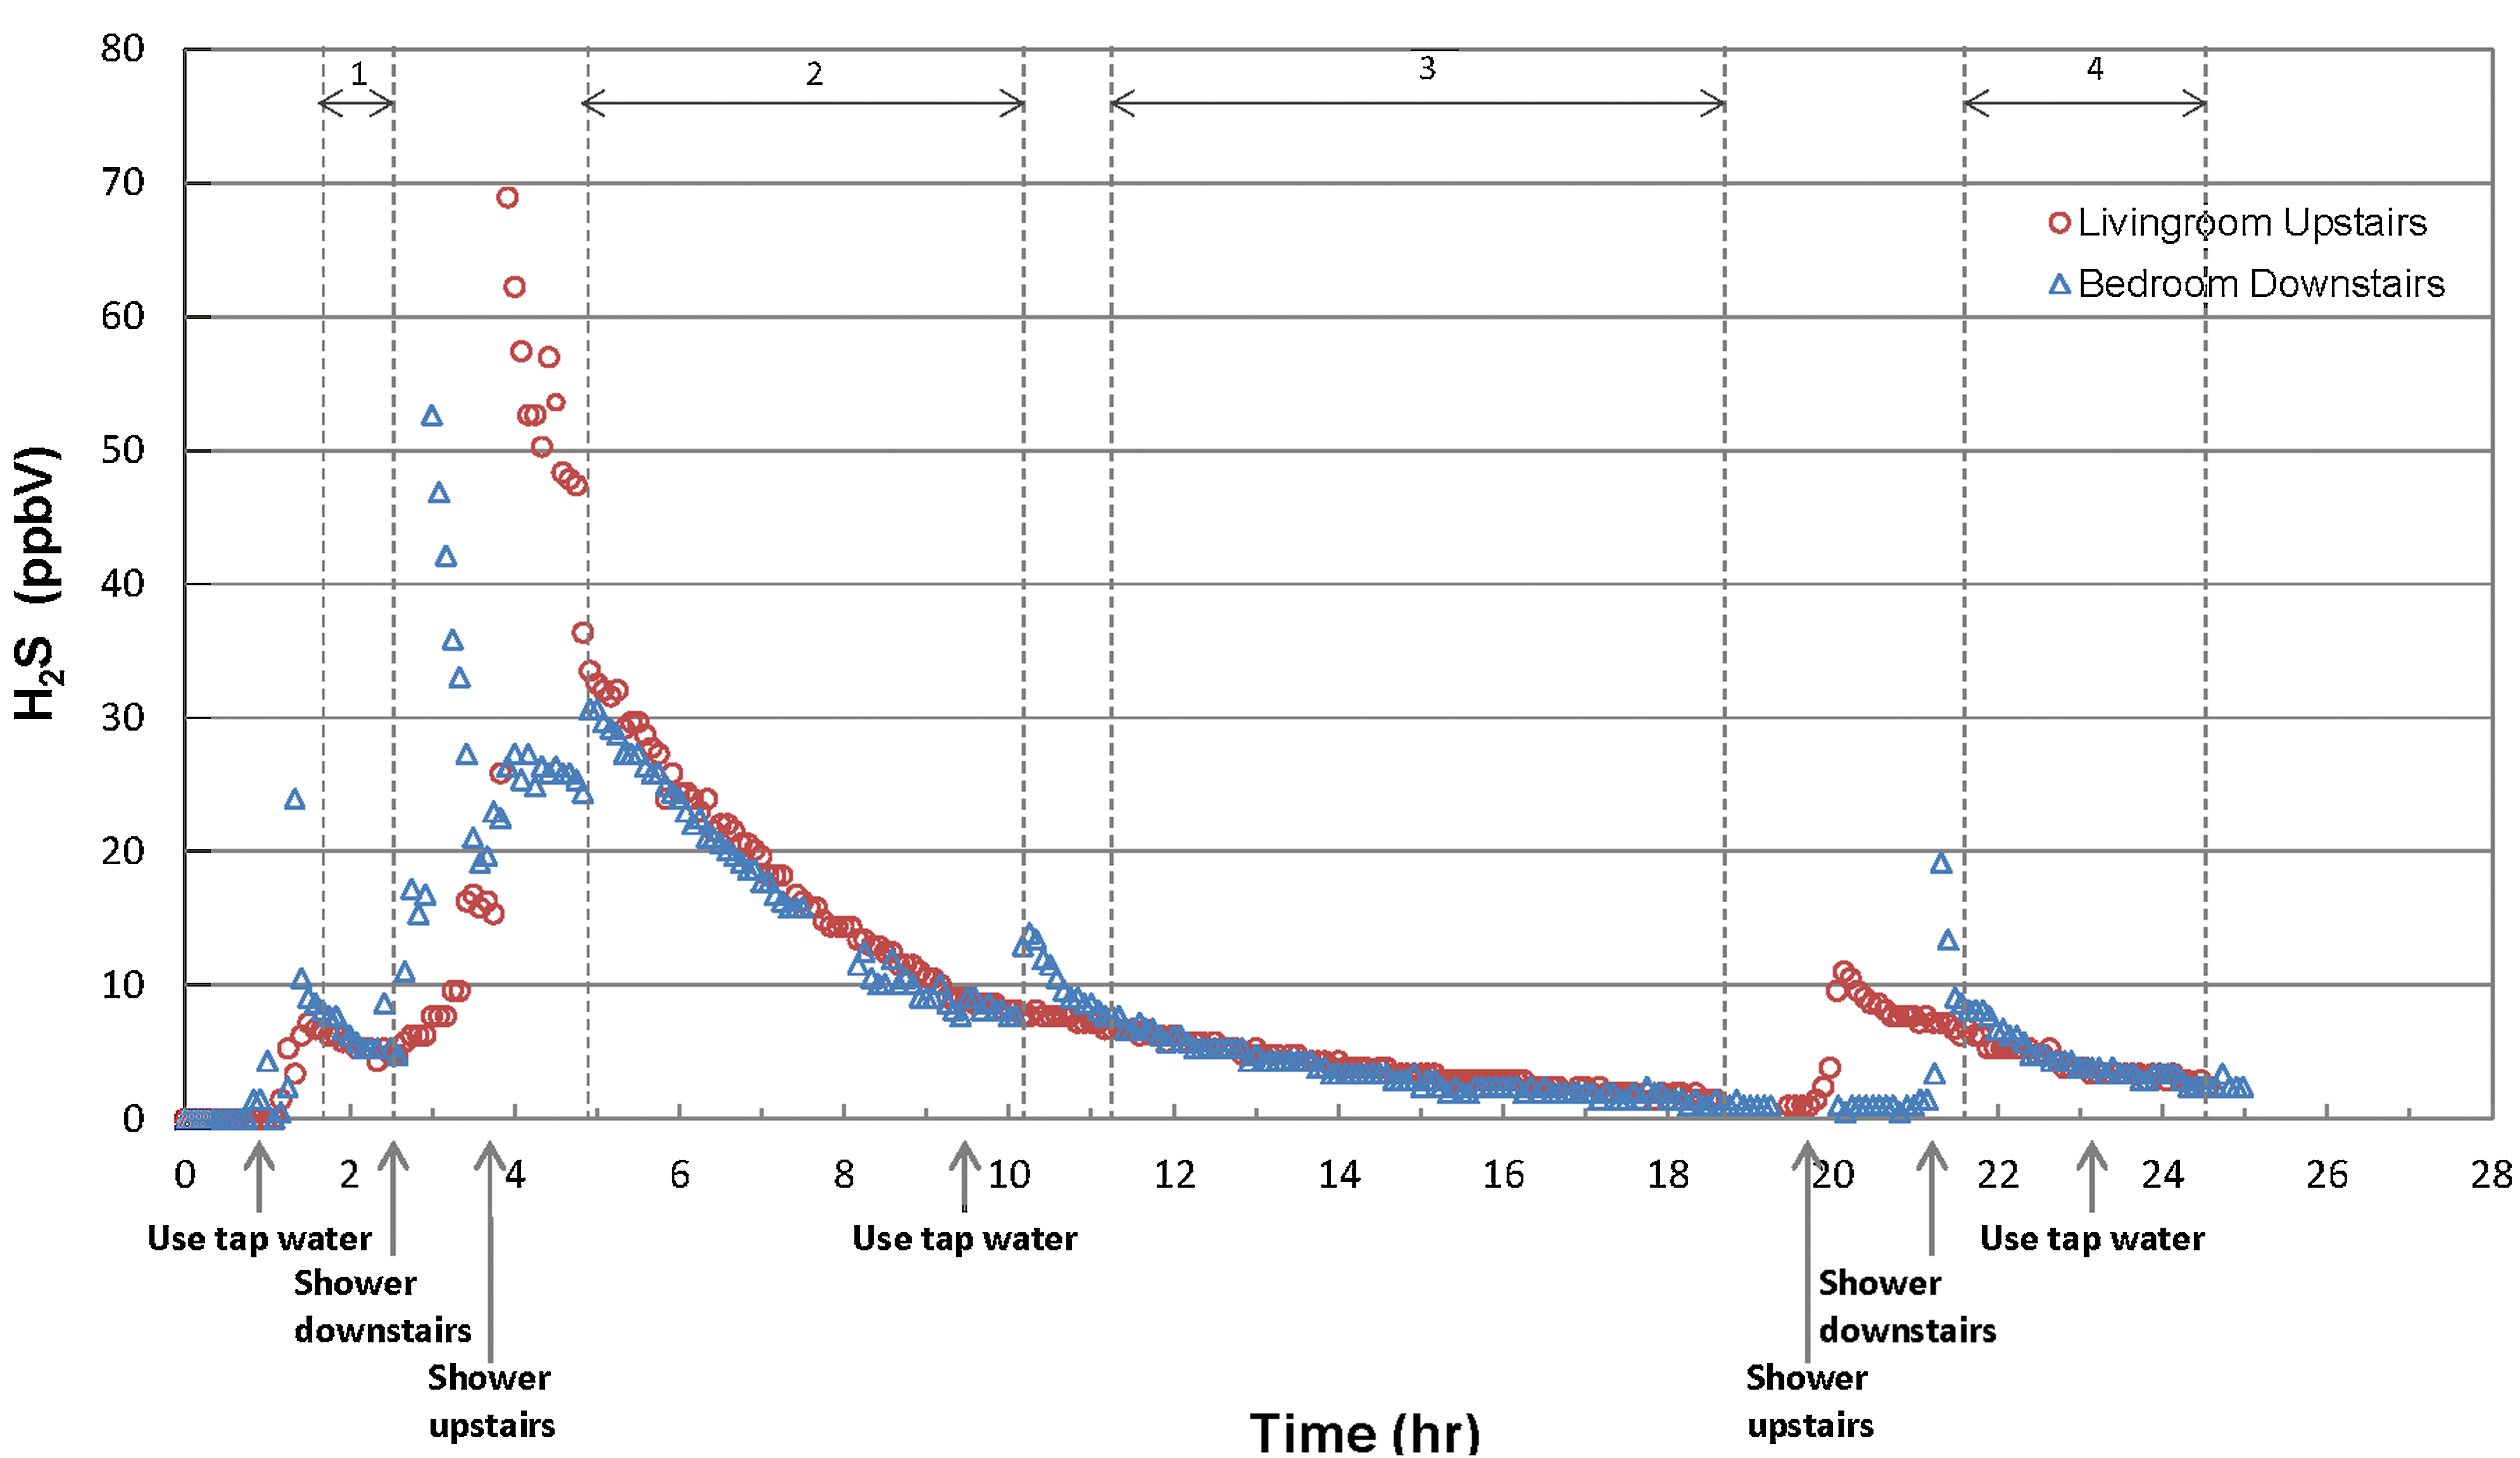
H2S concentration in air monitored for 24 h in the residential house in Upper Captiva with regular household water usage.
The H2S concentration-decreasing profile was well fit with the first-order kinetics (p<0.05), and an average attenuation rate was estimated as 8.9±4.6 per day (i.e., 0.37±0.19 per hour) by fitting the data where the concentration profile of downstairs and upstairs overlapped, suggesting a homogeneous concentration in the entire house (Table 3). This indoor H2S attenuation includes losses associated with both the air exchange and the decay due to oxidative reactions and/or sorption inside the house on surfaces such as furniture and carpeting.
The time period labeled on Fig. 4 when a steady state was reached.
One-box model simulation
The steady-state H2S concentration in indoor air in the residential house in Upper Captiva was estimated with the one-box model [Eq. (2)]. The house volume was estimated to be 463,490 L based on an average floor area of 2,046 ft2 (190 m2) for the new single-family houses built between 1973 and 2010 (U.S. Census Bureau, 2010a) and an average height of 8 ft (2.4 m). An average water usage of 95 gallons per capita per day (360 L per capita per day; Marella, 2008) was assumed for an average household size of 2.6 (U.S. Census Bureau, 2010b). An average air exchange rate of 4.28±1.71 per day measured in 26 houses in Florida by CPSC was used (U.S. CPSC, 2010). Because the actual decay rates of H2S in indoor air is not available in literature, three scenarios were considered: (1) 0.33 per day (half-life time of 2.1 days), the decay rate in atmosphere reported by Bowyer (2003); (2) 4.6 per day (half-life time of 3.6 h), the attenuation rate obtained through our 24-h monitoring experiment deducted by the air exchange rate; (3) 240 per day (half-life time of 0.07 h), the decay rate used in the H2S emission model by CPSC (Babich et al., 2010), a conservative assumption that the half-life time of H2S is a couple of days in clean air (Schnoor et al., 2002). With the site-measured average emission percentage of 20.4%±3.5% and the average total sulfide concentration of 0.51±0.03 mg/L in the groundwater, the steady-state H2S concentrations in indoor air in the Upper Captiva residential house were estimated as 33.3±7.6 ppbv with a decay rate of 0.33/day, 16.6±6.9 ppbv with a decay rate of 4.6/day, and 0.62±0.13 ppbv with a decay rate of 240/day. The steady-state H2S concentration predicted with the measured decay rate of 4.6/day is not significantly different from the monitored average H2S concentration in indoor air (at 8.7±9.3 ppbv for downstairs and 9.6±11.6 ppbv for upstairs), but the concentrations predicted with the two decay rates reported in literature are either significantly too high or too low. Therefore, an 8.9/day average attenuation rate is recommended for use in this one-box model when the air conditioning is on and a 4.6/day decay rate should be used when the air conditioning is off.
The concentration profile of indoor H2S emitted from groundwater containing 0.050–4.0 mg/L sulfide at emission percentages of 10%–70% was predicted with an attenuation rate of 8.9 per day (Fig. 5). The emission of H2S from the groundwater could result in elevated H2S concentrations in indoor air. The higher total sulfide concentration in the water and the higher emission percentage result in a higher H2S concentration in indoor air. In most of the simulated cases, the H2S concentrations in indoor air from a groundwater source exceed the indoor concentrations reported to be commonly associated with defective drywall (0.5–2.5 ppbv; U.S. CPSC, 2010). At a medium emission percentage (40%) and a medium sulfide concentration in the water (1.0 mg/L), H2S concentrations in the air could reach 65 ppbv. It should be noted that the H2S concentrations in indoor air could be orders of magnitude higher with a greater water usage per capita per day or a lower air exchange rate—as is the case in some areas of Southwest Florida, where the total sulfide concentration in the groundwater is much higher (e.g., 16 mg/L in some wells; through direct correspondence with the City of Cape Coral).
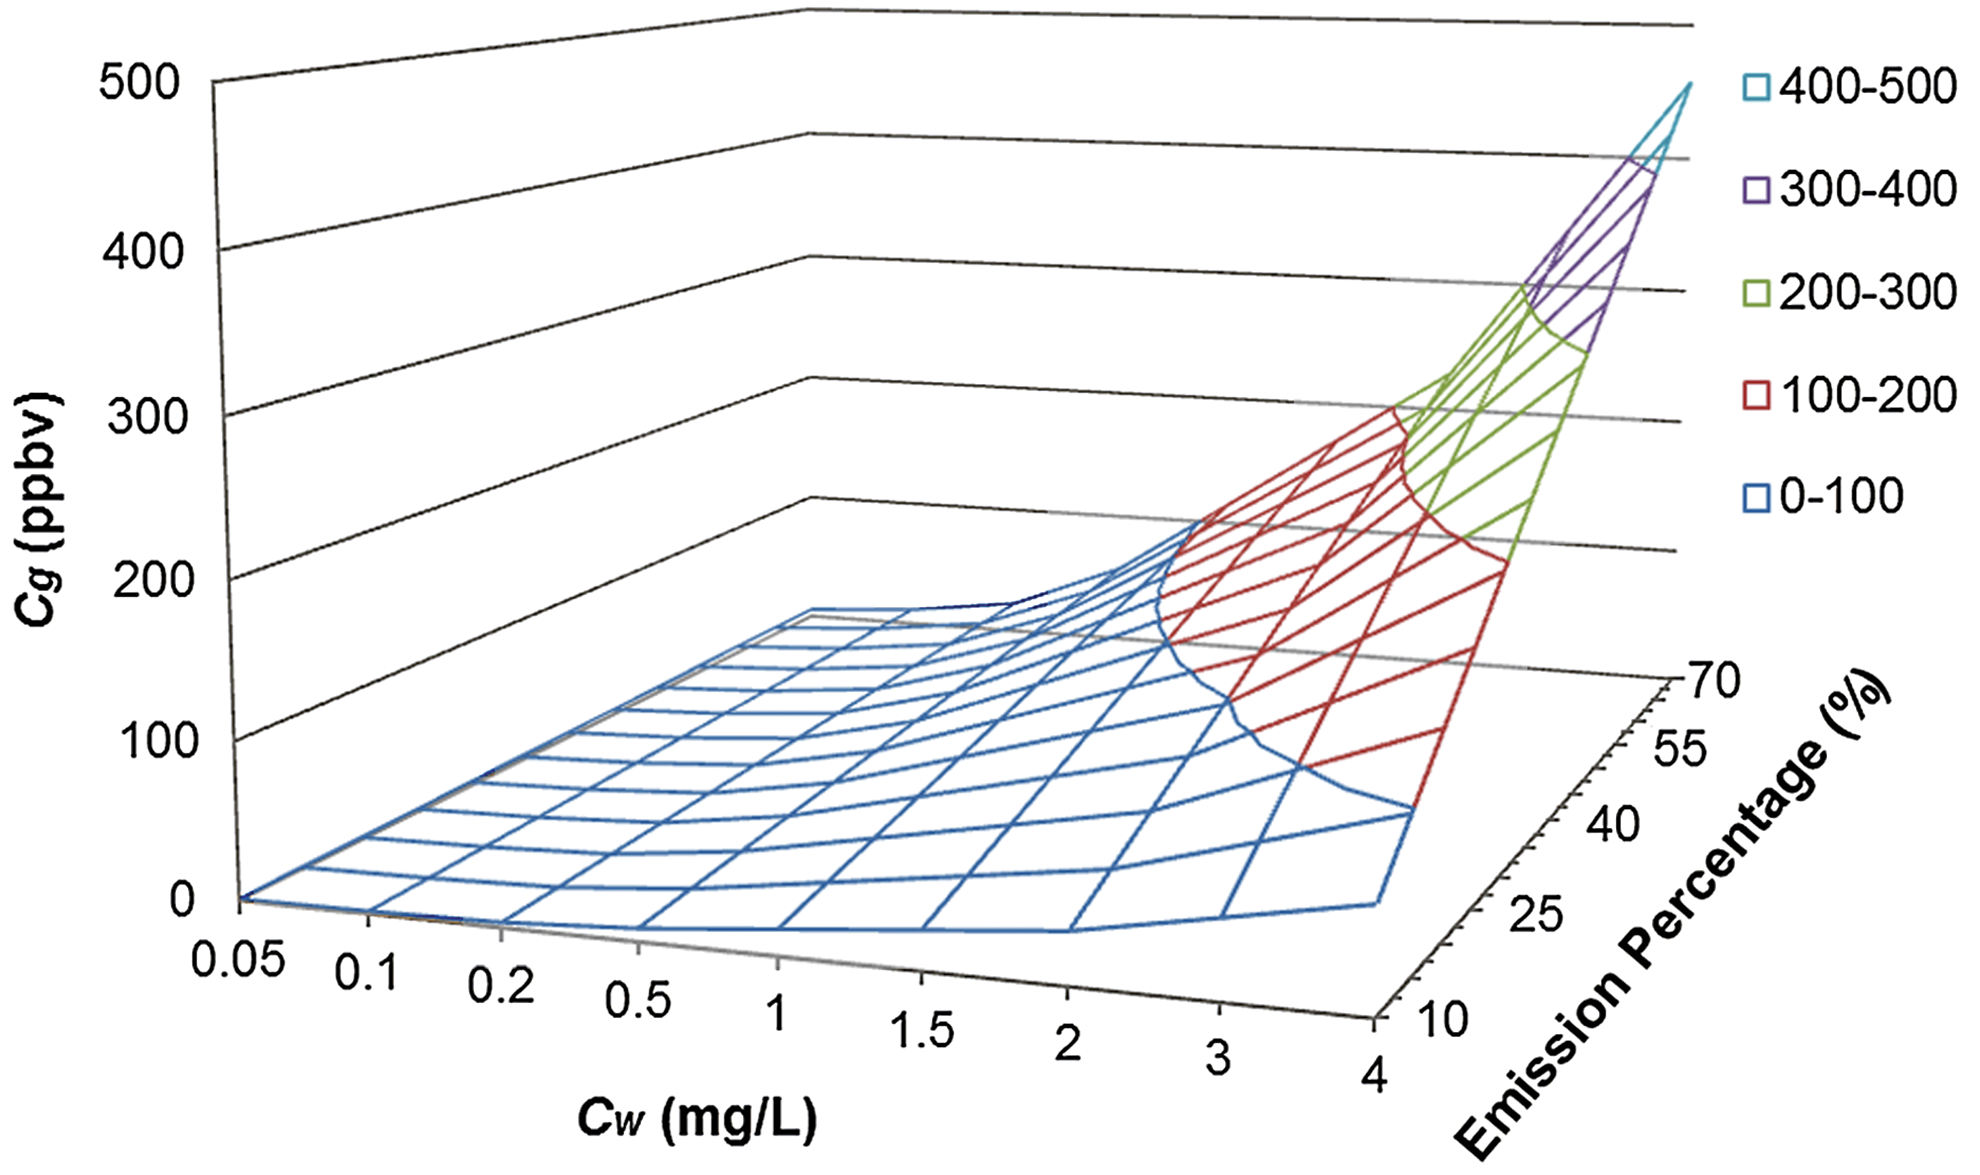
H2S concentration profile predicted by one-box model with the range of total sulfide concentration from 0.05 to 4.0 mg/L and the emission percentage from 10% to 70%.
Using the average emission percentage of 32.2%±11.6% measured at the six sites and the attenuation rate of 8.9/day, the H2S in indoor, residential house air was estimated as 27.6±14.4 ppbv for the Upper Captiva site, which is not significantly different from the monitored average H2S concentration in air (8.7±9.3 ppbv for downstairs and 9.6±11.6 ppbv for upstairs). This suggests that the steady-state H2S concentrations in indoor air due to emissions from the source water in residential houses can be predicted with this simple one-box model if the total sulfide concentration in the water is available. Using the average emission percentage of 32.2%±11.6% and the known site-specific total sulfide concentration in groundwater (Table 2), the steady-state H2S in indoor air in the residential house was estimated as 10.7±5.4 ppbv for the Okeechobee site, 59.2±46.1 ppbv for Alva site 1, 24.1±14.8 ppbv for the Palm Bay site, 125.4±64.2 ppbv for the Cape Coral site, and 50.1±30.1 ppbv for the Alva site 2. All of these estimated levels are considerably higher than the H2S odor threshold reported by Ruth (1986; 0.5–10 ppbv). Given that the dimension and interior design of the bathrooms, the design of the shower heads, and the efficiency of air conditioners at those tested sites are different, which may affect the fluid mechanics of the emissions, the transport, and the decay of H2S in indoor air, an averaged emission percentage and attenuation rate may not provide an accurate estimate of the steady-state H2S concentrations in indoor air. Long-term monitoring data for these residential sites may shed additional light on the accuracy of the one-box model, but were unavailable for this study.
Even if the total sulfide concentration in the water is below the 0.3 mg/L limit for public water systems (FDEP, 2010), the H2S in residential house indoor air was estimated as 16.1±8.6 ppbv with an average emission percentage of 32.2%±11.6% and an attenuation rate of 8.9 per day—higher than the upper limit of the H2S odor threshold reported by Ruth (1986). For example, the steady-state H2S in indoor air was estimated as 10.7±5.4 ppbv for the Okeechobee site, where the total sulfide in the source water was measured as 0.2 mg/L. The H2S emitted from the water could be responsible for the metal corrosion and the dysfunction of air conditioners in residential houses in Central and South Florida that use groundwater containing high levels of sulfide. It is believed that H2S dissolves into the moisture on the air-conditioning-unit coils through which the indoor air is continually circulated and causes etching and precipitation of copper sulfide. Studies have shown that higher temperature, higher humidity, and lower pH conditions will accelerate the corrosion process of metals caused by H2S (Rickett and Payer, 1995; Tran et al., 2005; U.S. CPSC, 2010). This simple one-box model could provide an estimate of the H2S level in indoor air released from groundwater and potentially assist in the investigation of corrosion.
Conclusions
This study indicated that groundwater containing sulfide could be a potential source of H2S in indoor air in Central and South Florida, if the water is neither properly nor sufficiently treated. H2S released quickly from groundwater containing sulfide during regular water usage. The concentration of H2S in the air increased linearly with time during a shower; a 3- to 20-min shower increased the H2S concentration to 300–2250 ppbv in the bathroom air when the total sulfide concentration in the groundwater ranged from 0.20 to 2.45 mg/L. The effect of temperature on H2S emissions varied with the pH values. A higher H2S concentration in the air was associated with a higher shower flow rate and a higher total sulfide concentration in the water. pH has a significant impact on the emission rate, whereas temperature does not. Both pH and temperature significantly impact the emission percentage. Flow rate and total sulfide concentration in the water significantly impact the emission rate, but not the emission percentage. In a residential house, regular usage of groundwater containing 0.6 mg/L sulfide resulted in a mean H2S concentration of 8.7±9.3 and 9.6±11.6 ppbv in the air over a period of 24 h—comparable to or higher than the H2S odor threshold of 0.5–10 ppbv (Ruth, 1986), and higher than the H2S concentrations commonly associated with defective drywall (∼0.5–2.5 ppbv; U.S. CPSC, 2010). A simple one-box model can be applied to predict the steady-state H2S in indoor air due to emissions from groundwater containing sulfide. A reliable estimate of H2S concentrations can assist in decision-making regarding effective strategies needed to remove the H2S from the source water. Regular examination and maintenance of water treatment systems (e.g., an aeration system) are advised for private well users in Central and South Florida to prevent corrosion and/or potential adverse health effects related to long-term exposure to H2S in indoor air emitted from the water supply.
Footnotes
Acknowledgments
This research was supported by the National Gypsum Company. We thank Dr. Jonathan Wynn at the University of South Florida for providing the sulfide database in Florida aquifers and Mr. Mark Alessandroni at Lakeland Laboratories, LLC, for Jerome 631-X H2S analyzer calibration. Any use of trade, product, or firm names is for descriptive purposes only.
Author Disclosure Statement
No competing financial interests exist.