
Abstract
Abstract
Microcystis, a genus of potentially harmful cyanobacteria, is known to proliferate in stratified freshwaters due to its capability to change cell density and regulate buoyancy. In this study, a trajectory model was developed to simulate the cell density change and spatial distribution of Microcystis cells with nonuniform colony sizes. Simulations showed that larger colonies migrate to the near-surface water layer during the night to effectively capture irradiation and become heavy enough to sink during daytime. Smaller-sized colonies instead took a longer time to get to the surface. Simulation of the diurnally varying Microcystis population profile matched the observed pattern in the field when the radii of the multisized colonies were in a beta distribution. This modeling approach is able to take into account the history of cells by keeping track of their positions and properties, such as cell density and the sizes of colonies. It also serves as the basis for further developmental modeling of phytoplanktons that are forming colonies and changing buoyancy.
Introduction
Microcystis is known to dominate in stabled stratified bodies of water, where the nutrients in the surface water layer are often depleted. One of the key factors of this advantageous growth is its capability to migrate down to the deeper nutritious water layers once a day (Walsby, 1970; Reynolds et al., 1987; Ibelings et al., 1991) by changing cell density and regulating buoyancy through changing the carbohydrate storage in the cells (Kromkamp et al., 1986). In recent years, Microcystis has thrived in Hsin-shan Reservoir even when the concentration of the limiting nutrient, total phosphorus (P), was <20 μg P/L.
Attempts have been made to quantitatively predict the population and distribution of Microcystis cells in water bodies. Previous approaches to simulate the growth pattern of Microcystis were based on the assumption of uniform-sized colonies (Okada and Aiba, 1986; Visser et al., 1997; Wallace et al., 2000; Rabouille et al., 2005) and advective-diffusive transport processes (Howard, 2001; Yamamoto and Hatta, 2004; Jöhnk et al., 2008; Serizawa et al., 2008). In fact, in natural waters, Microcystis tends to form colonies with cells numbering from a few dozen to tens of thousands.
The size of colonies has significant effects on the migration velocity (Reynolds et al., 1987; Rabouille et al., 2005), the grazing pressure (Oliver and Ganf, 2000), light attenuation (Morel and Bricaud, 1981; Bricaud et al., 1995; Fujiki and Taguchi, 2002), growth rate (Reynolds, 1997), and nutrient uptake. Therefore, we hypothesize that Microcystis would dominate in certain ecological systems with a competitive colony size distribution. Development of an approach that is capable of simulating the distribution of the populations in a vertically stratified water body with distributed colony sizes is needed to explain and predict the dominance of Microcystis in stratified water bodies.
The purpose of this study was to describe the migration of Microcystis colonies with different sizes by using the particle trajectory approach. A mathematical model was established to simulate the vertical distribution of the population of Microcystis over time scales of one day in a calm body of water. The study examined various environmental factors that affect the movement of Microcystis, such as diffusion, temperature profiles, and sunlight intensity. Comparison of the results of model simulation and field data was performed, and the advantages of using the trajectory approach in simulating the population distribution of Microcystis were discussed.
Materials and Methods
Study site
Hsin-shan Reservoir (25°7′N, 121°42′E) is an off-channel reservoir with an average depth of 20 m, located in the northwestern part of Taiwan and with the sole purpose of drinking water supply. The water column is stratified and often eutrophic from May to October every year. Microcystis sp. dominates the algal assemblage during this bloom season, while the nutrient level in the epilimnetic water may still be low.
Field investigation of diurnal migration of Microcystis
Samples were taken in Hsin-shan Reservoir by using a peristaltic pump slowly drawing water from surface level down to 6.5 m below water surface, at depth intervals of 1 m, every 2 h for 24 h on May 15–16, 2008. Since the peristaltic pump conveys water with a displacement mode lacking in the strong vortices that typical centrifugal pumps create, no significant change of particle sizes has been observed.
Lugol's iodine solution was added to the sample to reach a final dilution ratio of 1000:3. Algal colonies retained on membrane filters (0.45 μm) after filtration were air dried and supplemented with immersion oil, then examined and enumerated under a microscope (×1000) with phase-contrast illumination. Lugol's iodine solution, a fixative widely used to preserve freshwater and marine phytoplankton, can change cyanobacterial cell size and biovolumes (Hawkins et al., 2005); however, it is helpful in counting the number of colonies accurately.
Light intensity profile below the water surface was obtained with an underwater photometer and used to estimate the attenuation coefficient in Beer's Law (η) by line fitting.
Mathematical model
Model structure and assumptions
A one-dimensional particle trajectory scheme is used to describe the vertical movement of Microcystis colonies in the water column, which is caused by the sinking or floating forces of the individual cells (active migration) and the turbulent mixing (passive migration). Each colony is assigned a serial number (i). Its depth at time t [z(i,t)] is updated with the upward or downward displacement that has occurred during time interval t, as described in Equation (1):
where vs is the vertical sinking/floatation velocity estimated according to Stokes's Law (see Supplementary Data), and ΔΔt is the time step length. The combination of the third and the fourth terms on the right-hand side of Equation (1) is a corrected random-walk approach representing the displacement due to turbulent mixing (Csanady, 1973; Hunter et al., 1993; Visser, 1997), where Kz(z(i,t)) is the vertical diffusivity, Kz′(z(i,t)) is the gradient of Kz(z(i,t)), and Rn is a normal variance with zero mean and unit variance. A Runge–Kutta numerical method was employed to solve z(i,t). The simulation started at midnight to the next midnight. The numerical algorithm was programmed using Fortran language.
The approach to estimate the vertical diffusivity is described in the Supplementary Data. The profile of Kz shown in Fig. 1 is the averaged values estimated from the shift of the temperature profile within a period of a month (from May 15 to June 17, 2008).
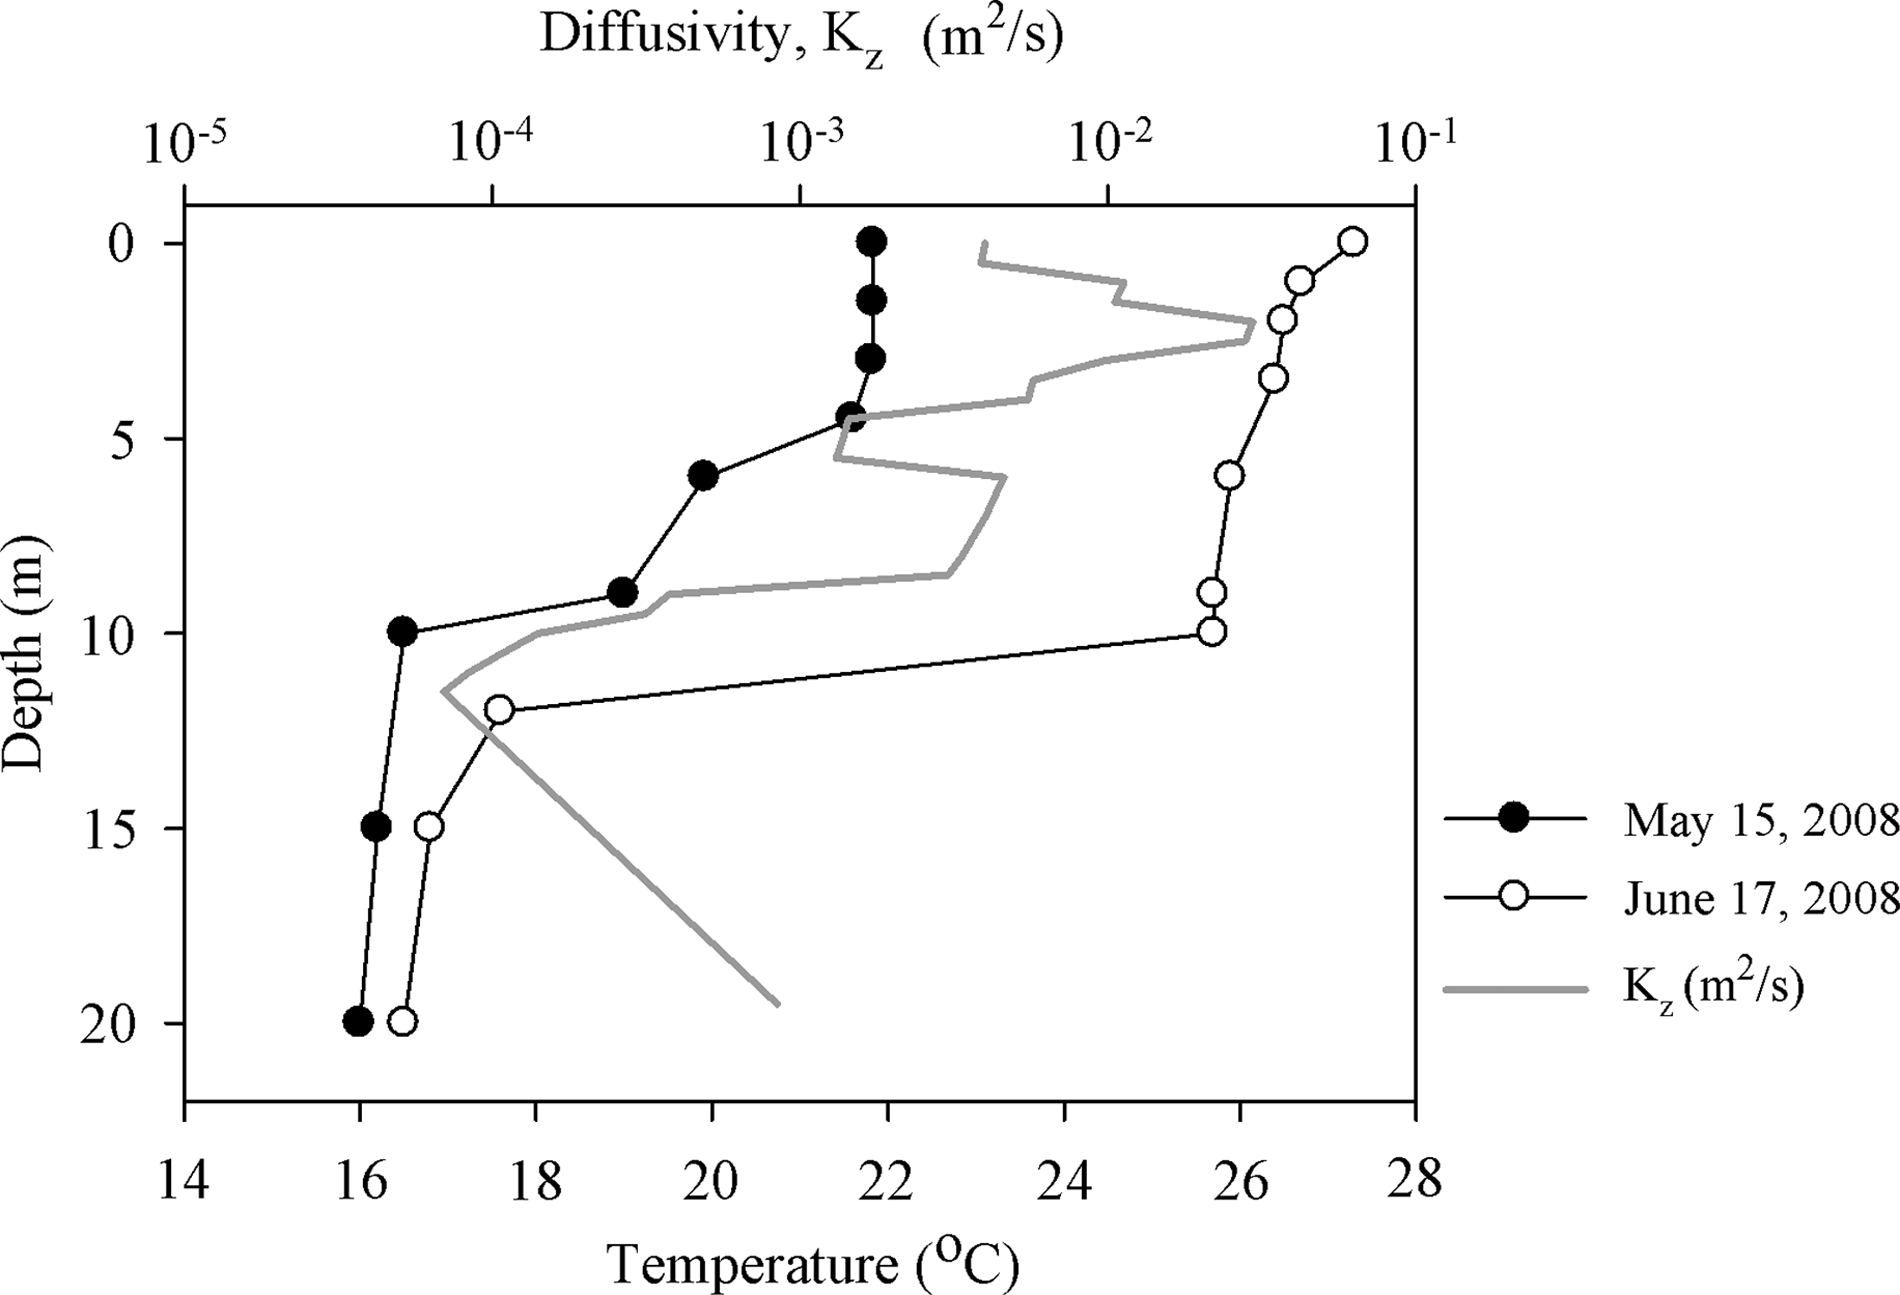
The measured temperature profiles and estimated diffusivity (Kz).
Density change of Microcystis
Change of the density of Microcystis (ρ) occurs primarily through the change of the content of carbohydrate ballast (Thomas and Walsby, 1985; Kromkamp et al., 1986; Kromkamp and Walsby, 1990). A simple empirical buoyancy regulation model for Microcystis, used to predict the vertical position of colonies in turbulent environments, has been developed in Visser et al. (1997), in which the density change rate [D(i,t)] is in response to photon irradiance (see Supplementary Data). The irradiation to which each Microcystis colony is exposed at the time t [I(i,t)] is the irradiance at the depth where the specific colony stays. The surface light intensity [I0] is approximated with a semi-sine function. The incidence on the water surface [I0,W] is obtained from I0 multiplying the transmittance estimated from Fresnel's Law. The irradiance [I(z,t)] attenuating through depth of z is obtained according to Beer's Law (see Supplementary Data).
The change in cell density at each time step is given by Equation (2):
The starting value of density was set to 980 kg/m3. The upper and lower limits of colony density were set according to Reynolds (1987).
Colony size distribution
Only a few studies have reported the algal colony-size distribution in some special cases (Dubelaar and van der Reijden, 1995; Kurmayer et al., 2003; Wu and Kong, 2009). A flow cytometric approach has been applied to analyze the Microcystis colony volume in a natural water sample, which showed that the distribution of the logarithmic total colony volume versus logarithmic radius was likely a skewed bell-shape distribution with more abundant smaller-size colonies than larger-size colonies (Dubelaar and van der Reijden, 1995). Therefore, the colony-size distribution in this study was set to be one type of beta distribution and the range was set to be between 10 and 500 μm, as observed in the field. One thousand colonies, whose colony size was a beta distribution with shape factors α=2 and β=5 (see Supplementary Data), were generated to mimic the populations of Microcystis in the field. Since there was neither significant growth to support the enlargement of the colonies nor drastic weather conditions to break the colonies, the size distribution was assumed not to change during a one-day simulation. It was also assumed that there was 60% efficiency in occupancy of the colony volume by cells. The relative population of Microcystis cells was estimated by summing up the number of cells in all colonies in a unit volume. The values of the parameters used in these simulations are shown in Table 1.
Unpublished data from experiments.
Field data.
Results from the best fit of field data.
Estimated from field data.
Observations of this study.
Reynolds et al. (1987).
Results
Results of field investigation
The temperature profile of the reservoir showed a well-mixed epilimnion with a temperature at 22°C and a cooler hyperlimnion at 16°C, with thermocline located between 5 and 10 m below the surface on May 15, 2008 (Fig. 1). Surface temperature was raised to 27°C, and that of the hypolimnion was 17°C on June 17, 2008. During the 24-h period of sampling, the temperature change at each depth was <1°C, which would have little influence on water density profile. The observed distribution of Microcystis population in Hsin-shan Reservoir on May 15–16, 2008, indicates that a significant portion of Microcystis colonies started to sink during the afternoon of that day, disappeared beyond 6.5 m depth during the early night, moved upward after midnight, and appeared near surface again before dawn (Fig. 2).
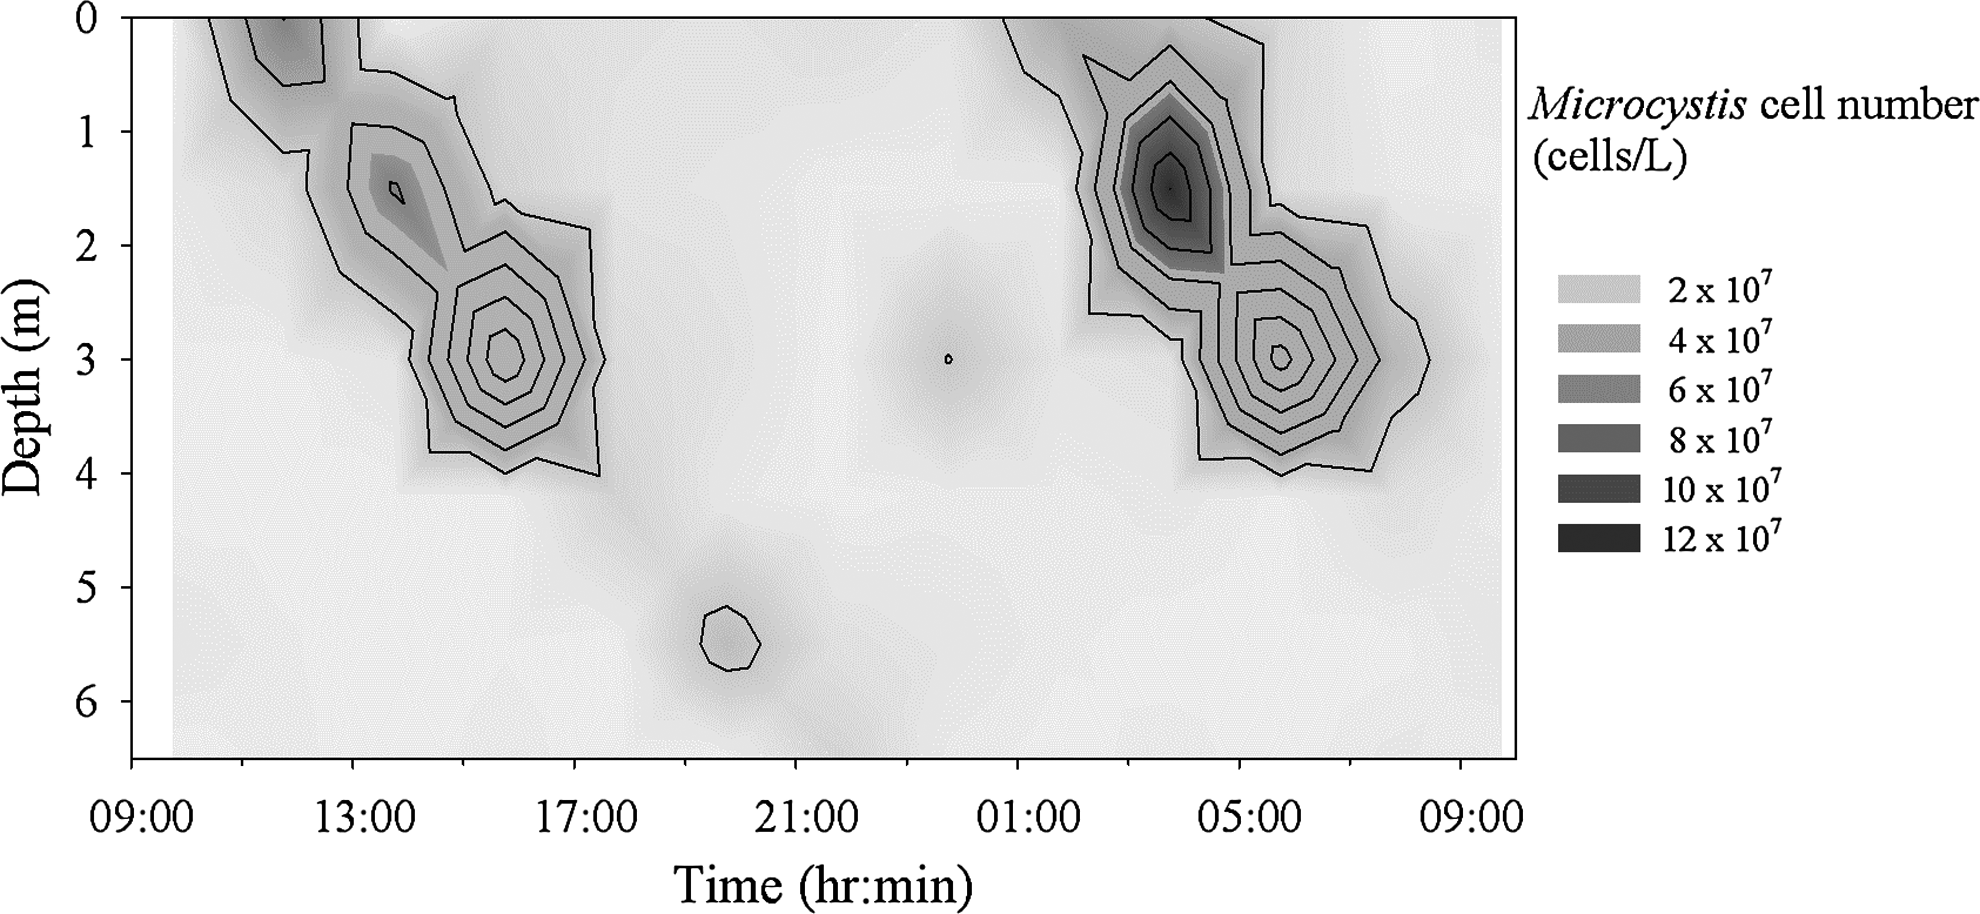
The vertical distribution of Microcystis cell population observed in Hsin-Shan Reservoir, May 15–16, 2008.
A focusing of algal cells appeared at 6 a.m. around the depth of 3 m. It seemed that a portion of colonies had started to sink in the early morning from the near-surface layer. The reason of this phenomenon is not yet known and needs to be clarified in the future.
The total areal sum of accumulated cell numbers from the water surface down to 6.5 m below surface during the experimental period is shown in Fig. 3. Although the accumulated amount of cells seemed to be varying due to the fact that some Microcystis migrated deeper than 6.5 m below the water surface and were not detected, the three peaks of the total accumulated cell population were approximately the same when the majority of the Microcystis population had moved to the depth shallower than 6.5 m. Other smaller values of the accumulated cell population during the day were accounted for by the population left over by the majority of Microcystis population that had moved down to the depth deeper than 6.5 m. Although the specific growth rate of Microcystis can be as high as 2 per day reported in the literature (Long et al., 2001; Downing et al., 2005), the net growth rate is not significant during the 24-h experiment in the field.

The accumulated number of cells from the water surface down to 6.5 m below the surface.
Estimation of the vertical mixing coefficient
The values of Kz in the epilimnion (Fig. 1) seem much higher than the reported field data in some stratified water bodies (Orlob and Selna, 1970; Lewis, 1983). It seems that the higher diffusivity was due to some abnormal events such as irregular upper layer inflows, extreme weather conditions, and others. The maximum Kz was set to be 10 m2/day (1.16×10⁻⁴ m2/s) in the simulation for the best fit to the field observation.
Trajectory simulation of migration of colonies with uniform size
First, by ignoring the floating and sinking process, the simulation results show that 1000 colonies, with size distribution ranging from 10 to 500 μm and following a beta distribution, started migrating from the same position, 5 m below the surface, and were finally dispersed uniformly (see Supplementary Data). The results clearly indicate that the corrected random walk model is capable of avoiding artificial focusing and predicting the positions of colonies in a density-stratified water column with some regions of low diffusivity.
To shed light on the effects of colony size and rate of density change on colony migration in a stratified water body, simulations of the position and density of colonies with uniform radii under the conditions listed in Table 1 are shown in Fig. 4. The temperature profile was set to be the same as that of May 15, 2008, and steady. Simulations were conducted for colonies of one specified uniform size each time. The results show that colony size affects Microcystis's migration pattern. The smaller the colonies were, the more random the spatial pattern of a group of 10 migration trajectories would be. The positions of the colonies showed no diurnal pattern and were controlled mainly by turbulent mixing for colonies with a radius of 50 μm (Fig. 4A-i). After a short period of time in the dark (from 0 to 6 h) when the density of colonies dropped uniformly, the rates of the increase of density were different due to a different radiation intensity at various positions for the next 12 h in the day time (see the density changes of colonies from 6 to 20 h in Fig. 4B-i). Colonies with slightly larger radii (e.g., 100 and 200 μm) obtained sufficient momentum to sink and to float up against turbulent forces (Fig. 4A-ii). However, most colonies could only return to the strongly irradiated near-surface water ∼3 days after the colonies started to sink at the beginning of the first light period. The migration cycles of colonies were longer than one day and not well synchronized. The frequency of the repeatedly up-and-down cycles could not catch up with the diurnal change of the irradiation intensity.

Simulation of the positions
The simulation results indicate that Microcystis with colony radius ≥300 μm was able to resist the turbulent mixing and migrate up and down diurnally due to their larger size and higher sinking/floating speed, according to Stokes' Law (Fig. 4A-iii–v). A radius of 300 μm is the minimum size required to achieve active diurnal migration for Microcystis.
Simulation of colony migration with distributed colony sizes
Simulation of the vertical population profile of 1000 colonies with their size in a beta distribution (α=2, β=5) is shown in Fig. 5. The intent is to show the vertical migration of Microcystis cells in only one day; hence, the net growth rate was assumed negligible (see the aforementioned results of field observation). The multiday Runge–Kutta numerical solution, in which the environmental settings were kept the same, showed that the calculated distribution converged to a diurnally steady state after the third day. Therefore, the result of the fourth day's simulation (Fig. 6) was taken for comparison with the one-day field observation.
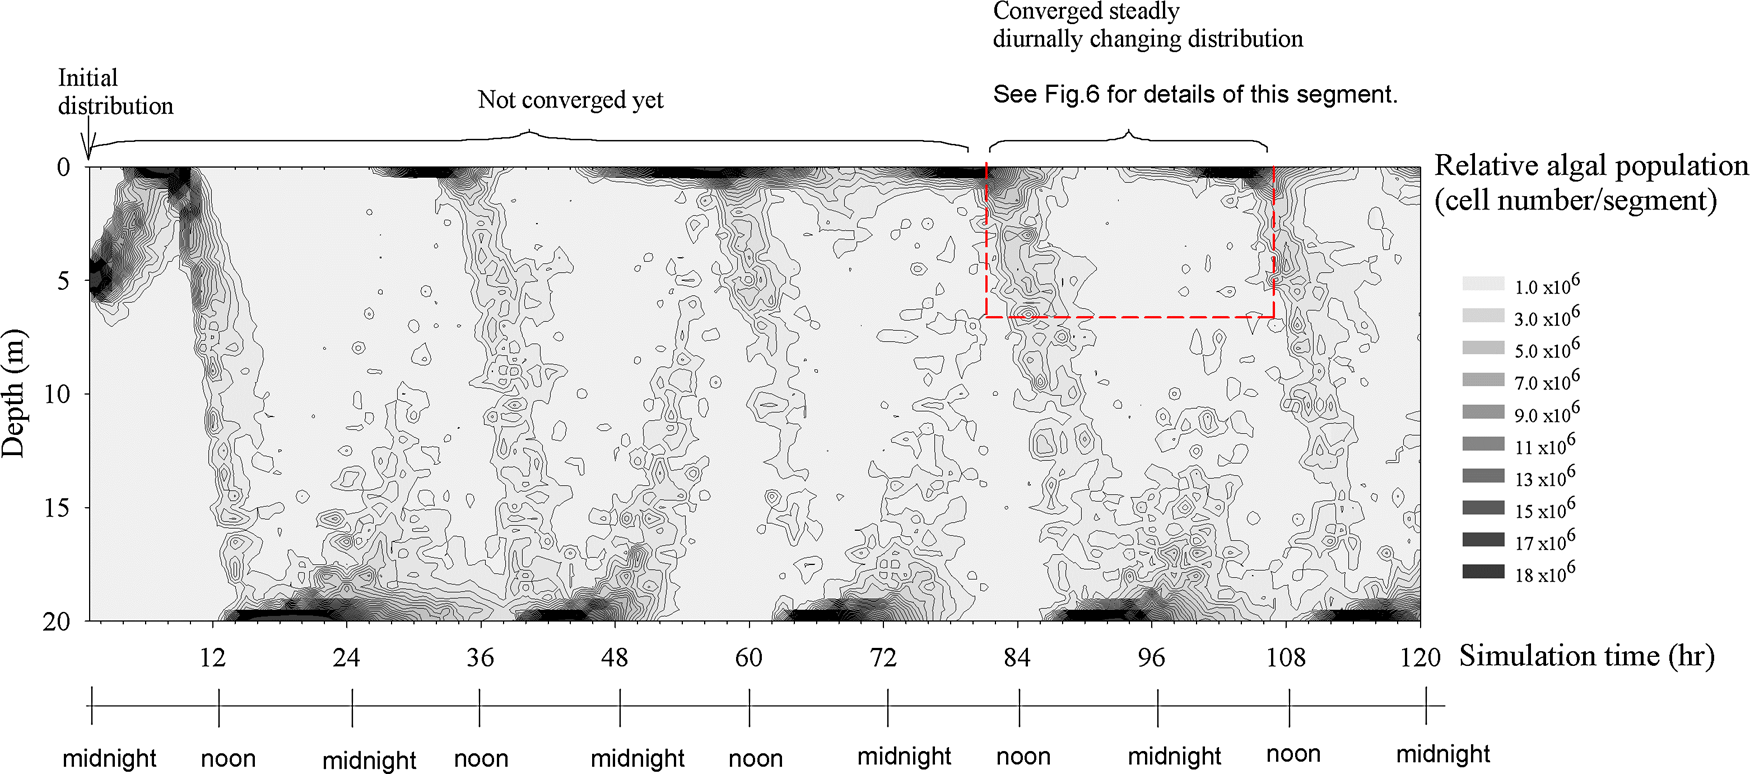
Simulation of the vertical distribution of the relative population of cells that reach a diurnally steady state in 120 h. The values of cell number have been adjusted to match the values of the field data. The dotted line indicates the same time span and spatial boundary as that of the one-day experiment.
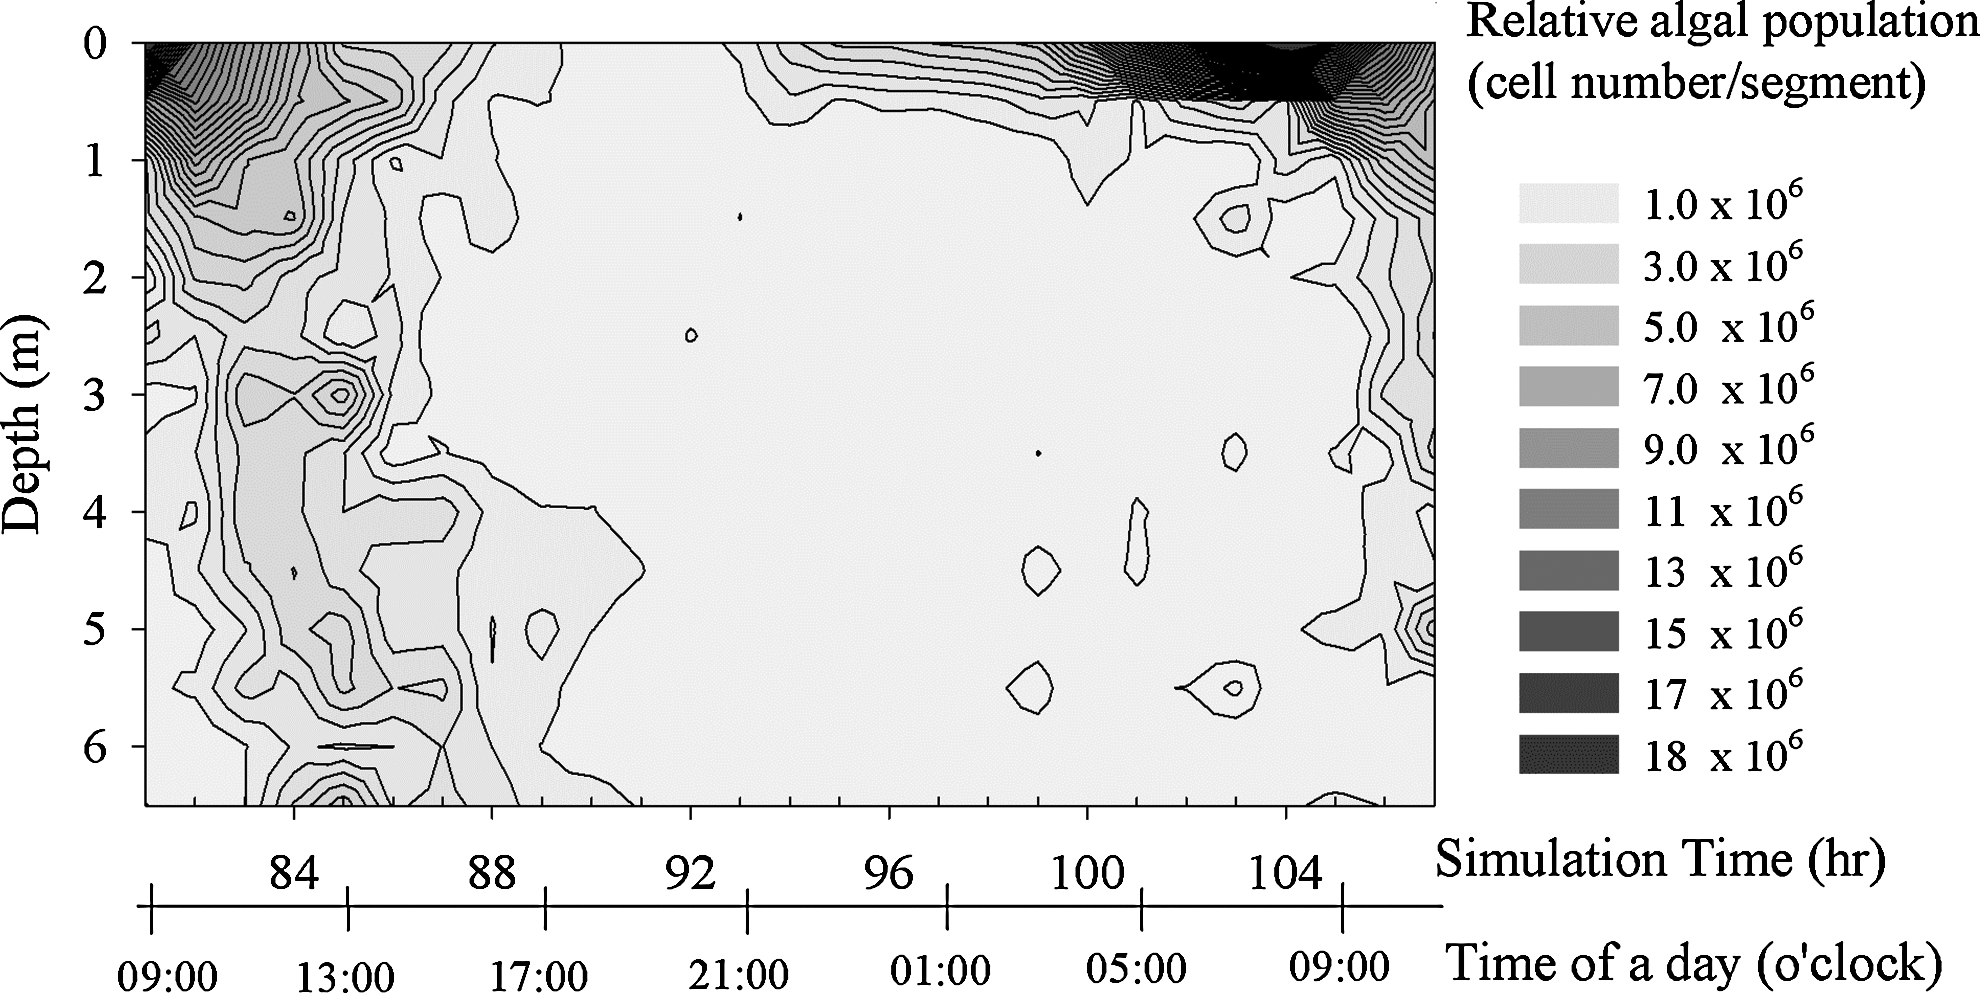
The fourth-day segment of the simulation in Fig. 5, which is within the depth of 0–6.5 m and the time from 9 a.m. on fourth day to 10 a.m. on fifth day.
Since the time range of the model simulation is only one day, the temperature profile and other aquatic properties of the water column, as well as the cell mass of all size fractions, were assumed to be steady as aforementioned. Distribution of algal population is represented as cell numbers in each 0.5 m segment (relative population), estimated by the product of the number of colonies and the number of cells in each colony. The total sum of the cell numbers was adjusted to match those observed in the field.
The 24-h spatial distribution of cells in Hsin-shan Reservoir (Fig. 2) and the simulation results (Fig. 6) show the same trend regarding the migration pattern. The cells (colonies) accumulated at the water surface in the morning, descended later in the afternoon, and were dispersed. Later after midnight, a portion of the colonies moved up and gradually accumulated in the near-surface layer. The simulation results reveal that the apparent dynamic distribution of high-density colonies was mainly due to the rapidly responding colonies with radii ranging from 300 to 400 μm, whereas smaller colonies were more homogenously scattered vertically. The trajectory modeling scheme used here is able to preserve the contribution of each size group, which has its unique pattern of migration. The approach differs from the conventional advection-diffusion model, which can only treat the particles as uniform sized.
Discussion
The results of the simulation of the dynamic change of Microcystis population profile prove that the trajectory model is able to closely represent the real migration behavior. Larger colonies overcome turbulent diffusion and get a higher frequency of cyclical shifts between the euphotic zone and the nutrient-rich deeper water layers, whereas smaller colonies are dragged by turbulent force, dispersed randomly over the mixing zone, and finally die out due to lack of sufficient irradiation or nutrients (Fig. 4A-i,ii and B-i,ii).
The diurnal migration of Microcystis or cyanobacteria in lakes and reservoirs has been reported (Saksena and Adoni, 1973; Okada and Aiba, 1983; Takamura and Yasuno, 1984; Wallace et al., 2000; Hunter et al., 2008). Algal blooms appear on water surfaces during the night and sink below the surface in strong sunlight during the day. Their observations coincide with our observation in Hsin-shan Reservoir and the results of our model prediction; however, their descriptions were only qualitative rather than quantitative and lack information on the colony sizes, shapes, or size distribution.
Wu and Kong (2009) observed that the Microcystis colonies >120 μm in diameter were mainly concentrated in the upper layer of a lake under both calm and windy conditions. Colonies from 36 to 120 μm showed a close relationship to wind conditions, whereas colonies <36 μm showed a nearly uniform vertical distribution at different depths. Investigations of O'Brien et al. (2004) and Okada and Aiba (1986) indicated that the colony size of Microcystis in well-mixed water was smaller than that in calm and stratified water. This implies that it is not necessary for Microcystis to increase the size of their colonies when there is no gap between the irradiated zone and the nutrient-rich zone. Their findings coincide with our hypothesis of the existence of a critical size distribution for dominance.
Although the larger-size colonies have the advantage of moving up and down more frequently, they may lack efficiency in nutrient uptake. The rule of having critical radii of 300 μm for dominance would only be applied for stratified and deeper water bodies such as Hsin-shan Reservoir and might not be applied under other climatic and geological conditions. For instance, it may be difficult for Microcystis colonies to reach a large size under the stress of high winds and long fetch that might break up colonies. Microcystis in shallow water, where the euphotic layer is shallower relative to the mixed layer, may not need to form larger colonies to overcome the distance between the surface euphotic zone and the enriched deep layer.
Disadvantages brought about by larger colony sizes may include slower nutrient uptake and less available light for all cells in a colony (Kirk, 1975). Higher specific area of smaller colonies could cause competitive advantages if the uptake and growth processes were considered. The present model has not yet been able to include the uptake and growth processes of Microcystis, which are critical to the dominance of Microcystis and are greatly affected by colony size.
Researchers have been modeling the migration of Microcystis by using advection-diffusion approaches, which assume that the colonies at the same position have the same size, the same density, and move in the same direction (Howard, 2001; Yamamoto and Hatta, 2004; Jöhnk et al., 2008; Serizawa et al., 2008). These models averaged the characteristics of different colonies without tracing the density of every individual Microcystis cell or its rate of density change, all of which are determined by the history of each cell. Okada and Sudo (1982) found that the specific uptake rate of phosphate or growth rate of Microcystis aeruginosa varied according to the physiological state and precultural history of each cell. Microcystis has the capability of uptaking more phosphorus than it needs until the cell quota is attained (Okada and Sudo, 1982; Grover, 1991; Shi et al., 2004).
Hence, it is preferable to simulate the behavior of Microcystis populations by using a trajectory approach that includes “memories” of the colonies from the previous time steps. In addition, water temperature varies with time and depth, as shown in the example in Fig. 1. This alters the migration pattern of Microcystis colonies by affecting the effective buoyancy of algal cells, the density gradient, and the mixing coefficient. All of these effects could be taken into consideration in this developing model by inputting water temperatures at different depths.
The present model can only be applied temporarily with a precondition of a diurnally steady state. The growth of algal cells and the change of colony sizes due to the multiplication of cells can be considered in future model development for real-time simulation of algal population and other water quality parameters. Other state variables, such as internal nutrient content and previous light absorption, cannot be assumed to be the same in colonies in each sublayer either. A trajectory model can take into consideration these factors better than can an advection-diffusion model. The processes of nutrient uptake and growth are critical for dominance and are greatly affected by these state variables and colony size. All of these processes will be included in the model in the future.
Footnotes
Acknowledgments
The authors are grateful to the Hsin-shan Reservoir Authority for its assistance with the field investigation and to the National Science Council (R.O.C.) for its partial financial support of this study through grant number NSC 96-2221-E-002-058-MY3.
Author Disclosure Statement
No competing financial interests exist.
References
Supplementary Material
Please find the following supplemental material available below.
For Open Access articles published under a Creative Commons License, all supplemental material carries the same license as the article it is associated with.
For non-Open Access articles published, all supplemental material carries a non-exclusive license, and permission requests for re-use of supplemental material or any part of supplemental material shall be sent directly to the copyright owner as specified in the copyright notice associated with the article.