
Abstract
Abstract
This manuscript reports findings on sediment oxygen demand (SOD), gross primary production (GPP), net daily metabolism (NDM), and stream reaeration in an urbanized stream, the Jordan River, in Utah. The river has two segments; the Lower Jordan River, which is impaired for dissolved oxygen (DO) and the Upper Jordan River, which is fast flowing with coarse sediments and has no DO impairment. Summer SOD values for the Lower Jordan River ranged from a high 2.2 g DO/m2 per day to a low of 0.97 g DO/m2 per day with most of the sampled sites in the Lower Jordan River having SOD values greater than 1 g DO/m2 per day. SOD values correlated well with volatile solids in surface sediments of the Lower Jordan River. The Upper Jordan River showed SOD values as high as 3.0 g DO/m2 per day, which was attributed to hyporheic exchanges or groundwater upwelling. All sampled sites exhibited high SOD values in winter. A modified chamber method was employed to estimate community respiration (CR24), GPP, and NDM, while characterizing both the water column and benthos. In summer 2010, the sediment tray primary production (TPP) ranged from 1.0 to 7.4 g DO/m2 per day. In winter 2011, TPP ranged from 0.7 g DO/m2 per day to a high value of 5.6 g DO/m2 per day. NDM values indicated that the Upper Jordan River is a year round source of in-stream produced organic matter to the downstream Lower Jordan River with the majority of organic matter produced in the benthos. Reaeration measurements showed that the potential for reaeration is much higher in the mid-sections of the Jordan River, where the river has increased flow velocities due to topography, decreased depths, and a less uniform bottom.
Introduction
In general, the pollution status of surface water bodies can be accessed through dissolved oxygen (DO) dynamics. DO impairments can be chronic as well as acute problems with extreme cases typically associated with individual events, such as a large algal bloom. This rapid increase in aquatic biomass eventually dies and settles, which depletes DO within the water column (WC) as the organic material undergoes bacterial decomposition in the benthic zone. The presence of low DO itself does not mean that DO is a pollutant (Utley et al., 2008; Todd et al., 2009). Instead, low DO provides an indication of other activities, which may have triggered low DO in the water body. These other activities may have been catalyzed by the input of pollutants such as nutrients and organic matter (Parr and Mason, 2004; Stringfellow et al., 2009). According to the widely accepted stream metabolism theory, the primary factors that determine the fate of DO in streams are DO consumption in the WC and sediments, and DO exchange between the atmosphere and the WC through physical reaeration and oxygen stripping to the air from supersaturated waters. A third factor that can significantly contribute to DO concentrations in the WC is the primary production. During primary production, algae and other phototrophs present in the WC or attached to the sediment substrate produce oxygen and organic matter during photosynthesis.
Lotic systems have organic matter budgets composed primarily of coarse particulate organic matters (CPOM), fine particulate organic matters (FPOM), and dissolved organic matter (DOM). Organic matter originates throughout the watershed, but in-stream contributions may be significant in eutrophic surface waters. In-stream primary producers include both phytoplankton and periphyton such as green algae, cyanobacteria, diatoms, and macrophytes (Hauer and Lamberti, 2007).
Stream restoration efforts are often employed in urban areas to improve aesthetics, habitat, and surface water quality. Under section 303(d) of the clean water act, state, territories, and tribes are required to develop lists of impaired waters based on the standards set by the state and federal regulatory agencies. A Total Maximum Daily Load (TMDL) calculation for specific pollutants of concern is performed to determine the amount of pollutants (organics or nutrients) a water body can receive without questioning the long-term sustainability of that water body. A complete TMDL study requires extensive sampling, modeling, laboratory-, and field-scale experiments. During a TMDL development, pollutant loads from various point and nonpoint sources are estimated through field-scale monitoring and water budgets. The final stage of a TMDL includes load allocations and decision making associated with revised pollutant discharge permits. Hence, a proper TMDL practice for load allocation requires a thorough quantification of DO dynamics associated with nighttime respiration, reaeration coefficients, and primary production rates within the sediments and WC.
Sediment oxygen demand (SOD) accounts for the depletion of DO due to the decomposition of settled organic material, the respiration of benthic flora and fauna, and the biotic and abiotic oxidation of reduced inorganic chemical species in the sediments (Utley et al., 2008; Todd et al., 2009). SOD can be measured in the laboratory using sediment cores as well as in-situ using chamber methods. However, in-situ measurements are preferred over laboratory-scale experiments to avoid uncertainties associated with disturbance of sediments and stream velocity. Mathematical modeling, using tools such as QUAL2Kw, are used to simulate natural systems and predict DO dynamics based on SOD and other parameter measurements at selected locations (Pelletier et al., 2006; Utley et al., 2008). Models that underestimate SOD can greatly misrepresent DO profiles in streams. The accuracy of model predictions largely depends upon the input of SOD values, and the greater the number of SOD measurements, the better the model predictions will be.
Replenishment of DO into the WC due to atmospheric reaeration and daytime photosynthesis are constantly occurring at varying rates to achieve equilibrium between the ambient river DO deficit/surplus and atmospheric conditions. Reaeration potential is generally expressed in terms of a 1st order reaeration coefficient. Common techniques used to determine reaeration coefficients include conservative gas and dye injection into the stream (Tsivoglou et al., 1968), floating of nitrogen gas-filled diffusion dome (Cavinder, 2002), diurnal models utilizing ambient DO profiles (Chapra and Di Toro, 1991), and predictive equations based on stream depth, velocity, and slope (Bowie et al., 1985). All these techniques have pitfalls and challenges. For example, gas injection studies require substantial infrastructure, including gas/dye sources/injection methods and laboratory equipment, to quantify gas/dye concentrations. In addition, the gas injection method can become very expensive and labor intensive when investigating rivers with large flows. Diffusion dome studies are cheaper, easier to complete, and can be utilized in large rivers, but cannot be employed in extremely turbulent and shallow conditions. Diurnal DO models can estimate reaeration, community respiration (CR24), and gross primary production (GPP), but are heavily influenced by groundwater inputs (Hall and Tank, 2005). Predictive equations are simple and require only a small amount of initial data to utilize, but can be grossly misleading if incorrect assumptions are made in the equation selection and parameters inputs. Nevertheless, in-situ methods are preferred over predictive equations and should be employed for the determination of reaeration coefficients.
SOD can contribute to significant DO depletion in streams and can contribute to stream impairment, whereas reaeration and primary production (during daytime) are important processes providing DO in rivers. Hence, it is imperative to study and quantify the relative contribution of each of these parameters for proper TMDL practices and stream management. The main objectives of this study were to (1) estimate SOD at representative locations in an urban river using in-situ techniques, (2) evaluate primary production and net daily metabolism (NDM) using a modified in-situ chamber method and, (3) measure reaeration coefficients at selected locations using a modified floating dome method. These measurements were conducted in the Jordan River, UT, which has been heavily impacted by urbanization.
Materials and Methods
Description of site (Jordan River)
The 52-mile-long Jordan River flows south to north from the Utah Lake through the urbanized Salt Lake Valley before entering a complex of constructed wetlands at the Burnham Dam and finally discharging into the terminal Great Salt Lake (Fig. 1). The Jordan River flows through 15 municipalities, three counties, and receives the direct discharge of three municipal wastewater treatment plants (WWTP). In addition, the Jordan River receives sediment and pollutant inputs from an 800-square-mile watershed with the lowlands rapidly being urbanized, while contributing additional untreated diffuse runoff.

Aerial view of the Jordan River depicting different reaches and tributaries contributing to the Jordan River. Flow direction is from the Utah Lake to the Great Salt Lake.
Figure 1 provides an aerial view of the Jordan River showing different hydraulic reaches and locations of WWTP discharges. The Jordan River is classified in two distinct segments known as the Upper Jordan River and the Lower Jordan River based on location upstream or downstream of the Surplus Canal diversion. The Upper Jordan River is characterized by swift flows, coarse sediment substrates and no DO impairment. The Upper Jordan River bifurcates into the Surplus Canal and the Lower Jordan River near the 2100 S cross street (Fig. 1), where 70%–80% of the Upper Jordan River's annual steam flow is diverted. The Surplus Canal diversion at 2100 S is used to mitigate flooding and bank erosion in the Lower Jordan River as it flows through the Salt Lake City. The stretch of the river downstream of the 2100 S site is designated as the “Lower Jordan River” by the Utah Division of Water Quality (UDWQ). As a result of this flow diversion and naturally flat topography near the Great Salt Lake, the Lower Jordan River is characterized by slow velocities, low reaeration potential, and an increased settling of suspended solids. In addition, the lower segment of the Jordan River is surrounded by dense population and industrialization associated with the Salt Lake City.
A total of 13 sites (Table 1) were chosen based on their vicinity to WWTP discharges, stormwater drains, population density, land use, and flow velocities. A great deal of effort was dedicated toward locating representative SOD sampling locations. Furthermore, the sampling was done in summer (July-August) and in winter (December-January) to evaluate seasonal variations.
SOD, sediment oxygen demand; DO, dissolved oxygen.
SOD and WCdark chamber details, deployment, and equations
Figure 2 shows schematics of the aluminum SOD and WC chambers used to measure dark respiration. The top section of each chamber consisted of a lid housing the pump, plumbing, water sampling tube, water quality probe connection, and attachments for ropes used to lift the SOD chamber out of the sediments and water. A submersible pump was mounted on each chamber to internally circulate the water within the chamber at a flow rate of 11 L/min to ensure uniform DO concentrations within the chamber. The influent and effluent ends of the pump were located inside the chamber and were connected to a PVC pipe with several small orifices to evenly distribute the circulating water inside the chamber.
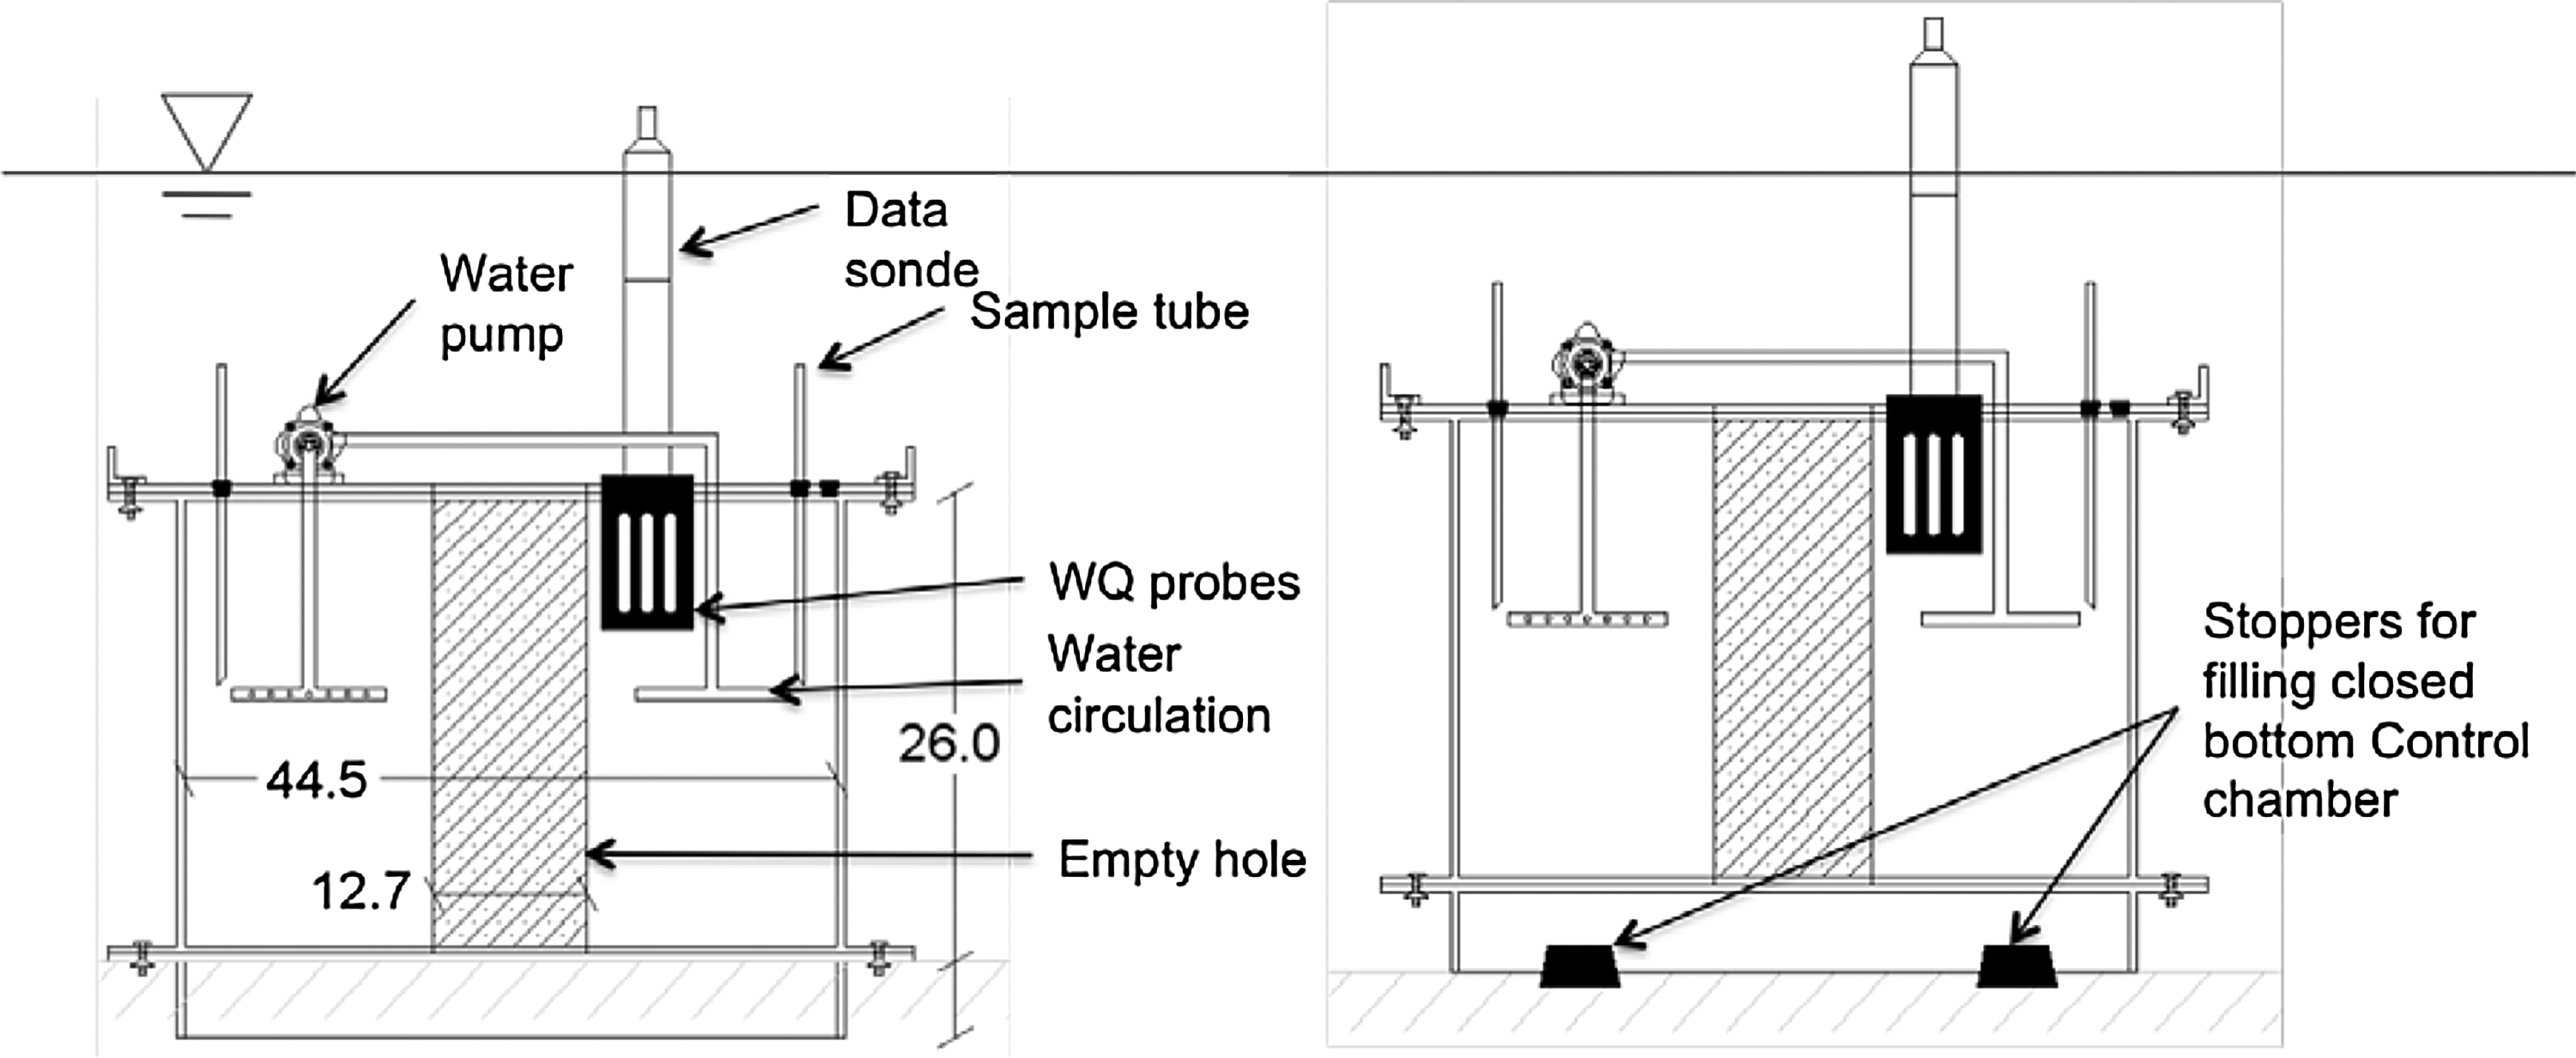
Schematic of sediment oxygen demand (SOD) chambers used in the study. Left: the testing SOD chamber; right: dissolved oxygen (DO) depletion rate in the water column (WC) chamber.
Both WC and SOD chambers were identical in construction and operation with the exception that the WC chamber was closed at the bottom and the SOD chambers were open. The WC chamber measured oxygen consumption due to dark respiration in the WC only and is referred to as WCdark. The SOD chambers measured oxygen consumption in the WC as well as the sediment–water interface and are referred as SOD 1 and SOD 2. Two SOD chambers were used to account for riverbed heterogeneities and average fluxes were used to calculate SOD at each site.
Chambers were installed from a downstream location to upstream at each site to ensure undisturbed sediments. To deploy the WC chamber, two large stoppers were removed from the bottom to fill the chamber with river water and the stoppers were replaced. When installing the SOD chambers, the bottom cutting edge was pushed 4 cm into the sediments to isolate the chamber water above the benthos and avoid any hydraulic connection with the ambient river water. A proper SOD chamber placement was verified by confirming that the bottom flange connecting the cutting edge to the chamber was resting directly on top of the sediments (Fig. 2, left). After placing the chambers, the water quality Sondes were installed into the probe housing on the chamber lids and the water circulation pumps were turned on. Sondes were equipped with data acquisition sensors for DO, temperature, conductivity, and pH (In-Situ Inc. model Troll 9500).
SOD was calculated using Equation (1) (Butts, 1974; Butts and Evans, 1978; Chiaro and Burke, 1980; Bowie et al., 1985; Murphy and Hicks, 1986). WCdark was subtracted from the bulk SOD chamber oxygen demand (ODbulk) in Equation (1) to account for any respiration associated with phytoplankton and biochemical oxygen demand. It should be noted that dark respiration results in the consumption of DO and all dark respiration rates used in calculations in this manuscript are negative values.
SOD=1.44(V/A)(ODbulk−WCdark) (1)
where:
SOD=sediment oxygen demand (g DO/m2 per day)
ODbulk=bulk DO depletion rate in SOD chamber (mg DO/L per minute)
WCdark=DO depletion rate in WC chamber (mg DO/L per minute)
1.44=unit conversion (mg DO/L per minute to g DO/ L per day)
V=volume of SOD and clear chambers (38 L)
A=sediment area contained within the chamber (0.16 m2)
A modified Arrhenius equation with a dimensionless coefficient of 1.065 was used to normalize in-situ SOD values to 20 centigrade (SOD20) for comparison purposes (Berthelson et al., 1996). Sediments at each site were characterized in terms of volatile solids (%VS) (APHA et al., 2005). Furthermore, SOD measurements were conducted in the winter season to evaluate the effect of temperature on SOD.
NDM chambers, deployment, and equations
NDM in the Jordan River was estimated by measuring CR24 and GPP using modified SOD chamber methods. The chamber design was based on the work by Bott et al., (1978) and built to be directly comparable with the SOD and WC chambers. The NDM chambers were made from clear lexan plastic to be transparent, were filled with river water by removing the lid, and had closed bottoms to utilize sediment trays instead of placing the chamber over the sediments. A variety of chambers designs, sediment cores, and open water methods have been utilized to measure NDM in lotic environments (Uzarki et al., 2001). The rationale for using closed bottom chambers containing sediment trays to measure NDM in this study included (1) the ability to place the NDM chambers in faster flowing water since open bottomed SOD chambers tend to quickly erode allowing ambient river water into the chamber, (2) the exclusion of hyporheic/groundwater upwelling into the chamber that may overestimate SOD and underestimate sediment primary production, (3) the exclusion of methane gas produced at sediment depths deeper than 5 cm. The sediment trays are described in a later section.
Seven locations were revisited for seasonal NDM measurements. At each location, five chambers were installed, two open bottomed aluminum SOD chambers, two closed bottom transparent NDM chambers containing sediment trays, and one closed bottom transparent improved WC chamber. The improved WC chamber was used to measure DO consumption and production rates in the WC during both dark (WCdark) and light respiration (WClight), respectively. The transparent WC chamber was initially covered with a black bag for 3 hr to measure WCdark, and then the black bag was removed to expose the chamber to sunlight for 3 hr to measure the maximum rate of WC primary production (WClight,m). Since primary production rates are not consistent over the diurnal period, the black bags were removed at solar noon to measure the maximum rate of photosynthesis. The two closed bottom clear NDM chambers were utilized to measure DO consumption/production rates associated with the WC and sediment trays during both dark and light conditions by initially covering the chambers with black bags. Dark respiration associated with the sediment trays in the NDM chambers is designated as sediment tray oxygen demand (TOD) and was calculated using Equation (1). In other words, TOD should be the equivalent of SOD, but was measured using sediment trays in a completely sealed chamber.
The black bags were removed from the NDM chambers at solar noon (approximately 1:00 PM in summer, and 11:30 AM in the winter) to measure light respiration with the assumption that the maximum rate of primary production is occurring at this time. After removing the black bags from the NDM chambers, the net oxygen dynamics associated with primary production and respiration in the WC and sediment trays was measured (TPPbulk,m). Primary production occurs during the daylight hours, or photoperiod, and can only be measured as a net rate that includes dark respiration. Hence, to calculate the maximum rate of primary production due to periphyton on the sediments (TPPm), the WClight,m was subtracted from TPPbulk,m and TOD was subtracted from the resulting value. The calculation is shown in Equation (2) below.
TPPm=(1.44(V/A)(TPPm,bulk−WClight,m))−TOD (2)
where:
TPPm=maximum rate of sediment tray primary production (g DO/m2 per day)
TPPm,bulk= maximum rate of sediment tray bulk primary production (mg DO/L per minute)
WClight,m= maximum net oxygen production rate in the WC chamber (mg DO/L per minute)
TOD=sediment tray oxygen demand (g DO/m2 per day)
Both autotrophic and heterotrophic dark respiration in the sediments and WC is assumed to occur at a consistent rate throughout the diurnal period. Therefore, the dark respiration oxygen depletion rates, TOD and WCdark, can be used directly in NDM estimates. Since TPPm and WClight,m were measured midday and are assumed to be the maximum rate of photosynthesis, they cannot be directly compared to SOD, TOD, and WCdark respiration rates. Therefore, both TPPm and WClight,m were converted to average daily oxygen production rates to quantify sediment Tray Primary Production (TPP) and WClight using the following equations (Chapra, 2008):
TPP=TPPm(2f/π) (3) WClight=(WClight,m–WCdark)(2f/π) (4)
where:
TPP=average daily sediment tray oxygen production rate (g DO/m2 per day)
TPPm=maximum rate of sediment tray oxygen production (g DO/m2 per day)
f=photoperiod or fraction of 24-h period receiving sunlight (day)
WClight=average daily oxygen production rate in the WC (g DO/ m3 per day)
After normalizing the maximum oxygen production rate to a 24-hr average based on the length of daylight, SOD, TOD, and TPP can be directly compared as sediment fluxes, and WCdark and WClight can be directly compared as volumetric rates.
NDM is defined as the difference in diurnal DO dynamics resulting from GPP and CR24 (Hauer and Lamberti, 2007). NDM can be used as an indication of whether heterotrophic (<0) or autotrophic (>0) conditions prevail and to calculate instream organic matter production rates. This same relationship can be applied to both the sediments (TPP and TOD) and the WC (WClight and WCdark) to further describe ambient DO dynamics in the Jordan River.
NDM=GPP+CR24 (5)
GPP=TPP+(WClight×d) (6)
CR24=TOD+(WCdark×d) (7)
where:
NDM=net daily metabolism (g DO/m2 per day)
GPP=gross primary production (g DO/m2 per day)
d=mean WC depth (m)
CR24=community respiration (g DO/m2 per day)
Sediment tray details
Before chamber installations, the top 5 cm of local sediments from each site were carefully transferred into sediment trays by a shovel. The trays were then buried in the Jordan River to allow roughly 1 cm of sediments above the lip of the tray to reduce localized flow variations leading to scouring (Hauer and Lamberti, 2007). The trays remained within the river for a minimum of 5 weeks to allow recolonization of the benthic community, including both heterotrophs and autotrophs (Bott et al., 1985). The use of sediment trays allowed for the study of a wide range of relatively undisturbed substrates ranging from silts, sands, gravel, cobbles, and detritus. While the trays were incubating in the river bottom, leaves, phragmite stalks, detached macrophytes, sticks, and anthropogenic litter needed to be removed from the tray handles protruding from the sediments. The sites needed to be regularly visited to confirm that the trays did not erode out of the sediments due to fluctuating stream velocities. If the lids of the trays were observed above the sediments, the trays were carefully removed without disturbing the contents and repositioned deeper within the river sediments. After the recolonization period, the sediment trays were carefully removed and placed in the closed bottom transparent NDM chambers during sampling. In addition, the tray handles were thoroughly cleaned with steel wool before chamber testing to remove any benthic growth present on the exposed sediment tray handle.
Physical reaeration measurement
The floating diffusion dome method was used to estimate reaeration rates in seven stretches of the Jordan River (Copeland and Duffer, 1963; Cavinder, 2002). These river sections collectively represented typical base flow characteristics found in the Jordan River. Table 2 shows the details of all seven stretches. As shown in Figure 3, the diffusion dome was constructed from 1/4” thick acrylic to have 10-L of headspace and 0.16 m2 of contact area between the dome headspace–river water interface. The bottom rim of the diffusion dome sat 1/2” below the water surface to ensure an airtight seal. Attachments for the DO probe were incorporated into the inside of the dome. In addition, a sun cover and shower circulating ambient river water over the entirety of the dome was utilized to ensure that temperatures within the dome headspace did not exceed ambient river temperatures (Belanger and Korzun, 1991).
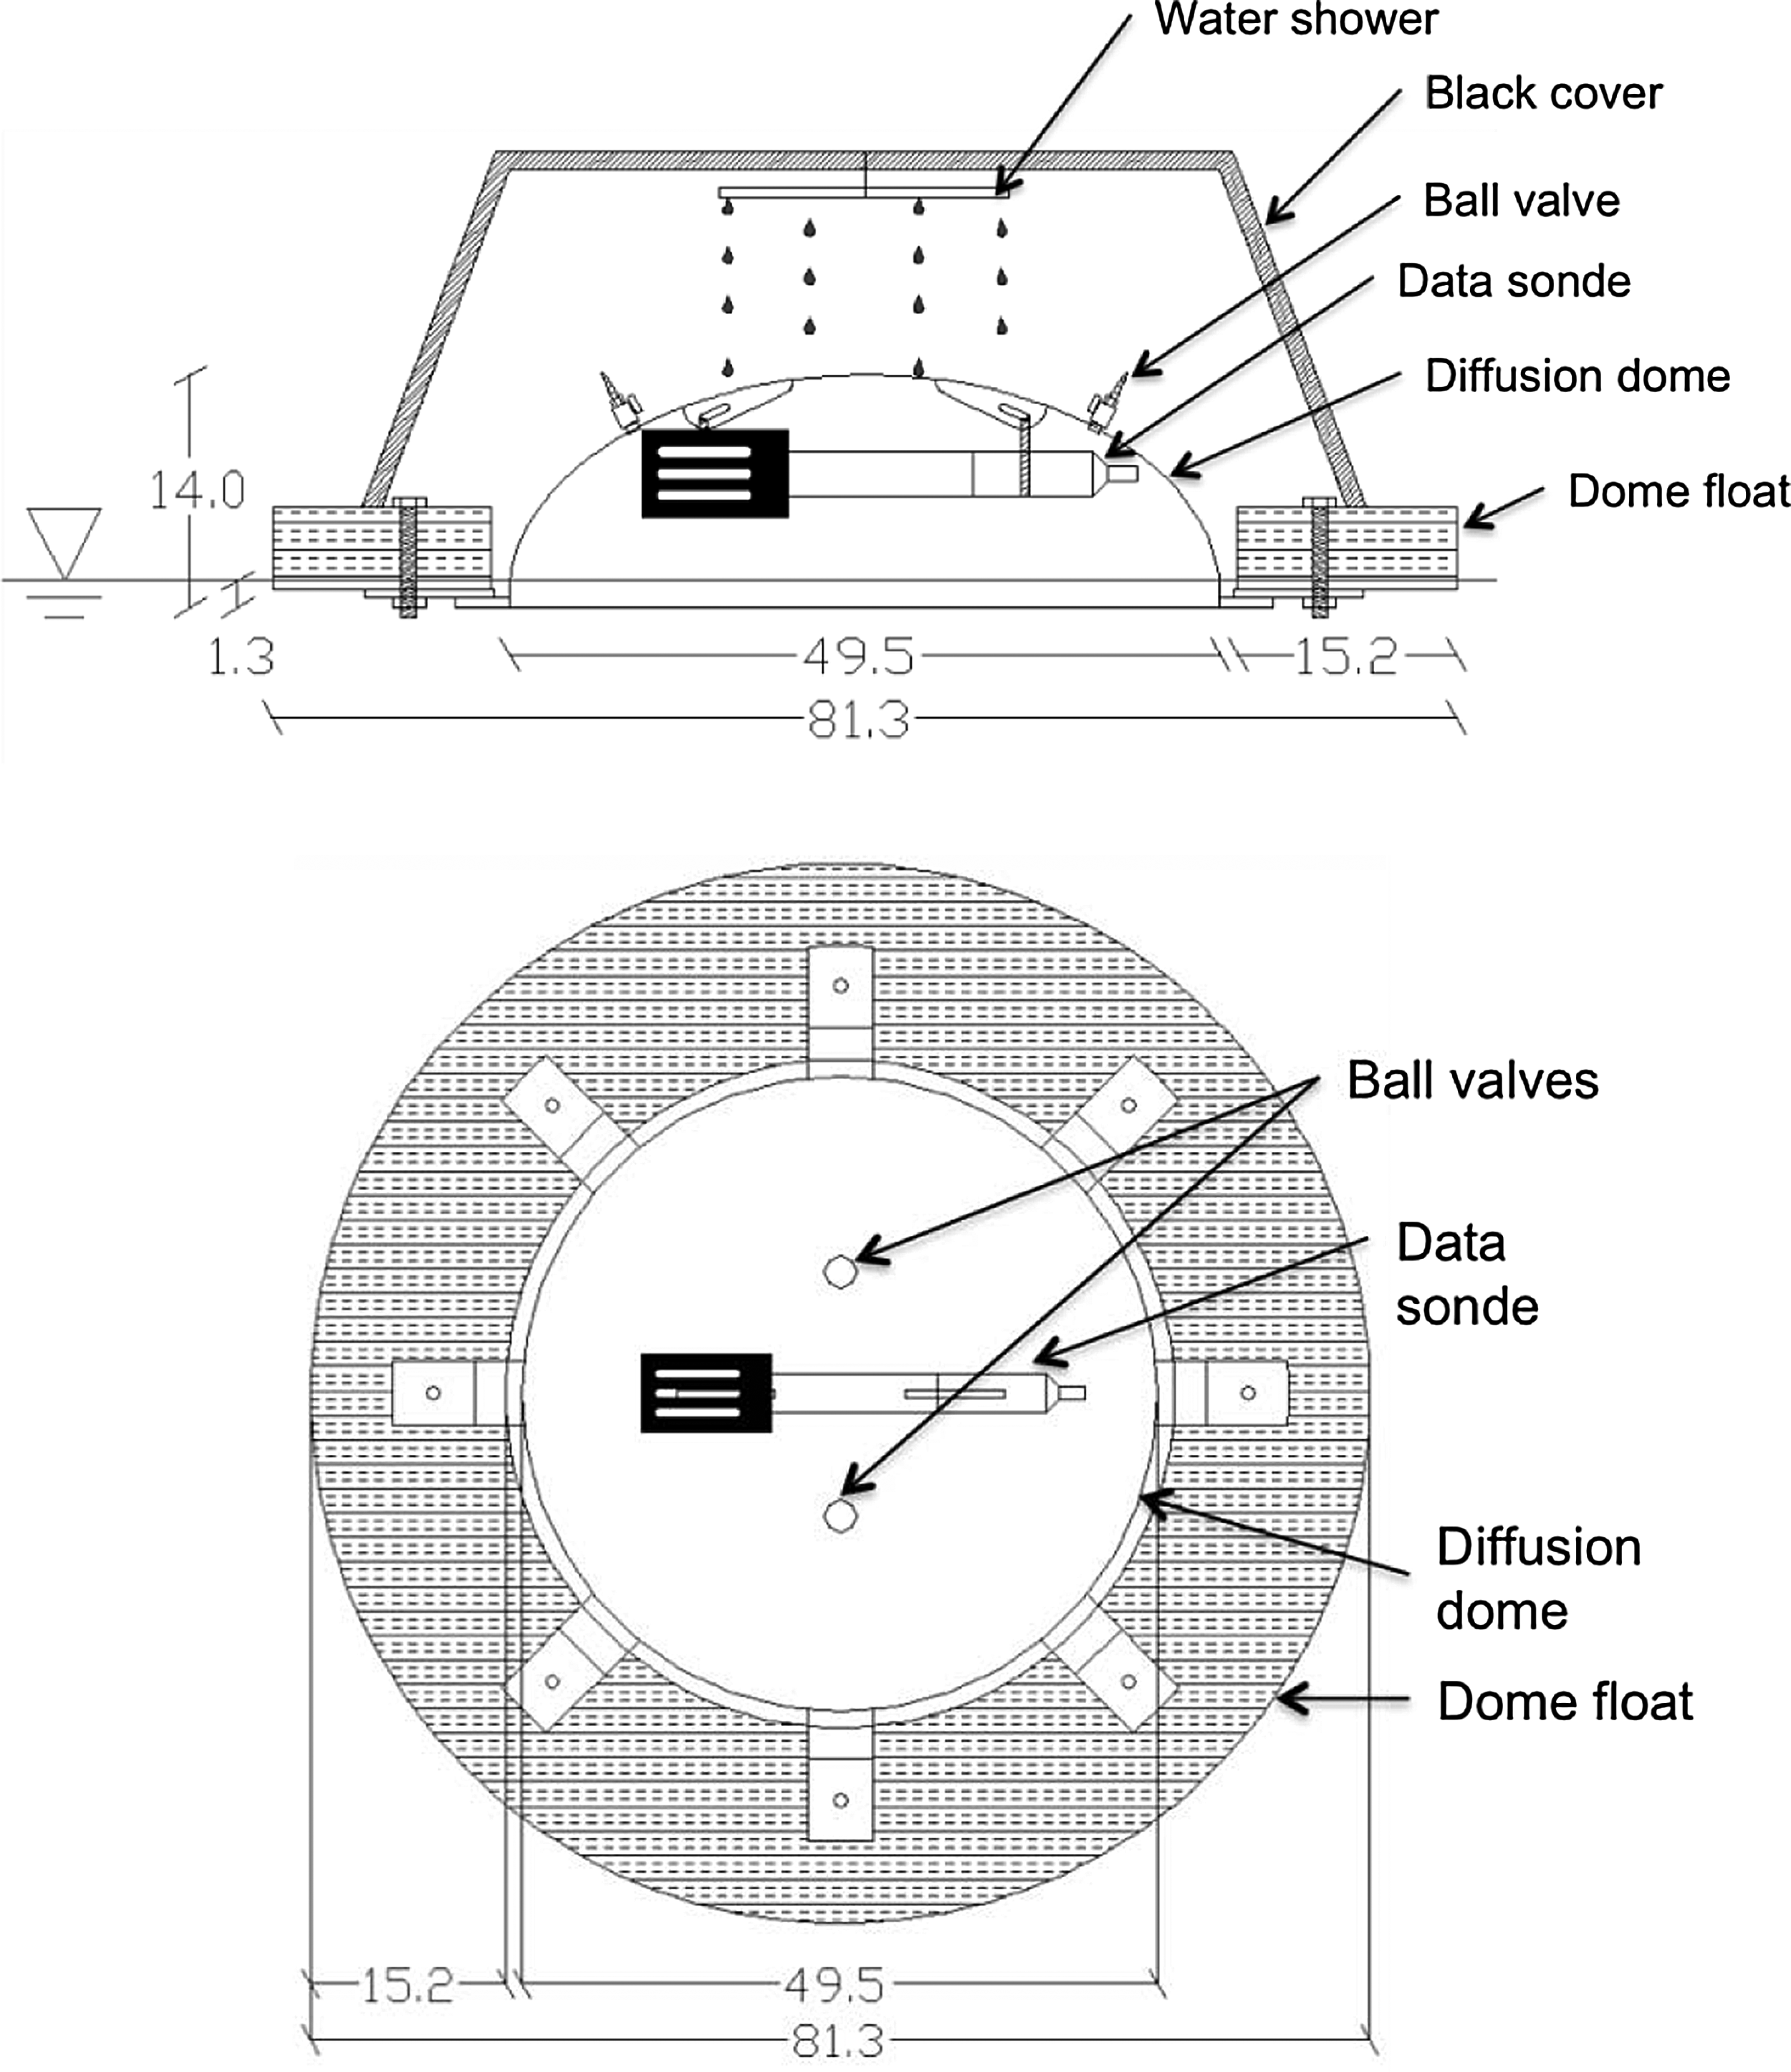
Schematic of diffusion dome used in the study. Top: elevation; bottom: plan view.
Two ball valves were attached and sealed to the roof of the diffusion dome. The dome headspace was initially purged with nitrogen gas to obtain an oxygen concentration of approximately 4 parts per million (ppm). The ball valves were then closed after nitrogen purging to ensure no atmospheric oxygen was able to enter the headspace of the diffusion dome. Troll 9500 water quality probes were utilized to measure oxygen dynamics in the dome and ambient river water. One DO probe was suspended from the boat to measure ambient river conditions and the other DO probe was attached to the inside of the diffusion dome to measure oxygen diffusion across the air–water interface into the head space. Temperatures in the dome head space, ambient river water, and ambient atmospheric conditions were recorded during each measurement. All field data obtained using the floating dome were analyzed according to the protocol developed previously (Cavinder, 2002; Deatrick et al., 2007).
Results and Discussion
Sediment oxygen demand
SOD accounts for all the oxygen consumed in sediments due to various biogeochemical activities. SOD measurements using in-situ techniques require careful site selection to get representative values for a given stream length due to streambed heterogeneity and varying hydraulic characteristics. In the current research, seasonal SOD measurements were done at 13 locations in the summer and winter of 2009. Seven of the locations were revisited in the summer and winter of 2010 to evaluate annual variations in SOD.
Figure 4 shows typical DO depletion profiles measured in the SOD and WCdark chambers. In this winter sampling event, the DO profile for the WCdark chamber is represented as the solid black line and shows almost no DO consumption in the WC. The dashed lines show DO profiles for the two SOD chambers. The DO profiles in both SOD chambers show decreasing trends with time, which means that the DO was consumed in these chambers due to various biogeochemical activities. The slope of each line was used to calculate oxygen consumption rates (ODbulk and WCdark).

Typical plot showing DO profiles for two testing chambers and control chamber.
Table 1 summarizes seasonal results for all SOD measurements performed in 2009. The table also provides surface sediment %VS (0–2 cm) at each site and qualitatively describes the type of sediments based on visual observations. As evident in Table 1, sediment %VS was higher at sites located in the Lower Jordan River downstream of the Surplus Canal diversion. With the exception of the US-73 site, surface sediments at most of the sites located in the Upper Jordan River have a low sediment %VS composed of sand and gravel substrates. The sediments at the US-73 site, although located in the Upper Jordan River, are characterized by clay and silt deposits due to the naturally flat topography within the Utah Lake Basin and a backwater effect from the downstream Turner Dam diversion. River water originating from the turbid Utah Lake slows down and suspended solids are deposited upstream of the Turner Dam. As a result, sediments at the US-73 site have a high %VS content although this site is located in the Upper Jordan River.
Except for the 1700 S site, SOD values greater than 1 g/m2 per day were measured in the Lower Jordan River. Sediments having a SOD greater than 1 g/m2 per day are considered organically enriched (Chapra, 2008). SOD values between 2–5 g/m2 per day are considered polluted and values greater than 5 g/m2 per day are considered very polluted (Butts and Evans, 1978). Slow flow velocities and depositional zones characterize the Lower Jordan River, hence, SOD values greater than 1 g/m2 per day are not surprising (Ziadat and Berdanier, 2004). Although we did not quantify, swamp gas was released from disturbed sediments in the Lower Jordan River and ebullition was observed near tributaries and backwaters, indicating a reservoir of sediment organic material undergoing anaerobic decomposition. Anaerobic decomposition in the benthos will eventually diffuse oxygen-consuming chemical species such as ammonia, methane, and hydrogen sulfide into the WC (Di Toro et al., 1990).
High SOD values (as high as 3.0 g/m2 per day at the 2780 S-west site) were observed at several locations in the Upper Jordan River as well, even though the sediments were not organically enriched. The Upper Jordan River is characterized by a steeper topographic relief, faster flow velocities, and no DO impairment. In addition, CPOM and FPOM do not settle in the Upper Jordan River and travel downstream as bed load. Exceptions are pools and backwaters created by diversion dams and flow control structures. Although the exact reason for these high SOD values in the Upper Jordan River could not be ascertained, we hypothesize that these high values could be due to the upwelling of anoxic hyporheic/groundwater. Hyporheic exchanges define surface water–groundwater interactions, especially in rivers having steep topographic gradients and high sediment porosity. Hyporheic exchanges occur when surface water enters the void spaces of sediments, moves downstream, and re-enters the river again (Uzarski et al., 2001). Within the hyporheic zone, microbe-mediated processes can contribute to DO loss in the pore water making it anoxic (Grimm and Fisher, 1984). Although hyporheic zone exchanges were not the focus of this research, we find it a very interesting possibility, which should be evaluated in the future.
Direct correlations between land use and SOD were not observed in the Jordan River, which has been noted in other SOD studies (Utley et al., 2008). SOD rates steadily increased in the Lower Jordan River downstream of the Surplus Canal diversion. The exception was the 1700 S site, which had the lowest measured SOD during the summer of 2009. This is most likely a result of the 1700 S sampling site being located in a run with sandy substrates following a wide shallow area, where the majority of localized sedimentation had already taken place (Parr and Mason, 2004). No direct correlations between point discharges and measured summer SOD were noted in this study. Elevated summer SOD fluxes were recorded at sites located downstream of stormwater and WWTP discharges, but these increased SOD values cannot be directly tied to these discharges. Variations in substrates created by depositional zones associated with the Surplus Canal diversion and natural topography are attributed to the elevated SOD measured downstream of point sources discharging into the Lower Jordan River. Organic matter is most likely entering the river via urban stormwater and additional biomass is undoubtedly being produced as a result of upstream publically owned treatment works (POTW) nutrient loads, but these interactions were not directly correlated with SOD due to the transient nature of organic matter being swept downstream and settling within depositional zones.
SOD measurements were repeated in the winter of 2009 to observe temperature effects on SOD (Table 1). To summarize, all sampled sites exhibited elevated SOD values in winter, as high as 3.0 g/m2 per day (LNP NE) and 3.6 g/m2 per day (2780 S-East and 2100 S site). The second column in Table 1 provides measured SOD values in the summer of 2009 and the last column shows measured winter SOD values. Table 1 also provides the ambient WC temperatures recorded during summer and winter SOD measurements.
SOD is assumed to decrease with ambient water temperature due to a reduction in the microbial activity, and is typically reported as a flux normalized to 20°C (Berthelson et al., 1996). Using the measured winter temperature provided in Table 1, expected winter SOD rates were calculated using a modified Arrhenius equation (Berthelson et al., 1996). Predicted winter SOD values are provided in Table 1 as “expected winter SOD.” For example, the measured summer SOD value for the LNP NE site should decrease from 2.6 to 1.1 g/m2 per day in the winter months if temperature is the limiting parameter for sediment metabolism. To our surprise, the measured winter SOD value for the same site was 3.0 g/m2 per day, higher than the measured summer SOD value of 2.6 g/m2 per day. A similar trend was observed for 8 other sites coded with gray color in Table 1.
The percentage of the ambient DO deficit associated with SOD can be estimated using the following equation.
%DO deficit due to SOD=SOD/(SOD+(WCdark×d)) (6)
Figure 5 shows these results for summer and winter SOD measurements. In this figure, open white circles represent summer SOD data and the closed black circles represent winter data measured in 2009 and 2010. Three important observations can be concluded from Fig. 5: (1) the sediments contributed to 75% of the ambient DO deficit for 5 sites during the summer season; (2) except for three sites, the majority of the ambient winter DO deficit was associated with SOD with more than 95% of ambient DO demand partitioned into sediments; and (3) the WC oxygen demand (WCdark) decreased with temperature during the winter months. The three sites having WCdark oxygen demands greater than 25% during the winter months were located directly downstream of WWTP discharges and the treated wastewater may have supported this increased wintertime WC metabolism.

Percentage of ambient DO deficit associated with SOD.
It was surprising to record elevated wintertime SOD values and it is hypothesized that these elevated rates could be because of (1) the autumn leave shedding (deciduous trees) in urban areas results in additional organic matter loads to the river through stormwater, (2) the organically enriched sediments provide substrate to bacteria evolutionary capable of maintaining a functioning metabolism at lower temperatures (methanogens and methanotrophs) and, (3) the deep sediments are more stable in terms of daily and seasonal temperature fluctuations. In summary, the winter SOD data emphasize that predicted SOD values using temperature correction equations may not reflect actual winter SOD values and stream metabolism, which in turn can affect stream management decisions.
Estimate of NDM, GPP, and CR24
Figure 6 shows a typical plot of DO profiles in different chambers used during NDM experiments. There was minimal DO consumption in the WC chamber, while measuring dark respiration (Fig. 6, WCdark shown by solid black line before removing black bags). The SOD chamber and two NDM chambers containing sediment trays measuring dark respiration, while covered with black bags (TOD) showed similar DO profiles from the time of installation until the black bags were removed to measure primary production (Fig. 6). The SOD chamber always measures dark respiration since it was constructed from aluminum and blocks the solar flux. As soon as the black bags were removed from the transparent NDM chambers (now measuring TPP and WClight), the DO profiles in these three chambers were reversed due to primary production. Primary production associated with phytoplankton (WClight) was minimal (shown by solid black line when exposed to sunlight), while the benthos were productive in this example.

Typical dissolved oxygen profiles obtained by plotting DO from in-situ primary production field test. This graph shows data for LNP-NE site.
Figure 7 provides average SOD, TOD, and TPP rates for summer 2010 and winter 2011. A close examination of Fig. 7 reveals that all sites were seasonally active in terms of benthic primary production. In the summer of 2010, the TPP ranged from 1.0 g DO/m2 per day at 1700 S to a high value of 7.4 g DO/m2 per day at the 7600 S site. Likewise, in winter 2011, the TPP ranged from 0.7 g DO/m2 per day at 300 N to a high value of 5.6 g DO/m2 per day at the 7600 S site.

Bar charts showing tray oxygen demand (TOD), SOD, and tray primary production (TPP) in
Elevated TPP rates in the Upper Jordan River (5400 S, 7600 S, and 9000 S sites) are a result of the relatively swift and shallow hydraulics and stable sediment substrate capable of providing an anchor point for benthic organisms. Both the 7600 S and 9000 S sites are located upstream of POTW discharges and sediment productivity cannot be directly linked to nutrient-induced eutrophication.
Both SOD and TOD represent SODs with SOD directly measured in undisturbed sediments and TOD measured using sediments collected in trays. For all practical purposes, both SOD and TOD should provide similar oxygen demands because both these rates represent DO consumed in the top 5 cm of the sediment column due to various biogeochemical activities. The observed TOD and SOD for all sites are plotted in Fig. 8. In general, SOD and TOD rates showed a high correlation with the exception of the 7600 S and 5400 S sites. The poor correlation between TOD and elevated SOD rates for 7600 S and 5400 S sites may be due to (1) a result of heterogeneities in the benthic community and sediment substrate, (2) methane or other reduced chemicals originating from sediments in the case of SOD values and, (3) hyporheic/groundwater upwelling occurring in the gravel sediments at 7600 S and 5400 S sites. The closed bottom TOD chambers were designed specifically to isolate the top sediments and to exclude hyporheic/groundwater exchanges and to allow NDM studies in the swift moving waters characteristic of the Upper Jordan River.

TOD and SOD chamber comparison.
Turbidity in the Jordan River water decreased dramatically during the winter low flows. Low turbidity coupled with less bed load migrating downstream during the winter months most likely resulted in less scouring, creating an environment conducive to the elevated winter TPP rates observed in the Upper Jordan River. It should be noted that even though the TPP measured during winter conditions were similar to the summer values, the maximum rate of photosynthesis (TPPm) was higher in the winter months, but was normalized to a daily value using the photoperiod, which was 5 h shorter in the winter compared to the summer months.
Results for the NDM chambers partitioned into sediment and WC dark and light respiration for summer 2010 and winter 2011 are shown in Fig. 9. The WC showed a decrease in both dark and light respiration during the winter months compared to the summer. Increased winter WCdark rates (dark gray inverted bars in Fig. 9b) were observed downstream of WWTP discharges at the LNP NE, 2100 S, and 5400 S sites, but was also observed upstream of all WWTP discharges (7600 S). Wintertime WClight was higher in the Upper Jordan River compared to the Lower Jordan River. Phytoplankton may be directly entering the Jordan River from the eutrophic Utah Lake and/or may be a result of instream productivity. Summertime WCdark (dark gray inverted bars in Fig. 9a) was very consistent throughout the length of the Jordan River with an average value of roughly 1 g DO/m2 per day after normalizing to mean river depth. TPP was the highest in the Upper Jordan River and decreased in the Lower Jordan River during both summer and winter. The exception was the LNP NE site in summer. Although the Lower Jordan River is characterized by a diurnal ambient DO deficit, green periphyton were visually observed covering the mud filled sediment trays during the summer sampling event.

Gross primary production (GPP) and community respiration (CR24) during summer
Figure 10 provides the NDM measurements based on oxygen dynamics in this chamber study. The significance of a positive NDM is that autotrophic conditions prevail and organic carbon is being produced faster than it can be decomposed, resulting in a constant flux of organic material being added to local and downstream sediments. The Upper Jordan River is a year round source of instream produced organic matter to the downstream Lower Jordan River. Estimations of organic carbon loading to the DO impaired Lower Jordan River are complicated by the productive Upper Jordan River, river diversions, and organic matter associated with urban stormwater. In summary, the Upper Jordan River was dominated by autotrophic conditions throughout the year, whereas the Lower Jordan River was heterotrophic.

Net daily metabolism during summer
Reaeration coefficients
The diffusion dome method was used to estimate reaeration coefficients in the Jordan River because the dome was less labor intensive and less expensive than gas/dye injection and could be easily conducted by one person. When floating the dome by boat, the mean depth and flow velocity were recorded for diffusion dome calculations and predictive equation comparison. Furthermore, the dome was protected from sunlight with a cover and river water was constantly sprinkled over the top of the dome to nullify temperature gradients and the associated greenhouse effect. The reaeration coefficients measured using the diffusion dome method and normalized to 20°C (K2,20) provide hydraulic reach-specific reaeration coefficients. In addition, the measured reaeration coefficients provide a double check for reaeration coefficients generated through modeling practices that incorporate a variety of predictive equations and information such as the stream gradient, velocity, depth, and ambient temperature. The amount of oxygen entering or exiting the WC is dependent on the actual DO deficit and the calculated reaeration coefficients for each section of the river under consideration (Deatrick et al., 2007).
Table 2 presents the diffusion dome measured reaeration coefficients for the Jordan River arranged from north to south (downstream to upstream). Figure 11 provides reaeration coefficients in terms of location on the Jordan River and stream gradient. The first observation from Table 2 and Fig. 11 is that the Upper Jordan River segments have higher reaeration coefficients. The potential for reaeration is much larger in the midsections of the Jordan River (Float # 3–6), where the river has increased flow velocities due to topography, decreased depths, and a less uniform bottom increasing the amount of turbulence and mixing. The potential for surface reaeration is significantly lower in Reaches 1 and 2 (Float # 1–2) compared to the Upper Jordan River. This can be attributed to increased depths, slower flows, and the uniform bottom present in hydraulic Reaches 1 and 2 (Bicudo and Giorgetti, 1991). The relatively low reaeration coefficient associated with Hydraulic Reach 8 (Float #7) is due to the flat topography of the Utah Lake basin and slow moving backwaters upstream of the Turner Dam diversion at the Salt Lake County line.
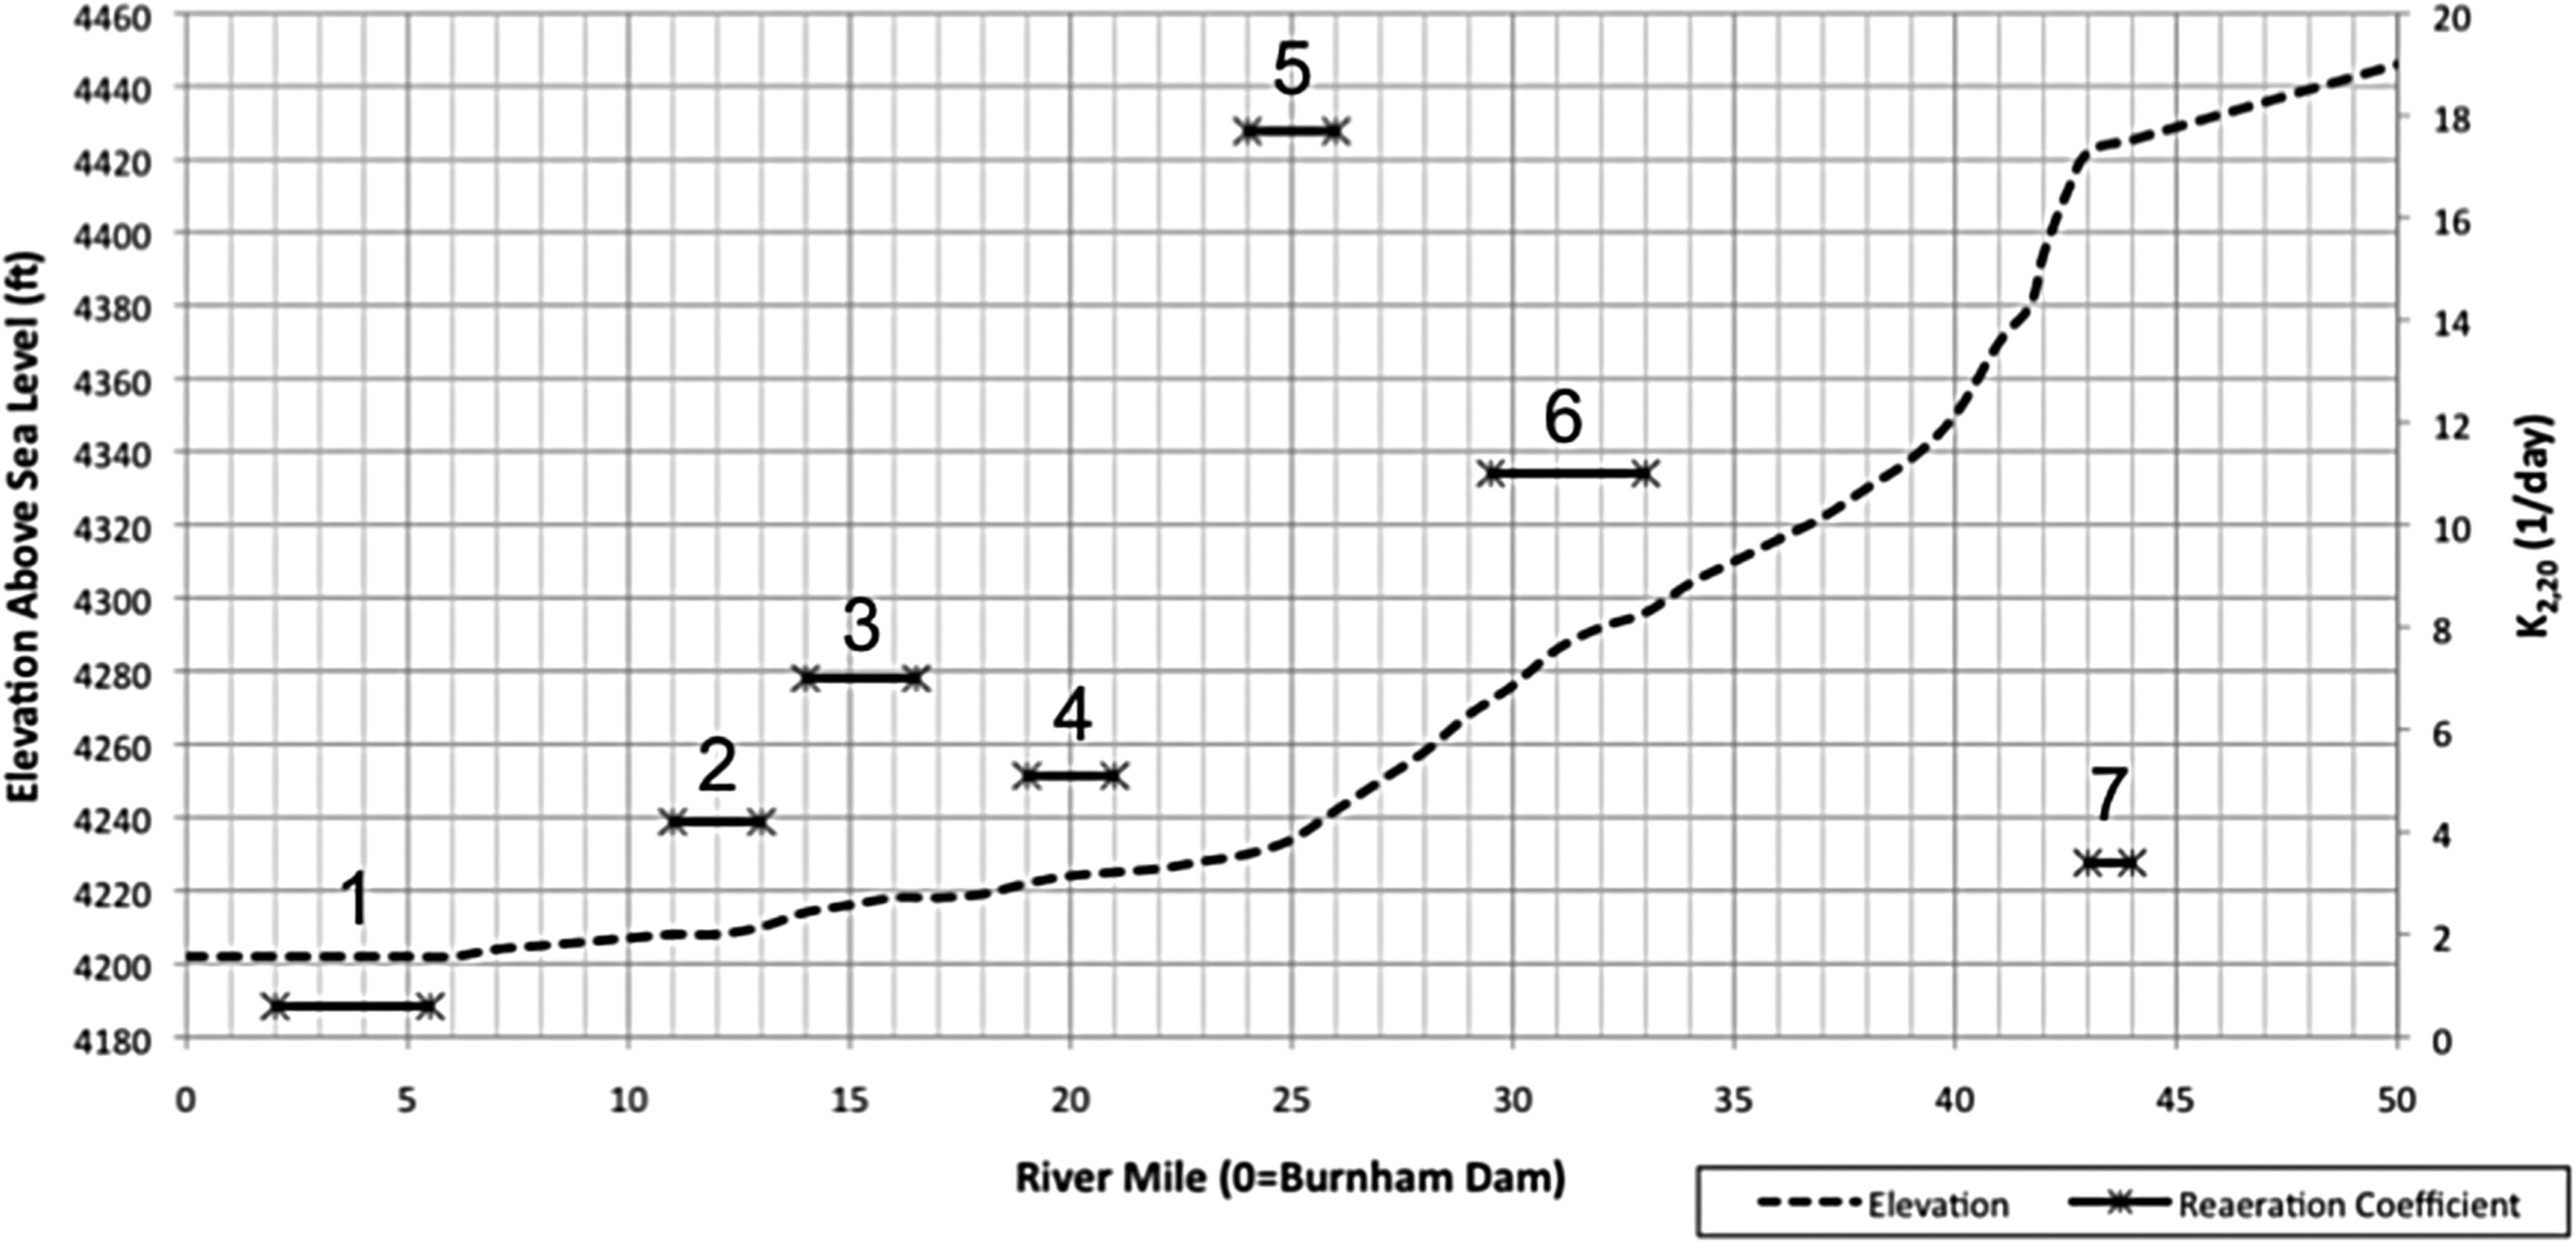
Measured dome reaeration coefficients in relation to the river mile and stream gradient. Numbers on plot correspond to Float # (Table 2).
Table 3 provides a comparison of commonly used predictive equations and measured diffusion dome reaeration coefficients. The O'Connor and Dobbins formula has been used to predict reaeration coefficients in rivers that are relatively deep and slow moving (O'Connor and Dobbins, 1958). Other studies have shown that this equation overestimates reaeration in very slow moving river sections, which may be the reason for the low dome measured K observed during Float #1 compared to the use of O'Connor and Dobbins equation (Bowie et al., 1985). Wind-induced reaeration is probably important in Reach 1 and is not measured using the diffusion dome method. Reach 1 is located in the flood plain of the Great Salt Lake and has very little riparian vegetation to absorb wind energy. As listed in Table 3, our dome method estimated a reaeration constant of 0.6/day, which was 50% less than estimated by predictive equations. Reaeration due to wind can be estimated using methodology suggested for lakes. Using the equation discussed in Ro and Hunt, 2006, the reaeration coefficient associated with the average wind speed for the Salt Lake City was calculated to be 0.5/day. Hence, reaeration due to wind could be significant in Reach 1. The Churchill equation (Churchill et al., 1962) applies best to relatively deep rivers characterized by elevated stream velocities. The Owens and Gibbs equation is best suited for fast flowing shallow streams (Owens et al., 1964).
Bold means best agreement.
Best equation based on river characteristics.
Conclusions
Overall, this study demonstrates the following.
1. SOD is a significant sink of ambient WC DO in the Jordan River.
2. SOD did not decrease with temperature in the winter months. Standard temperature normalization equations used to predict winter SOD can underestimate winter SOD and in-situ methods should be used for winter SOD measurements if required.
3. Hyporheic exchanges and groundwater upwelling influence ambient DO concentrations in the Upper Jordan River leading to higher SOD values. However, a more detailed study would be needed to confirm this.
4. Primary productivity contributes to DO dynamics and organic matter inputs in streams and should be evaluated using in-situ techniques.
5. The floating dome method represented an easy to employ method to measure reaeration coefficients and was comparable with estimates obtained using predictive equations. However, this method may underestimate the reaeration potential in rivers exposed to wind.
Footnotes
Disclosure Statement
No competing financial interests exist.