
Abstract
Abstract
Photocatalytic degradation of volatile organic compounds under visible light is an important issue for use of solar energy. Perovskite-type oxide, KLaTi2O6, was prepared by the sol-gel method. Photocatalytic activities of catalysts for chlorobenzene decomposition were investigated. Four types of transition metal (Co, Ni, Zn, Mn) were doped into KLaTi2O6 to improve photocatalytic activity for gas-phase chlorobenzene degradation. Photocatalysts were characterized by X-ray diffraction, energy-dispersive X-ray spectroscopy, ultraviolet–visible spectroscopy, and nitrogen adsorption analysis. Results showed that under visible light irradiation, the photocatalytic activity of metal-doped KLaTi2O6 was higher than undoped KLaTi2O6. We found that the predominant species accumulating on the catalyst surface is benzaldehyde. This report proposes the pathway of benzaldehyde formation during photocatalytic degradation of chlorobenzene under visible light irradiation.
Introduction
V
Recently, perovskite-type oxides for photocatalytic performance have been studied intensively (Wu et al., 2007; Osterloh, 2008). However, most reports focused on splitting water to produce hydrogen; there are a few reports on photocatalytic degradation of halogenated VOCs, especially under visible light irradiation.
In this study, we synthesized solid solution KLaTi2O6 and metal-doped KLaTi2O6. Photocatalytic performance for degradation of chlorobenzene was investigated under visible light irradiation. We also discuss the intermediates generated on the catalyst surface and analyze the mechanism of chlorobenzene photodegradation by gas chromatography/mass spectroscopy (GC-MS) and in situ Fourier-transform infrared (FTIR) spectroscopy.
Experimental Details
Preparation of photocatalysts
KLaTi2O6 powders were prepared by the sol-gel process. Tetrabutyl titanate (0.2 mol) and citric acid (0.3 mol) were thoroughly mixed with severe agitation. KNO3 (0.3 mol) and La(NO3)3 (0.1 mol) were dissolved in the above solution. The solution pH 1 was adjusted by nitric acid. The homogeneous and transparent sol obtained after reaction for 2 h was dried at 80°C. After grinding, the resultant gel was calcined at 300°C for 2 h and recalcined at 800°C for 5 h. The powders gained were KLaTi2O6.
Four types of aqueous solution containing 0.2 M metal ions [Zn(CH3COO)2·2H2O, Co(CH3COO)2·4H2O, NiSO4·7H2O, and MnSO4·H2O] were prepared for the doping. The parent KLaTi2O6 powders (1 g) were added into each of the above aqueous solutions (100 mL) and the white color of the powder changed instantaneously to other colors (Fig. 1). The solutions were maintained at 60°C for 3 days. The samples after washing with distilled water to remove

Characterization
X-ray diffraction (XRD) patterns of the powders were obtained on a Rigaku D/max 2500 X-ray diffraction analyzer. The crystallite size can be calculated by the following equation (Gu et al., 2004):
Photocatalytic experiments
The photocatalytic reaction was carried out in a cylindroid glass reactor using a 350 W xenon lamp (ShenZhen AnHongDa Opto Technology Co., Ltd.) along with a filter to cut down infrared (IR) and UV radiation to permit only visible light (400 nm≤λ≤700 nm) radiation transmission (Fig. 2). A large cuboid box was used to avoid interference from other light sources. A constant temperature was maintained with a cooled water system outside the reactor (not shown). A typical experiment was carried out as follows: A suspension containing 50 g/L of catalyst in distilled water was prepared. The surface of a frosted glass plate (13.5 cm2) was cleaned with acetone. The suspension was poured on the glass plate and was then dried at 50°C. The deposition process was performed four times to obtain a catalyst loading density of 1.4×10⁻² g/cm2, as estimated by weighting the plate before and after the deposition process. The plate was placed at the center of the 250 mL reactor. Next, 0.5 μL of chlorobenzene liquid was injected into the sealed reactor filled with air and allowed to evaporate with a small magnetic stirring fan. Illumination was initialized after adsorption equilibrium was reached. The small fan guaranteed the gas circulation inside the reactor. A small amount of gas (500 μL) was withdrawn from the reactor periodically and analyzed by gas chromatography. The photocatalytic activity of samples was evaluated by measuring the degradation ratio of chlorobenzene.

Device for photocatalytic reaction.
Analytical methods
Identification of products was verified using GC-MS and in situ FTIR spectroscopy.
For GC-MS analysis, 18.4 μL of chlorobenzene liquid was injected into the reactor and the other experiment conditions were the same as those in photocatalytic experiments. After irradiation, the intermediates adsorbed on the photocatalyst were extracted with methanol. The extract was filtered through a 0.45-μm filter and stored at 4°C until instrumental analysis was conducted. The GC-MS (Agilent 7890A-5975C) was equipped with a DB-5 ms capillary column (30 m, 0.25 mm inner diameter, 0.25 μm film thickness) and electron ionization (EI) detector. Mass spectra were compared with the NIST database for compound identification.
For the in situ FTIR analysis, the quartz IR cell with IR-transparent CaF2 windows was used as the reaction cell. The catalyst was pressed into a pellet and placed at the center of the cell. Then, it was pretreated in N2+10% O2 stream at 400°C. After the catalyst sample was cooled to 25°C, chlorobenzene gas was introduced to the cell for chlorobenzene adsorption. Subsequently, a photoreaction was performed under visible light irradiation in a closed system. All infrared spectra were collected using Nicolet 380 with a resolution of 4 cm−1 and 32 scans in the region of 4000–1000 cm−1.
Results and Discussion
Characterization
Figure 3 and Table 1 show the XRD patterns and lattice parameters of the powders. It was found that the powder XRD pattern of the undoped sample as shown in Fig. 3 agrees well with the KLaTi2O6 crystal phase (JCPDS No. 01-089-4930). According to the X-ray diffraction data, the lattice parameters of KLaTi2O6 were found to be a=b=c=0.3897 nm and the crystallite size was 9.7 nm.
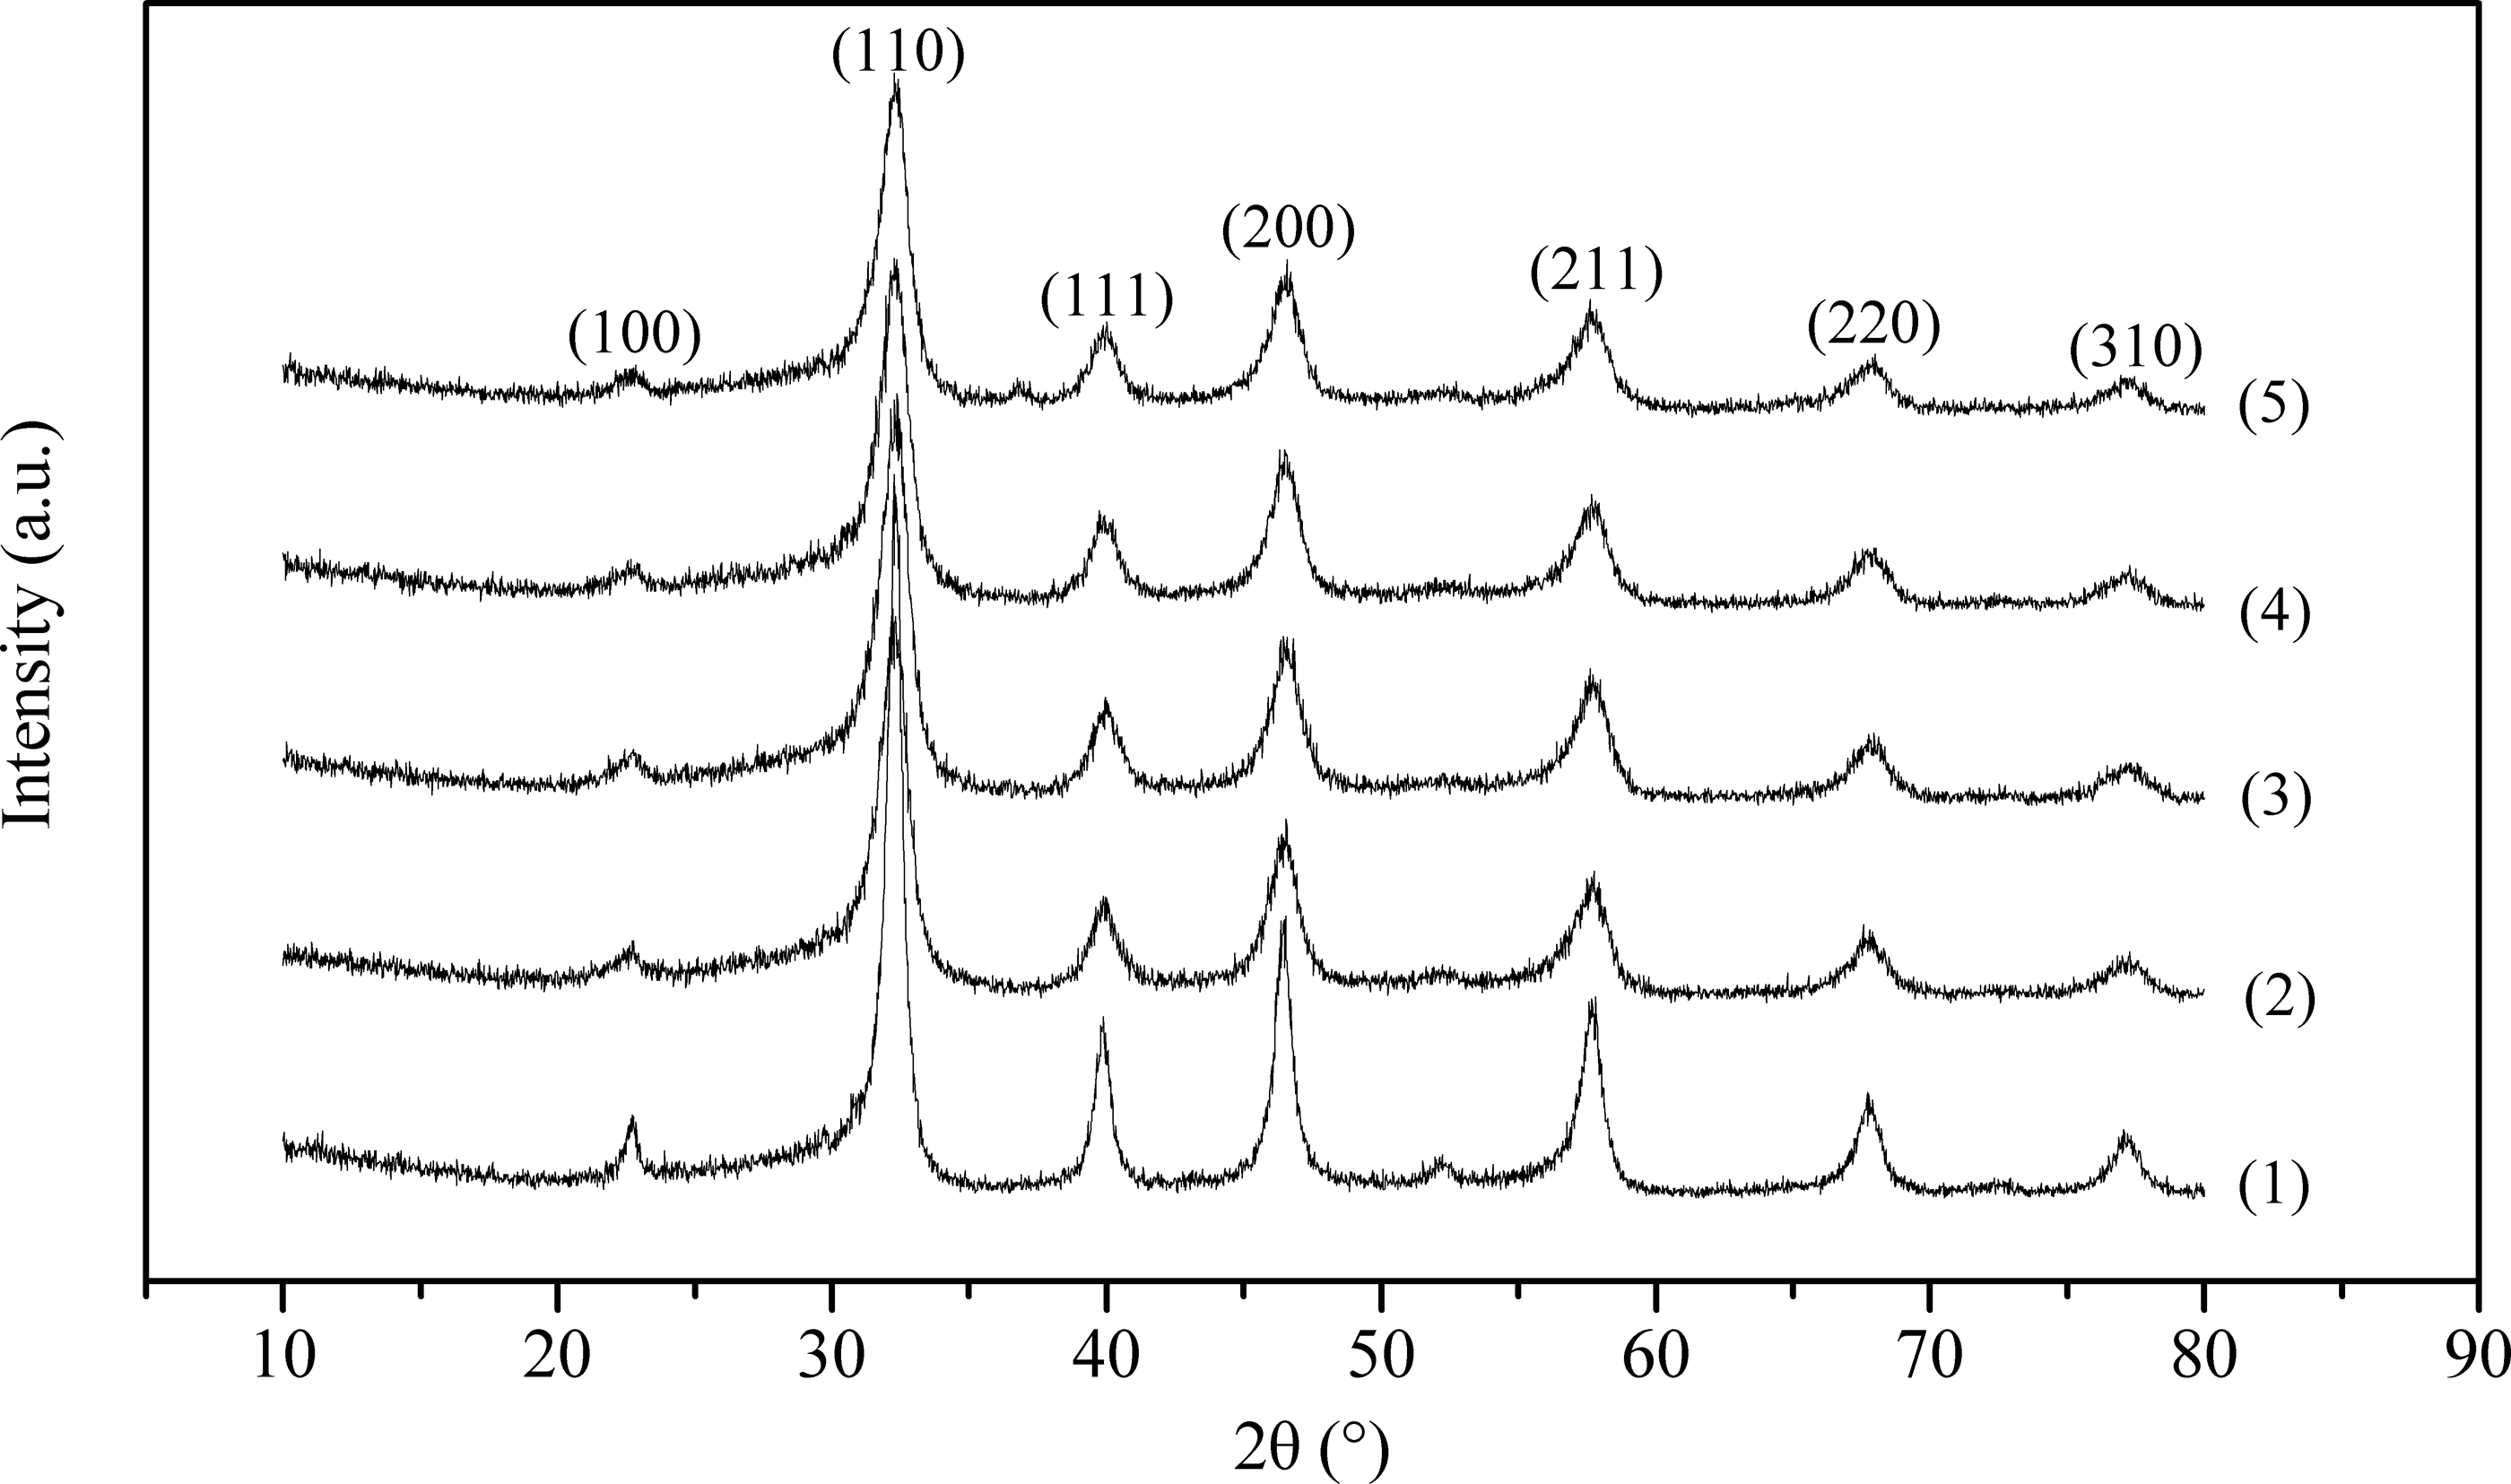
X-ray diffraction patterns of (1) undoped KLaTi2O6, (2) Ni-doped KLaTi2O6, (3) Zn-doped KLaTi2O6, (4) Mn-doped KLaTi2O6, and (5) Co-doped KLaTi2O6.
Figure 3 and Table 1 also show that metal doping does not change the crystal structure and all the samples consist of single phase KLaTi2O6. However, metal doping changes the lattice parameters of KLaTi2O6, indicating that metal ions are inserted into the crystal of KLaTi2O6, which is consistent with the published literature (Yang et al., 2009a, 2009b). The metal-doped samples exhibit broadening peaks and the peak intensity decreases, which indicate a decrease in the crystallinity due to metal doping (Kumar et al., 2011).
From the quantitative analysis of EDX, the metal contents were obtained by averaging the contents of five random points on the sample. The metal contents for metal-doped samples are estimated at ∼2–3 at% (Table 2). Pore size distribution determined by the BJH model shows that it is broader in metal-doped samples than undoped KLaTi2O6 (Fig. 4). The average pore size for all samples is ∼5 nm. However, the specific surface area of metal-doped samples increases by ∼20 m2/g over undoped KLaTi2O6, ranging from 96 to 102 m2/g (Table 2).
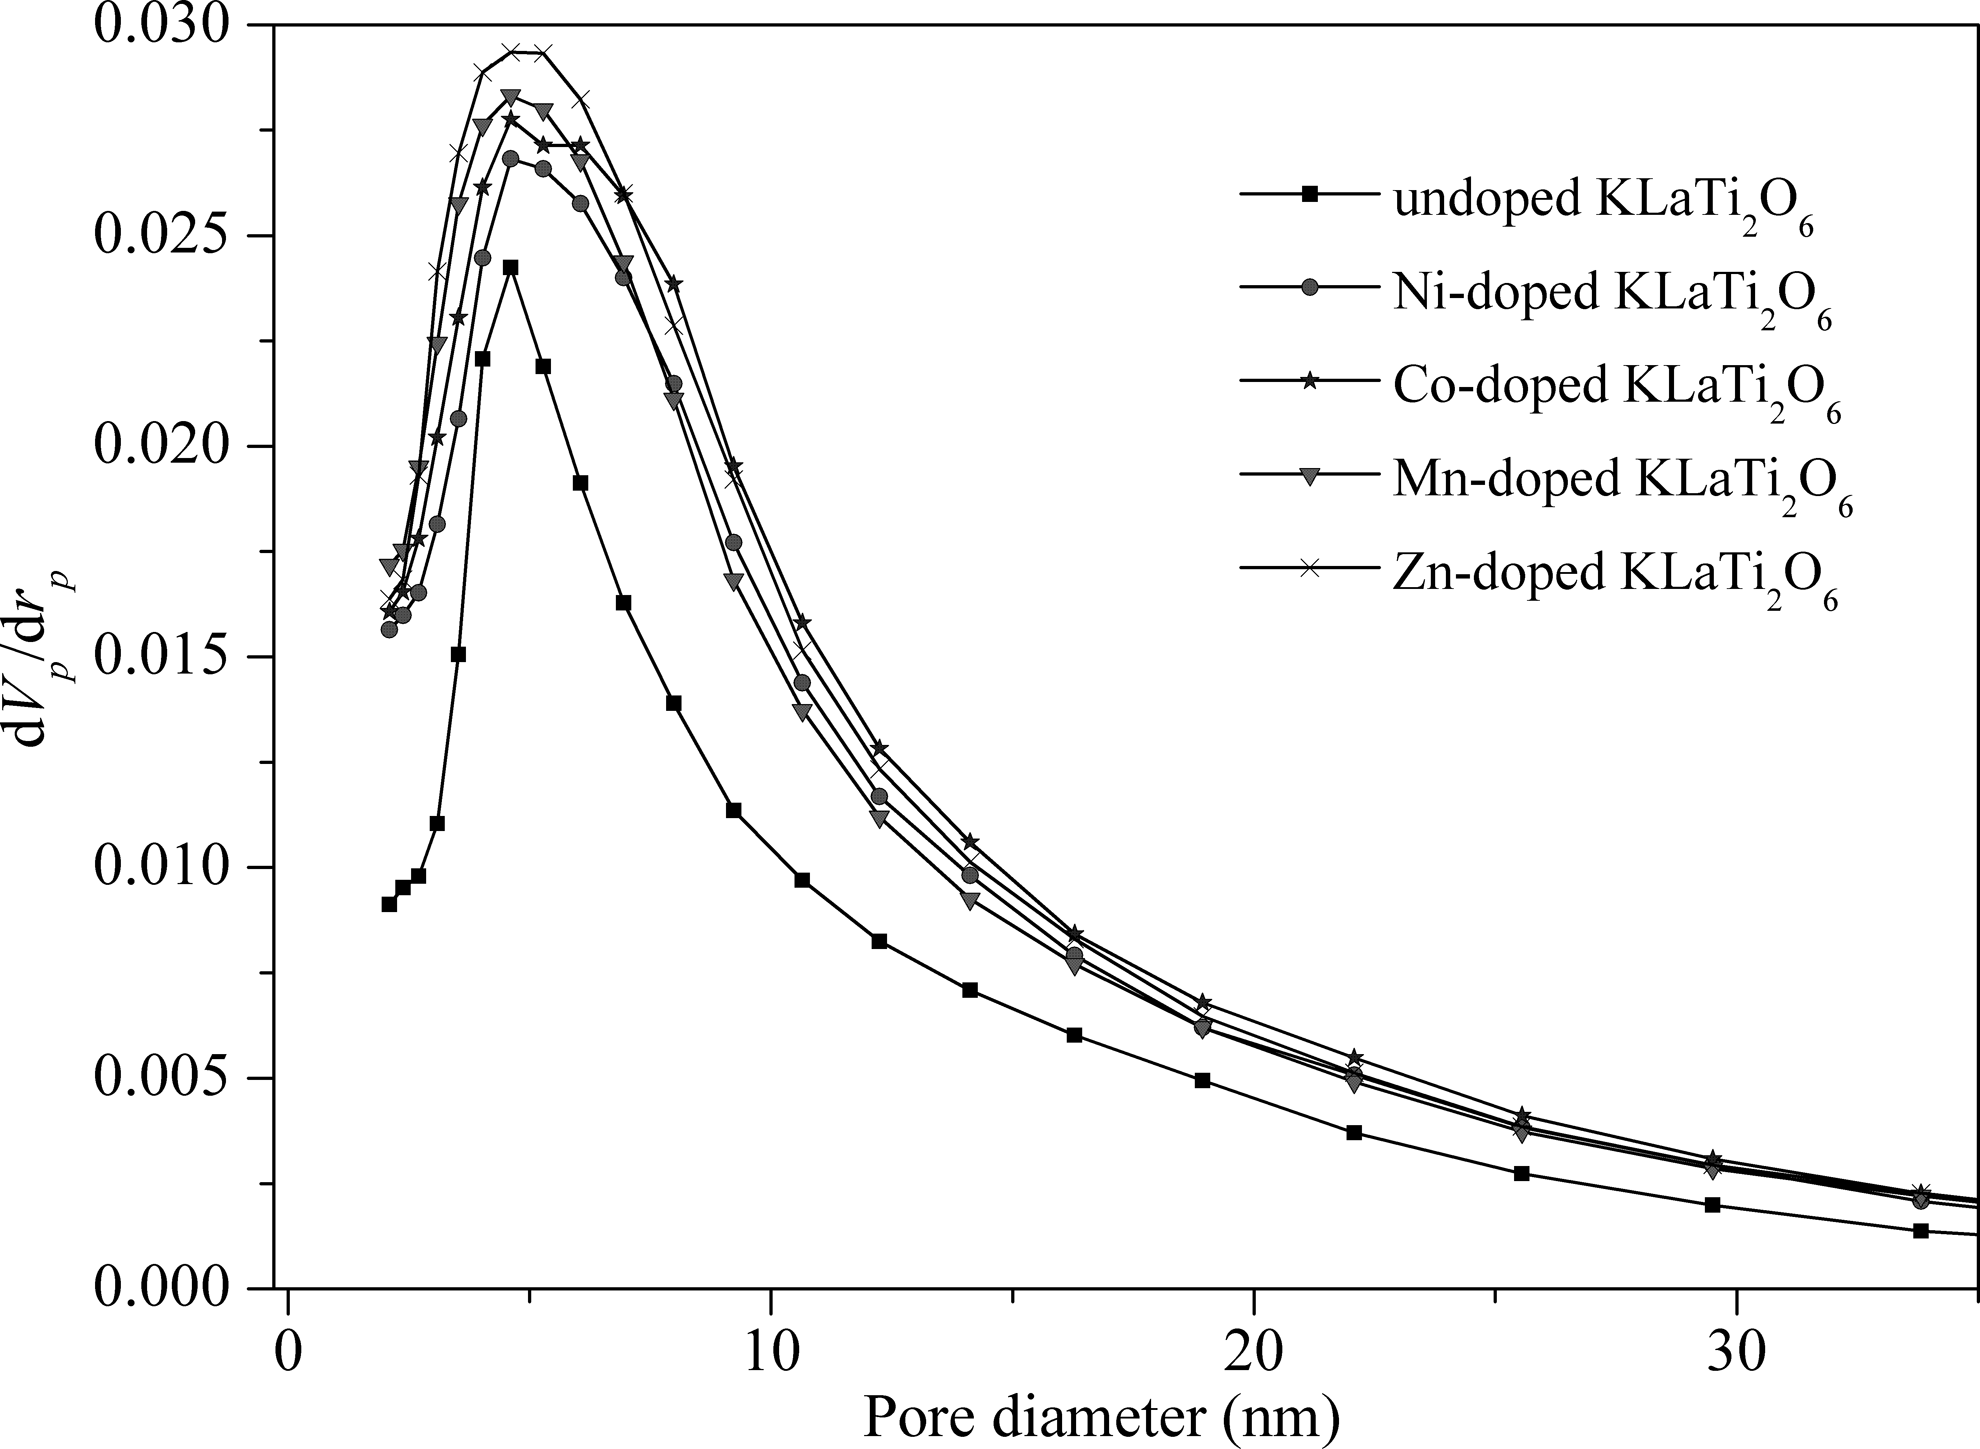
BJH pore size distribution of samples.
The UV-visible absorption spectra of the samples are shown in Fig. 5. In the present study, the sharp UV absorption of undoped KLaTi2O6 is identified near 360 nm. However, metal doping causes a red shift of the absorption edge and the metal-doped photocatalysts show different absorption behaviors in visible light range from 400 to 700 nm. The undoped KLaTi2O6 is white, while four different colors appear for metal-doped samples. For a semiconductor, the optical absorption near the band edge follows the equation (Huang et al., 2010):
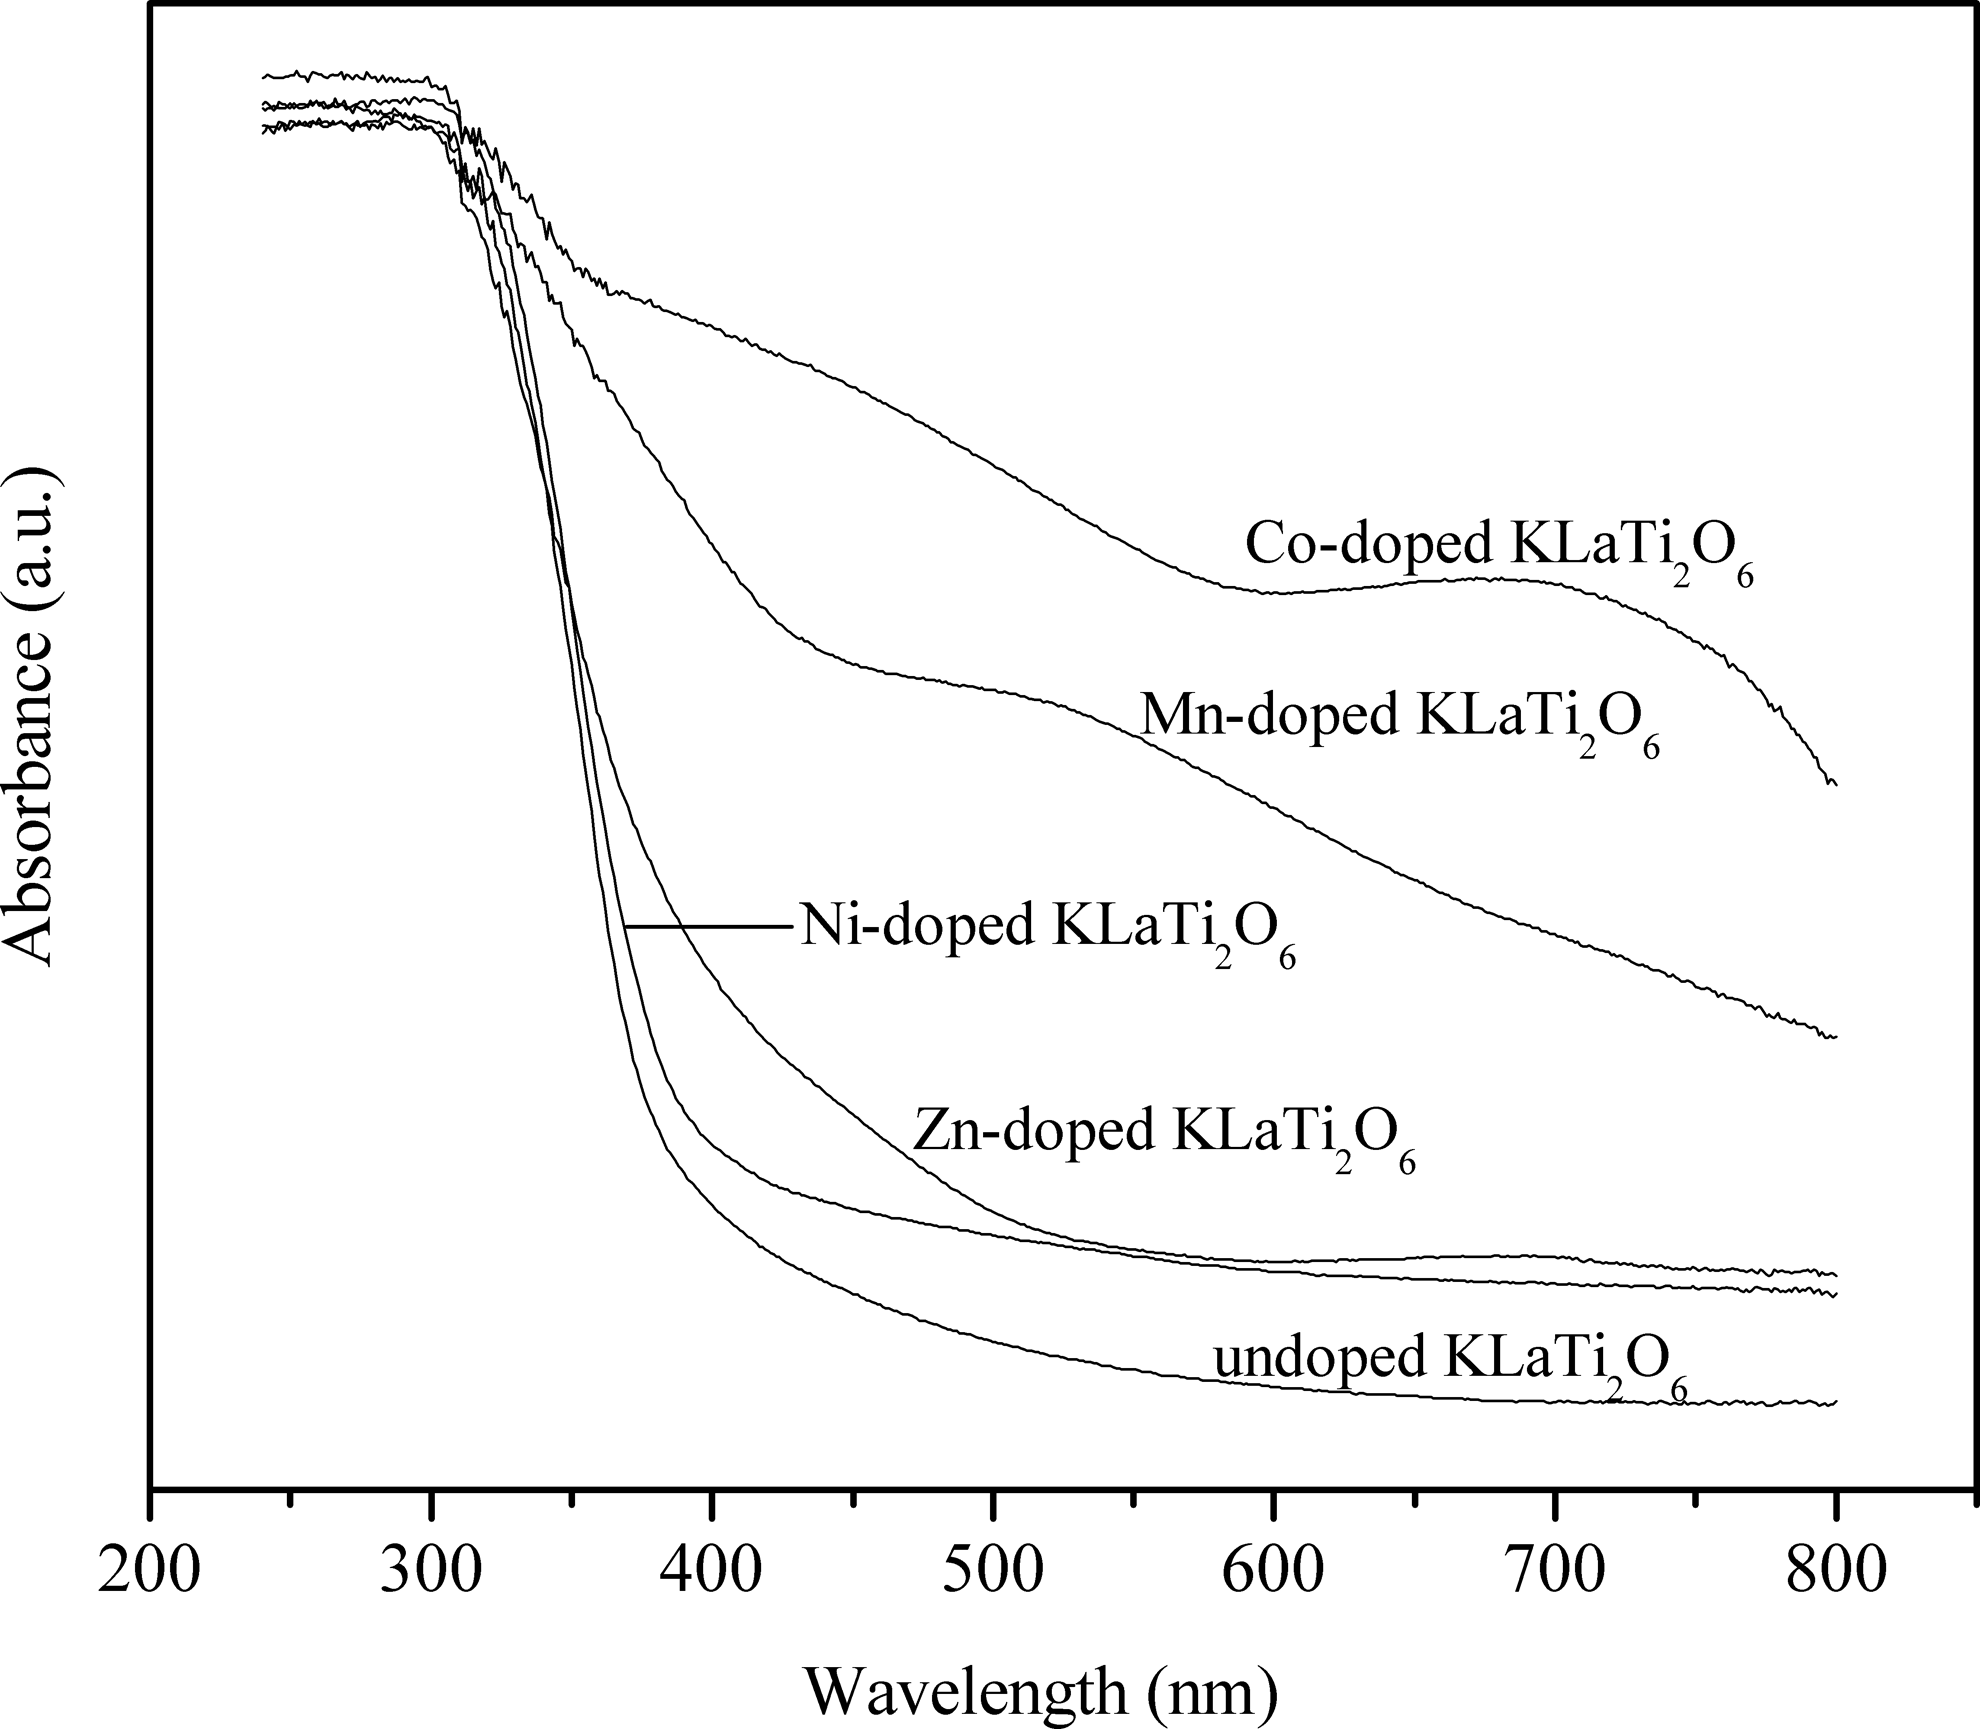
Ultraviolet–visible light absorption spectra of different samples.
The value of n for the direct band gap material should be fixed at 1 and the experimental band gaps of the samples are listed in Table 2. The band gaps narrowed by metal doping ranged 2.89–3.36 eV versus 3.39 eV for undoped KLaTi2O6. This means that the metal-doped samples can obtain more photons to excite the electron from the valence band to the conduction band (Huang et al., 2010). The optical band gaps are found to follow the order: undoped KLaTi2O6>Ni-doped KLaTi2O6>Zn-doped KLaTi2O6>Mn-doped KLaTi2O6>Co-doped KLaTi2O6.
Photocatalytic degradation of chlorobenzene
Figure 6 shows the degradation ratio of chlorobenzene for the samples, along with the photolysis of chlorobenzene without a catalyst under visible light irradiation. It is evident that the chlorobenzene photodecomposition is negligible without the catalyst. Metal doping can improve the photoactivity of KLaTi2O6 and the decomposition ratio order of chlorobenzene is Co-doped KLaTi2O6>Mn-doped KLaTi2O6>Zn-doped KLaTi2O6>Ni-doped KLaTi2O6. The optimum doping metal is found to be Co and the degradation ratio is more than 50%. This means that metal-doped KLaTi2O6 is excited more effectively than undoped KLaTi2O6 under visible light irradiation, which might be attributed to the formation of a new localized energy level (Yang et al., 2009a, 2009b) and increase of specific surface area (Li et al., 2011) (Table 2).

Comparison of photocatalytic activities under visible light irradiation (1) without a catalyst, (2) with undoped KLaTi2O6, (3) with Ni-doped KLaTi2O6, (4) with Zn-doped KLaTi2O6, (5) with Mn-doped KLaTi2O6, and (6) with Co-doped KLaTi2O6.
Photocatalytic decomposition pathway of chlorobenzene
Figure 7 illustrates the GC-MS analysis for chlorobenzene decomposition with Zn-doped KLaTi2O6. The five dominant peaks at 7.98, 8.15, 8.45, 12.15, and 8.70–9.10 min are detected, and the associated mass spectra (Fig. 8) identify the corresponding intermediates as benzaldehyde, o-chlorophenol, m-chlorophenol, p-chlorophenol, and dichlorobenzene, respectively. Further confirmation was made by comparing the retention times of the corresponding pure samples.

Gas chromatogram of filter liquid after the photocatalytic decomposition of high concentration of chlorobenzene with Zn-doped KLaTi2O6.

Mass spectra of the corresponding intermediates.
To investigate the source of carboxyl group of benzaldehyde, in situ FTIR was utilized during the photo-oxidation process in the absence of CO2. The results are shown in Fig. 9. The IR spectrum displays the characteristic bands of Zn-doped KLaTi2O6 [(1) in Fig. 9]. After chlorobenzene is introduced, the new bands at 3085, 1586, 1481, 1120, 1085, and 1016 cm−1 appear. They are the same as those characteristic vibration bands for chlorobenzene in the published literature (Zhou et al., 1993; Liu et al., 2002) (Table 3).
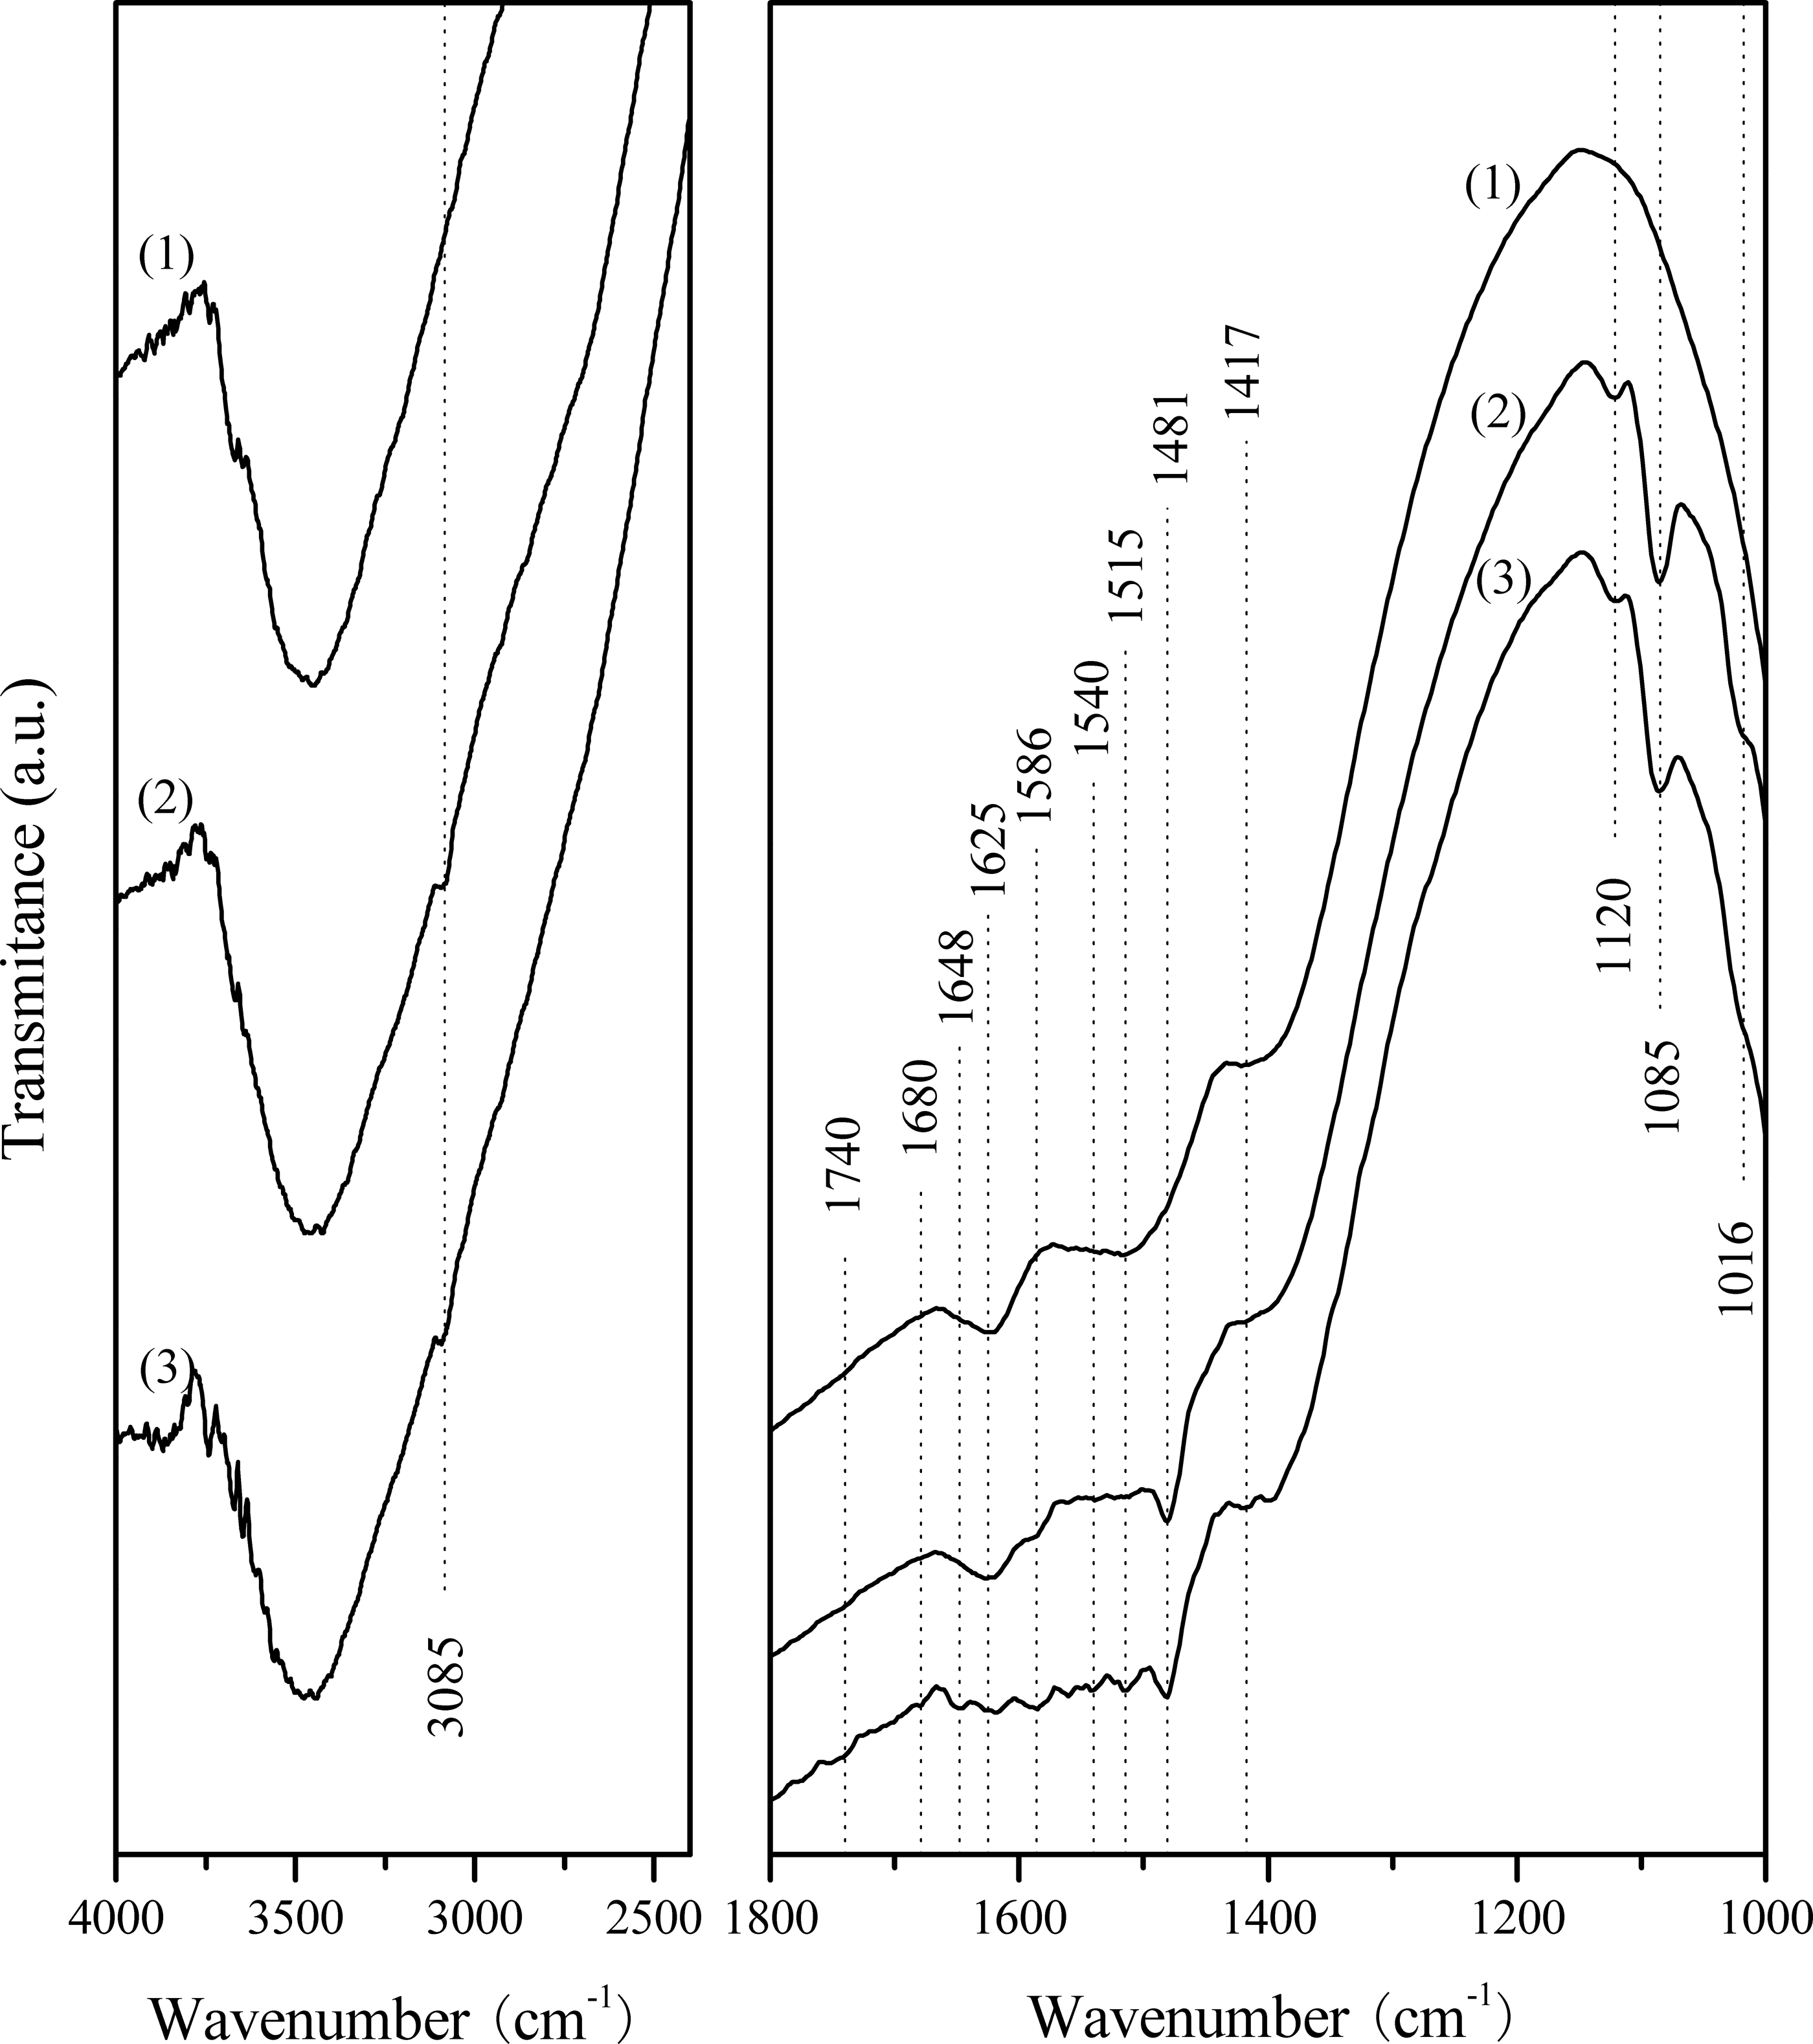
Infrared spectra of (1) Zn-doped KLaTi2O6 photocatalyst before adsorption of chlorobenzene, (2) chlorobenzene adsorbed on catalyst before visible light irradiation, and (3) chlorobenzene adsorbed on catalyst after exposure to visible light for 180 min. The spectra of the reaction cell full of N2+10% O2 are utilized as the background.
Upon irradiation, a slight decrease in the chlorobenzene bands at 3085, 1120, and 1085 cm−1 is observed and the band at 1016 cm−1 almost disappears, while new weak bands appear at 1740, 1680, 1648, 1540, 1515, and 1417 cm−1. The bands at 1680, 1648, 1586, and 1515 cm−1 prove the presence of benzaldehyde (Augugliaro et al., 1999; Li et al., 2011). Bands at 1740 and 1680 cm−1 are characteristic of compounds containing the C=O group (Li et al., 2003). The bands at 1740, 1540, and 1417 cm−1 show the formation of formaldehyde (Lochař, 2006; Sun et al., 2010). FTIR analysis shows that benzaldehyde and formaldehyde exist during the photocatalytic process. Obviously, the carboxyl group of benzaldehyde could come from formaldehyde formed by aromatic ring cleavage during the photo-oxidation of chlorobenzene.
A distinct pathway might occur during the photocatalytic degradation of chlorobenzene, which is the formation of benzaldehyde. Some chlorobenzene molecules are first cleaved, then dechlorinated, and ultimately converted to simple organic acid and aldehyde. Others are first dechlorinated and then converted to benzaldehyde by reaction with aldehyde radicals formed earlier. The pathway is depicted in Fig. 10.

Proposed degradation process of chlorobenzene.
Although benzaldehyde and other byproducts adsorbed on the catalysts were detected, no byproducts were detected by GC-MS in the gas phase during any of the experiments.
Conclusions
In summary, metal-doped KLaTi2O6 photocatalysts were successfully prepared. The Co-doped KLaTi2O6 photocatalyst showed a significantly higher photocatalytic activity for chlorobenzene degradation under visible light irradiation. GC-MS analysis and in situ FTIR analysis indicated that benzaldehyde was the predominant species during the photocatalytic degradation of gas-phase chlorobenzene under visible light irradiation.
Footnotes
Acknowledgment
This research was financially supported by “the Double Hundred Plan.”
Author Disclosure Statement
No competing financial interests exist.