
Abstract
Abstract
Steam pretreatments mixing waste activated sludge (WAS) with live steam were applied to decompose WAS, and to enhance its anaerobic digestion performance. Results showed that the optimum pretreatment condition was 120°C for 10 min. Chemical oxygen demand (COD) of the pretreated group was improved to 14,000 mg/L, 18 times higher compared with the control group. The concentration of extracellular polymeric substances and soluble protein increased to 1866 mg/L and 1495 mg/L, respectively. Soluble COD increased exponentially with increasing specific energy; only a specific energy input of 271 kJ/kgTS was required. Analysis indicated that the particle size of sludge was reduced and the distribution was more uniform after the pretreatment. Results from the subsequent batch anaerobic digestion indicated that higher stability of the system and biogas production were obtained in the pretreated group. Compared with raw sludge, biogas production of pretreated sludge was improved by 122%, corresponding to 600 mL/g of volatile solids. The present study mostly assesses the live steam pretreatment of WAS and compares obtained results with previously examined thermal, chemical, or ultrasound pretreatments. Results demonstrate that live steam pretreatment significantly enhances the biogas production while requiring limited energy input only.
Introduction
WAS is a complex matter which generally comprises of bacteria cells, extracellular polymeric substances (EPS) and inorganic inert materials. All the physical-chemical parameters, including existence form (scattered or gathered), position (intracellular or exocellular), molecular structure (long or short chain), chemical composition (such as polysaccharide, proteins, and DNA) and solubility characteristics could influence the performance of anaerobic digestion of WAS. To achieve an exhaustive disintegration of WAS, pretreatment is needed (Nickel and Neis, 2007).
Many pretreatment techniques have been reported to disintegrate the sludge on lab-scale and pilot-scale plants over the past decades. Some examples include ultrasonic treatment (Weemaes and Verstraete, 1998; Tiehm et al., 2001; Dewil et al., 2006a, 2006b; Nickel and Neis, 2007; Appels et al., 2008a, 2008b; Pham et al., 2009; Erden et al., 2010), ozone oxidation (Weemaes and Verstraete, 1998; Weemaes et al., 2000; Neyens et al., 2002; Neyens et al., 2003b; Neyens and Baeyens, 2003a; Dewil et al., 2007; Erden et al., 2010), mechanical disintegration (Harrison, 1991; Kopp et al., 1997; Weemaes and Verstraete, 1998; Nah et al., 2000; Lehne et al., 2001), acid and alkaline treatment (Neyens and Baeyens, 2003b; Elsanousi et al., 2007), thermal treatment (Barlindhaug and Ødegaard, 1996; Barjenbruch and Kopplow, 2003; Gavala et al., 2003), Fenton process (Kaynak and Filibeli, 2008; Erden and Filibeli, 2010), enzymatic hydrolysis (Thomas et al., 1993; Guellil et al., 2001; Ayol et al., 2008), or combinations of these techniques (Appels et al., 2008a; Chauzy et al., 2008). Thermal pretreatment has been studied to improve the anaerobic digestibility and dewatering properties. Alkaline pretreatment has been also used to solubilize various substrates, such as lignocellulosic materials or WAS (Penaud et al., 1999). Chiu and colleagues (1997) showed that chemical oxygen demand (COD) solubilization, volatile solids (VS) reduction, and biogas production were enhanced when WAS was pretreated with NaOH. Ultrasonic disintegration is a well-known method for rupturing microbial cells to release intracellular material. It was reported that a specific energy level of 500–5000 kJ/kgTS is effective for sludge disintegration and this application led to an increasing methane production in anaerobic digestion (Bougrier et al., 2006; Erden et al., 2010). However, none of the above pretreatment methods can meet the requirements of both easy operation and low cost. To solve this problem, the method of live steam pretreatment was introduced and fully examined in this article.
Steam explosion is an economical and environmentally friendly process, which is extensively used in destroying the structural components of biomass (e.g., crop straw) (Yu and Chen, 2010). Steam explosion is typically initiated at a high temperature of 160–260°C and a high pressure of 0.69–4.83 MPa. The state is maintained only a few seconds before the biomass being exposed to atmospheric pressure, resulting in the disrupting of extremely hard structures. However, WAS, which consists of 60–70% organic substances (protein and polysaccharide), is completely different from straw. A relatively smooth heating pattern with much longer duration would improve the disruption of sludge. Live steam pretreatment was applied in this article with three different conditions (100°C at the pressure of 0.1 MPa; 120°C at 0.2 MPa; 140°C at 0.36 MPa).
To the best of our knowledge, enhancing biogas production by adding live steam into WAS is a relatively novel and scarcely reported process (Chauzy et al., 2008). Accordingly, the purpose of this work was to investigate the effects of different conditions on the steam-pretreatment of WAS. The ammonia-nitrogen and pH were detected to evaluate the stability of the anaerobic digestion system. The soluble COD (SCOD), the ratio of EPS to soluble protein (SP), and the methane production were measured to confirm whether the live steam pretreatment was a better way to deal with sludge in comparison with the general thermal, physical, or chemical methods.
Materials and Methods
Waste activated sludge
WAS samples were obtained from the Shunyi municipal wastewater treatment plant, which serves part of Beijing with a handling capacity of about 160,000 population equivalent. After settling in the secondary clarifier, the WAS was thickened using a thickening table to reach a moisture content of 85–90%. To facilitate the storage of WAS, the concentrated sludge was air dried for 20 days at ambient temperature, collected in sealed plastics bags and stored at −20°C for later experiments. The experiments proved that there was no difference between a suspension of 10% (w/w) dried sludge and fresh 10% (w/w) WAS in digestion yields. General characteristics of the samples are shown in Table 1, with average values and deviations of two repeat measurements included.
COD, chemical oxygen demand.
Steam pretreatment
For pretreatment experiments, the WAS samples were prepared at a moisture content of 90 wt%, with equivalent solution total volume of about 150 mL for each group.
A laboratory-scale steam generator was used for the live steam-pretreatment. The pretreatment temperature was controlled at 100°C, 120°C and 140°C, with a saturated steam pressure of about 0.1, 0.2 and 0.36 MPa, respectively. The pretreatment time was performed from 5 to 40 min (5, 10, 20, 30, and 40 min). The warming and cooling process was quite short. The heat loss was <5% for each experimental group, which could be ignored. All experiments were conducted in duplicate. The errors of duplicate measurements were <5% for all parameters; hence, average values are given. In this study, the degree of sludge disintegration was calculated by the difference of the COD/EPS ratio between the steam-pretreatment and the methods reported elsewhere. Electron microscopy was used for imaging the disintegration of sludge flocs.
Anaerobic batch digestion tests
Experiments were carried out in bench scale anaerobic reactors of 1.0 L (total volume), immersed in a thermostatic water bath at 38±1°C. The reactors were fed with raw anaerobic inoculum at the ratio of 5% (w/w) and various WAS samples: untreated, common thermally-treated, and live steam-treated. The available volume of the digestion liquid was 0.8 L. The dosage of sludge was 2.4 g VS for each group. For the common thermal-pretreatment group, the sludge solution was boiled at 100°C for 10 min. For the steam-pretreatment group, the sludge solution was heated by the steam generator at 100 and 120°C for the required time. The samples were cooled down to room temperature before being added to the anaerobic digester.
Initial pH was 7.2–7.3 and the digestion period was about 10 days. The produced biogas was collected in a gas-collecting bag. The biogas yield was calculated by drainage method through a peristaltic pump. When the pressure in the bags reached 1000 mbar, a sample of gas was removed and the pressure released. Biogas and methane production were monitored until the biogas production of each batch experiment reached stable levels and the production rate approached to zero. The pH and biogas yield were obtained daily. The digestion liquid was sampled at regular time intervals (every 2 days) until the digestion was ultimately terminated.
Analytical methods
Chemical and instrumental analysis
The total solids (TS), VS, and COD were assayed according to conventional methods (ANSI) (Bougrier et al., 2006; Yu and Chen, 2010).
For the EPS content, the samples were passed through 0.25 μm pore size membrane filters, which were suitable to separate protein and carbohydrates. The protein content was determined by the Coomassie Brilliant Blue G-250 method (Bradford, 1976). The carbohydrate content was determined using a modified dinitrosalicylic acid (DNS) method, with glucose as the standard sample. The absorbance of the standard sample and the ordinary samples was determined by spectrophotometer at 540 nm.
The ammonia-nitrogen content was determined by a modified Nessler colorimetric method. The samples were processed by adding sodium potassium tartrate tetrahydrate to screen main ions in the solution, such as Ca2+ and Mg2+. All batches were performed in duplicate and the average values are reported.
Compositions and concentrations of gas samples (CH4/CO2/N2) were analyzed by gas chromatography (GC-2014C, Shimadzu), equipped with a thermal conductivity detector (TCD) and a TDX-01 packed (3 mm inside diameter) stainless steel column (2 m×3 mm). The temperatures of the column, injector, and the TCD detector were 160°C, 160°C and 180°C, respectively. Argon was used as the carrier gas at a flow rate of 30 mL/min.
The sludge size analysis of untreated and steam-treated WAS was performed by scanning electron microscope (SEM). Average sizes were estimated from 10 images randomly taken on at least triplicate samples. Images were processed with Photoshop software.
Biogas composition and yield
The GC was calibrated by injecting a reference gas mixture containing CO2, N2, CH4, and H2 with component concentrations of 19.9%, 39.2%, 39.9% and 1.01% (v/v), respectively. CH4 production was calculated using the following equation (Gurung et al., 2012):
where V R,i and VR,i−1 are the cumulative CH4 gas volumes at the current (i) and previous (i−1) time intervals, respectively, V T,i and VT,i−1 are the total biogas volumes in the current and previous time intervals, C R,i and CR,i−1 are the fraction of CH4 in the current and previous intervals in the headspace of the digestion bottle measured using GC, and VH is the total volume of headspace in the reactor (150 mL).
Cumulative biogas production curves were obtained over the course of the batch experiment and analyzed using the modified Gompertz equation.
Energy consumption analysis
Similar to the method used for ultrasound pretreatment, the specific energy (SE) was introduced as a reference of energy consumption in live steam-pretreatment. The SE (in kJ/kg TS) was calculated using the following equation:
where H was the enthalpy of saturated steam in kJ/kgSteam, M was the steam dosage in kgSteam/(kg TS·h), and t was the steam-pretreatment time in h. Due to thermal losses in the system, the actual steam energy imparted to the sludge is lower than the amount of energy applied by the steam device, and the heat loss was ∼5% (Kobus and Kusińska, 2008).
The actual energy transferred to the sludge with common thermal pretreatment has been calculated using the thermal method recommended initially by González et al. (1999). The actual energy requirements for heating sludge were calculated based on the following equation (Roš and Zupančič, 2003):
where Q s is the quantity of heat required to heat the sludge in kJ, ρ s is the density of sludge in kg/m3, V s is the volume of the treated sludge in m3, C p is the specific heat of sludge in kJ/(kg·°C) [the value of water and dry sludge were 4.18 and 0.84 kJ/(kg·°C), respectively], T initial is the initial temperature of sludge in °C, and T final is the final temperature of sludge in °C. The initial temperature of sludge was 25°C and the heat loss during thermal pretreatment equipment was 5% (Dhar et al., 2011a, 2011b). The energy consumption of live steam and sole thermal pretreatment was calculated and compared to the results of recent literature (Neyens et al., 2003b; Bougrier et al., 2006; Appels et al., 2008a).
Results and Discussion
Effects of pretreatment on the disintegration of WAS
The degree of WAS disintegration is a significant parameter in anaerobic digestion (Eskicioglu et al., 2006; Nges and Liu, 2009). With considerable disruption, a large amount of solid organic substrates (sludge flocs) will dissolve in the aqueous phase, providing more nutrition to microbes for higher biogas production. The effects of live steam-pretreatment on the dissolution of COD (SCOD), SP, and EPS are shown in Figs. 1 and 2, and their specific values are presented in Table 2.

Effects of live steam-treated temperature and time on chemical oxygen demand (COD) dissolution.
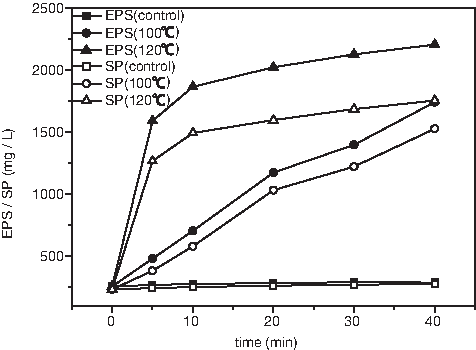
Effects of live steam-treatment temperature and time on dissolution of extracellular polymeric substances (EPS) and soluble protein (SP).
COD f , the final COD value; COD t , the total COD value; SP f , the final soluble protein value; EPS f , the final extracellular polymeric substances value.
Figure 1 shows the influence of pretreatment on the SCOD. For the control group, the SCOD remained almost invariable from 5 to 40 min. However, the SCOD increased significantly after the steam pretreatment since the sludge flocs disintegrated and the organic matter dissolved. Both the pretreatment temperature and time had a considerable effect on WAS disintegration. At the temperature of 100°C, the SCOD improved smoothly during the whole pretreatment process. The final SCOD increased to 5340 mg/L, about six times higher than the initial SCOD. However, at 120°C, the SCOD sharply increased to 14,000 mg/L within the initial 10 min and had no significant increase after 10 min. The final SCOD was ∼22 times higher than the control group, corresponding to the value of 17,200 mg/L. By contrast, no obvious difference on SCOD was observed between 120°C and 140°C. This illustrated that the SCOD was less influenced by temperature when the temperature exceeded 120°C. Therefore, the optimum pretreatment condition was determined to be 120°C for 10 min.
The ratios of the final COD (COD f ) to the total COD (COD t ) shown in Table 2 were 4.14%, 24.84%, 80.00% and 81.40% for the control, 100°C, 120°C, and 140°C groups, respectively. Literature references fluctuated from 10% to 60% with various pretreatment methods. Eskicioglu et al. (2006) used thermal method (96°C) for pretreating thickened WAS, and found that the COD could be improved by 3.6 times than the control group. Nges and Liu (2009) used the pretreatment temperatures of 50–70°C and reported an increase in the ratio of COD f /COD t from 2% to 21% with little impact of temperature. For the ultrasound pretreatment, Bougrier et al. (2005) found an increase in the ratio of COD f /COD t in WAS from 4% to 32% when increasing SE input from 0 to 10,000 kJ/kg TS. By contrast, the COD dissolution with live steam pretreatment was significantly higher than results found in previous alternative pretreatment studies.
Dissolution of EPS and SP in the WAS with different steam pretreatments is shown in Fig. 2 (140°C group was removed). In the pretreated WAS at 100°C, the dissolution of EPS and SP was similar with a linear related curve: 259 to 1743 mg/L for EPS and 235 to 1529 mg/L for SP, that is, 6.7 and 6.5 times of EPS and SP compared to the control group, respectively. In the pretreated WAS at 120°C, the dissolution of EPS and SP was still similar, but increased much more quickly. The values of EPS and SP at 10 min were 2206 and 1755 mg/L, respectively, that is, 8.5 and 7.5 times higher than the control one. Dhar et al. (2011c) used thermal and ultrasound pretreatments and found that the SP content increased by approximately four times with different pretreating temperatures of 50°C, 70°C and 90°C. The SP increased by 2.71, 5.68, and 7.64 times for the SE inputs of 1000, 5000, and 10,000 kJ/kg TS, respectively. The results of the dissolution of EPS and SP with live steam-pretreatment were better compared to these previous studies.
With disintegration of WAS, organic substances were transferred from the solid phase (sludge flocs) into the aqueous phase, resulting in the increasing of COD, EPS, and SP concentrations in the aqueous phase. Figure 2 shows that the SP value was high and close to EPS for the control, 100°C steam, and 120°C steam groups. The SP f /EPS f (Table 2) was basically more than 80% for all three groups; thus, crude protein disintegration might be the main increase for EPS. Since EPS made a great contribution to COD, the COD value of WAS was actually determined by the disintegration of crude protein. Nah et al. (2000) also found that protein is one of the main components of EPS and contributes largely to the COD of the sludge.
Effects of pretreatment on steam energy consumption
Energy consumption is an important factor that should be taken into account for all of the pretreatment methods of WAS (Feng et al., 2009; Dhar et al., 2011b). There were numerous parameters to indicate the energy consumption, among which SCOD/SE (specific energy) was a good one (Dhar et al., 2011b). Figure 3 shows the relationship between the specific energy of steam pretreatment and the COD dissolution. The increasing of COD dissolution compared to the control was significantly correlated with the actual energy imparted to the sludge during the pretreatments. At 100°C, the COD dissolution increased slowly with the growing specific energy. However, at 120°C, the curve varied in exponential type. The COD dissolution increased rapidly to the maximum in the initial 10 min with similar specific energy put in as previously. Thus, the pretreatment time could be cut down to 10 min along with obtaining a better COD dissolution at 120°C, while the steam SE input was only 271 kJ/kgTS. Dhar et al. (2011b) used ultrasound to treat the WAS and got similar results with an energy consumption of 5000 kJ/kgTS. Feng et al. (2009) found that 1000 kJ/kgTS was an optimal SE input for improving sludge dissolution with ultrasound pretreatment. In this study, the energy consumption was quite low [only 5–30% of the literature data (Feng et al., 2009; Dhar et al., 2011b)] compared with ultrasound pretreatment with a similar COD dissolution obtained.
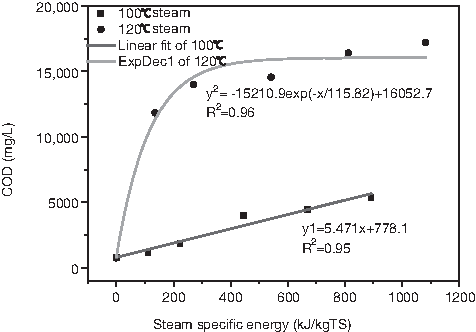
Effects of live steam-treatment specific energy on COD dissolution. See Equation (2).
The degree of destruction of the sludge flocs might different between the various pretreatment methods. The floc structure was broken down and its size was reduced with various pretreatment methods, causing an increase of COD dissolution. However, the structure was not disrupted if the pretreatment strength was not powerful enough. Figure 3 shows that the SCOD was at a low level (<5000 mg/L) throughout the whole process when the steam temperature was 100°C. As the temperature increased to 120°C, the COD dissolution sharply increased to 14,000 mg/L before the specific energy reached 400 kJ/kg TS. Similar results were also obtained previously. Inagaki et al. (1997) reported that thermal pretreatment, even at 90°C, could not destroy the cells. Neyens and Baeyens (2003b) proved that thermal pretreatment at 60–180°C could disintegrate the cells and liberate intracellular substances. Valo (2004) studied the effects of thermal treatment temperature and time on the disintegration of WAS and found that temperature was the main influential parameter on the dissolution of COD and VS. When the temperature reached 130°C, the sludge flocs could be destroyed in <15 min and the specific energy was relatively low.
Effects of pretreatment on the physical properties of WAS
Microphotographs of 3000× magnification for the control group and 100,000× magnification for the treated groups are shown in Fig. 4. The flocs structure was decreased and dispersed after pretreatments. The particle distribution was more uniform. The particle sizes were ∼2–5 μm, 0.1–0.2 μm, 0.05–0.1 μm, and 0.02–0.05 μm for the control, 100°C (10 min), 120°C (10 min), and 120°C (40 min) groups, respectively. As the pretreatment intensity increased, a large amount of interspaces were formed. However, the interspace structure did not further increase as the steam intensity reached the critical value of 120°C for 10 min, which meant that the disintegration of the sludge flocs did not proceed any further. Thus, the low intensity of live steam pretreatment (120°C, 10 min) gave a better dispersity of sludge and a better release of organic matter. Feng et al. (2009) used sonication to destroy the sludge and found that neither the floc structure nor the microbial cells were totally disintegrated, even at energy dosages as high as 26,000 kJ/kg TS, because a network of filamentous bacteria was still observed in the photomicrographs of the treated sludge. However, there were also some negative issues as the flocs size reduced; a possible drawback of the live steam treatment could be similar to the drawbacks obtained with all the other pretreatments, that is, the decrease of floc size requires extra amounts of polyelectrolyte for dewatering. It was found that ∼20% more polyelectrolyte could be needed (Appels et al., 2008b). The extra polyelectrolyte cost was largely outweighed by the significant increase in biogas production.
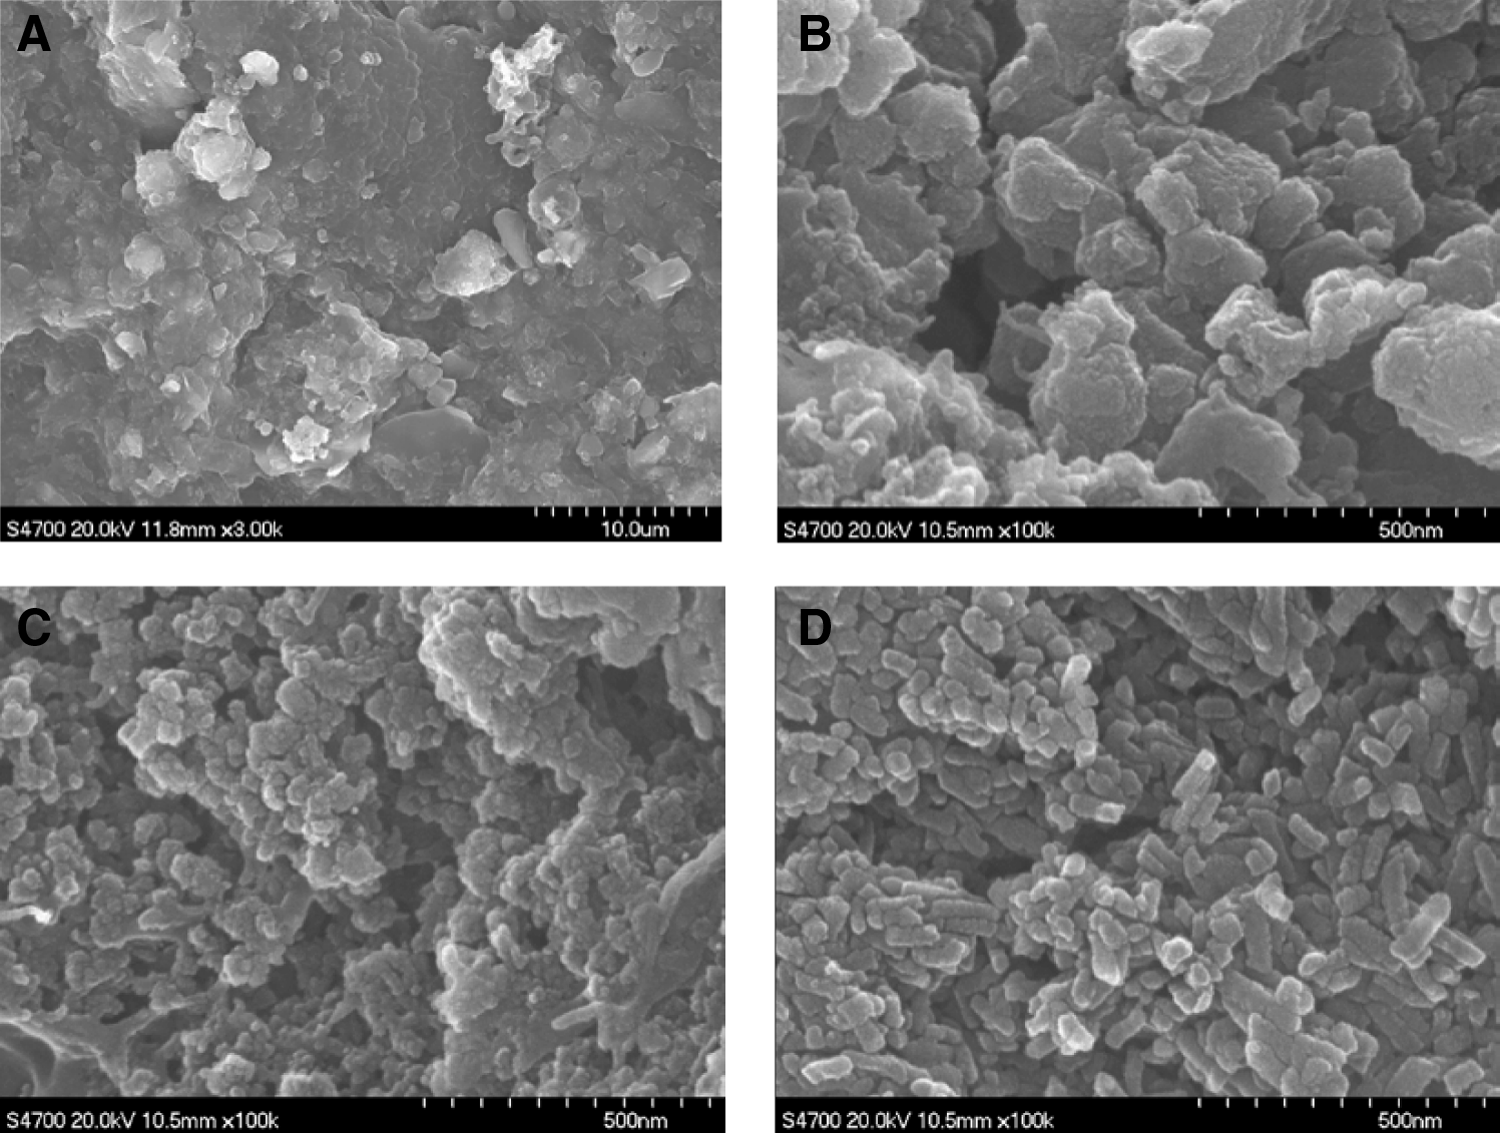
Microphotographs of WAS sludge with and without pretreatments.
Effects of pretreatment methods on batch digestion experiments of WAS
Stability of the anaerobic digestion system
The research was carried out in a laboratory scale reactor of 1 L over >24 months. The purely thermal pretreatment (100°C, 10 min), and live steam pretreatment (120°C, 10 min; and 100°C, 10 min) were applied. To compare the treatment effects, a control group without any pretreatment was also added to the reactor. All groups were originally digested with glucose and peptone until the anaerobic digestion systems were stable. Then the batch digestion experiments started up, the operational parameters of the reactors were as follows: an initial pH of 7.2–7.5 and a feed rate of 3 g VS/L. The digestion system operated steadily during the entire experimental period. No system acidification or deterioration was observed. The total alkalinity was 10–13 g CaCO3/L, providing a high buffering capacity for the digestion system (Gurung et al., 2012).
The stability of pH and ammonia-nitrogen (NH4+-N) concentration were important indicators of anaerobic digestion, specifically for the activities of acetogenic bacteria and methanogens. The pH changes could reflect the reaction speed of the digestion system, while the NH4+-N concentration could indicate whether the digestion was smooth. Figure 5 shows the pH variations through the whole digestion period. Each group had similar changes. The initial pH was ∼7.30, and decreased rapidly as the digestion started up. The pH began to revert after 0.5 day. Two days later, it reached the normal level and maintained a dynamic balance. A more obvious decrease was observed as the pretreatment intensity was improved. For the control group, the minimum pH was 6.84, with a drop of 0.43. For the 120°C steam group, the minimum pH was 6.70, with a drop of 0.60. Biodegradable organic matter was released after the pretreatment, and was converted into micromolecule acids, resulting in a pH decrease. Liu et al. (2012) also found that significant decrease of pH value could be observed when more biodegradable organic matter was added to the reactor (the organic loading rates increased from 1.2 to 8.0 kg VS/[m3·d]).
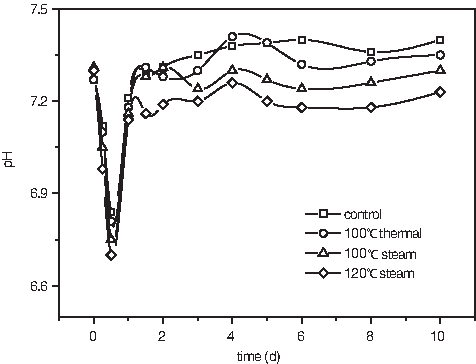
Variations of pH values with different pretreatment methods.
The concentration of ammonia-nitrogen was considered as another significant parameter in anaerobic digestion. It was created by the disintegration of the crude protein. The ammonia-nitrogen can be toxic to anaerobic microbes at the concentration of 0.8–1.5 g/L (Koster and Lettinga, 1984). Figure 6 shows the variations of ammonia-nitrogen concentration. All groups increased initially and kept stable in the remaining time. However, the ammonia-nitrogen concentration would achieve to the stable state much more quickly with the pretreatments. The ammonia-nitrogen concentration increased as the pretreatment intensity was enhanced. The 120°C steam group obtained the maximum value of 443.6 mg/L (far below the critical value). Erden et al. (2010) reported that the release of total nitrogen increased by adding ozone oxidation or ultrasonic pretreatment, and that the steady state was reached more quickly (<20 days).
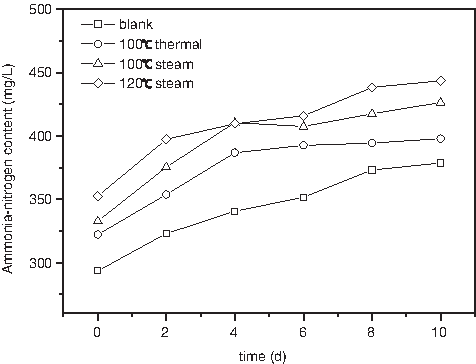
Variations of ammonia-nitrogen content on different pretreatment methods.
Biogas and methane production
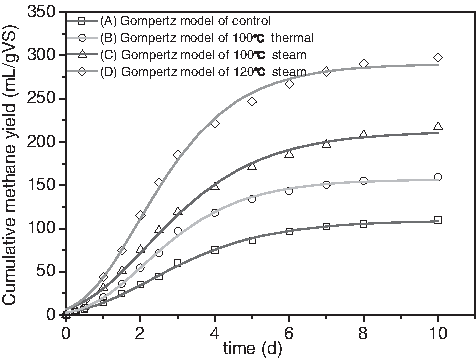
Figure 7 shows the cumulative biogas production as a function of time for the different pretreatments. The variation trend was similar for all groups. It increased sharply in the initial 2 days and leveled off after 4 days. Compared with the control group, the cumulative biogas production of the 120°C steam pretreatment group was improved by 122%, corresponding to 600 mL/g VS (as the COD and VS both express the content of organic matters, they are equivalent.). Additional, the increase of biogas yield was 28% and 67% for the purely thermal and 100°C steam group compared to the control group, respectively. The CH4 percentage (%) of the biogas is shown in Fig. 8. The CH4 percentage (%) in biogas was very low at the initial of anaerobic digestion because much CO2 was produced. It increased linearly to 65% in the initial 2 days. The final methane concentration was about 70% for all groups. Figure 9 shows the cumulative CH4 yields. The curves were similar to the Gompertz curve. The cumulative CH4 yield was 109.8 mL CH4/g VS for the control group and 297.7 mL CH4/g VS for the 120°C steam group. The increase of methane yield was 45%, 98%, and 171% for the thermal, 100°C steam and 120°C steam group compared to the control, respectively. Kim et al. (2003) compared various pretreatment methods to deal with WAS. The methane production levels obtained from the anaerobic digestion were 2507, 3390, 2827, 3007, and 3367 L/m3 WAS (equal to 96.4, 130.4, 108.7, 115.7 and 129.5 mL/g VS; the total VS of the fermentation system was 26.0 g/L) for the control, thermal, chemical, ultrasonic, and thermochemical groups, respectively. The methane contents of all samples were approximated to 70%.
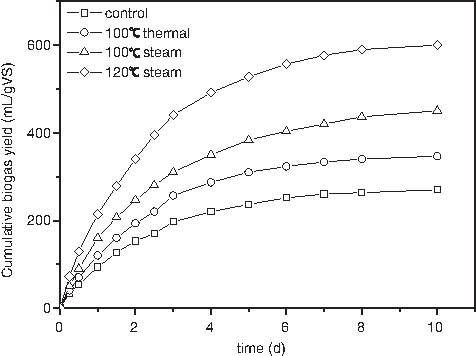
Cumulative biogas production of different pretreatment methods.

Content of CH4 in biogas of different pretreatment methods.

Cumulative methane production of different pretreatment methods.
The model of Gompertz equation was introduced as the curve of cumulative methane yield which showed a great relativity with it. The results are shown in Table 3 and Fig. 10. It was observed that the lag periods were very short (∼2 days) for all groups compared to Gurung et al. (2012), and the various pretreatments had little effect. It indicated that the bacteria adjusted to the digestion environment quickly and the organic matter was utilized immediately. The R value was larger than the general literature, which meant a much faster production of methane. However, the R value was different when the sludge was pretreated by different methods, and it increased with power.
Parameter estimation from Gompertz model for digestion reactors [control
Groups: A, control; B, common thermal pretreatment; C, 100°C steam pretreatment; D, 120°C steam pretreatment; E, anaerobic digestion with fresh samples of brown algae [used as reference value, from Gurung et al. (2012)].
Conclusions
To disintegrate the WAS flocs, reduce the sludge amount, and increase the biogas and methane yield, the application of live steam pretreatment method was investigated in this article. The purely thermal pretreatment method was applied as a comparison. Results indicated the steam pretreatment had significant influence on the disintegration of WAS. Both the temperature and time could influence the dissolution of COD. A pretreatment time of 10 min and a temperature of 120°C were determined to be the optimum condition.
The optimal energy consumption was 271 kJ/kg TS with a steam pretreatment of 120°C for 10 min. It was quite lower compared with other reported values for alternative techniques (500–5000 kJ/kg TS) because of the efficient disintegration of sludge flocs and rapid dissolution of organic matter.
The particle size of WAS decreased obviously after steam pretreatment. Many minute cavities were observed on the surface of particles, which could promote the hydrolysis of the EPS and the crude protein. The disintegration was more thorough when the pretreatment intensity was increased.
The live steam pretreatment was much more efficient and powerful than the purely thermal pretreatment and the control group. The cumulative CH4 yield was 297.7 mL/g VS for the 120°C steam group, increasing 171% and 86% compared to the control and purely thermal group, respectively. The live steam pretreatment was actually a suitable method to enhance the disruption of the sludge flocs and improve the biogas yield of WAS.
Footnotes
Acknowledgments
The authors want to express their thanks for the support from Natural Science Foundation of China (21076009), the (863) High Technology Project (2012AA021402), Program for New Century Excellent Talents in University (NCET-100212), the Project Sponsored by SRF for ROCS, SEM (LXJJ2012-001), and Guangxi Key Laboratory of Biorefinery.
Author Disclosure Statement
No competing financial interests exists.