
Abstract
Abstract
In this work, performance of an innovative in-situ passive engineered natural system to remove fluoride from stormwater and to reduce the peak stormwater flow rate was investigated for multiple rainfall events (from August 13 to October 20, 2010). Water flow was measured on site and samples were taken for fluoride analysis throughout several rain events. A mathematical model was developed and used to predict stormwater flow and fluoride concentration in the effluent of an in-situ passive treatment system consisting of roof, green courtyard basin, and an activated alumina (AA) treatment cell. This model is a combination of a mass balance and one-dimensional advection-dispersion model, which involves three components: (1) flow of water, (2) fluoride build up and wash-off on a roof, and (3) fluoride transport. For rainfall events investigated, the fluoride that had accumulated on the roof by deposition during dry weather quickly washed off during the beginning of the storm event. The green courtyard system reduced concentrations of fluoride contaminated runoff. Model and field results indicate that under conditions encountered, the AA effectively removed fluoride from stormwater to undetectable levels (<1 mg/L). Data from this study can be used to aid in determining engineering design parameters needed for scale up and economic analysis. This technology may be appropriate for a range of stormwater contaminants if the appropriate reactive media is used within the system to reduce runoff and the environmental impact of runoff associated contaminants.
Introduction
Low level fugitive emissions of fluoride are emitted from aluminum smelting buildings, or potlines, during aluminum production and can deposit on the building roofs and other impervious surfaces.‡ Fluoride releases have been classified by the U.S. Environmental Protection Agency (EPA) as a major contaminant affecting human health (Donohue et al., 2010) and can be found in stormwater near aluminum smelters in high enough concentrations that the stormwater may require treatment before discharge into receiving water bodies.
In this research, an in-situ passive engineered natural system was investigated to determine its efficiency for removing fluoride from stormwater and reducing the peak stormwater flow rate. This passive system reduces the maximum flow rate and overall volume of stormwater that needs to be treated by capturing the most contaminated runoff with subsequent runoff being diverted directly to the stormwater system, which may be economically advantageous compared to one that treats all of the runoff.
To facilitate stormwater quality control analysis, simulation models have been developed and applied to predict the quantity and quality of the urban stormwater. In these models, different approaches have been used, including multiple regression (Chichester et al., 1979), mass balance (Adrian and Sanders, 1992–1993; Pedro et al., 2010), exponential or power decay (Li, 1962; Haith, 1980; Jobson, 1996), continuous stimulation (Litwin and Donigian, 1978; Novotony et al., 1978; Srinivansan and Arnold, 1994), and kinematic wave and diffusion wave theories (Griffin et al., 1980; Steenhuis and Walter, 1980; Van Genuchten and Alves, 1982; Snyder and Woolhiser, 1985; Parr et al., 1987; Richardson and Parr, 1988; Yu et al., 1990–1991; Singh, 2002). While most urban stormwater models are used as planning models to simulate the behavior of stormwater flows and to evaluate the quantity and quality of stormwater, very few models are used as tools to facilitate the design of stormwater treatment systems. In this research, a mathematical model was developed and used to predict stormwater flows and fluoride concentrations in the runoff from an aluminum smelter roof as these are regulated by a green courtyard and treatment cell containing activated alumina (AA). The overall objective of this work is to evaluate the capability of this green infrastructure system to reduce peak flows and effluent concentrations.
Materials and Methods
An in-situ passive filtration system “green courtyard” was constructed at the edge of the roofline of an aluminum smelter facility in northern New York State in the United States. The roof area is 11 m in width and 15 m in length, while the downstream green courtyard system is 4.6 m in width and 30.5 m in length and consists of layers of top soil (clay; 0.3 m) and gravel (#67; 0.15 m) that was planted with grasses that are native to the area (Kentucky 31 fescue). The gravel bed is lined with an impervious barrier to prevent infiltration. An area of pavement 3.0 m in width was placed before the green courtyard system to prevent high intensity runoff from landing directly onto the grass, preventing erosion of the planted area (Fig. 1). The courtyard system was designed to provide a more constant flow of runoff entering the treatment stage. The overall flow path is from the roof to the courtyard and through the AA. When it rains, water draining from the roof surface, including the initial flush, which typically contains the highest concentrations of fluoride, was directed through the gravel layer into the AA treatment cell. When the courtyard is saturated, additional water, which should have low fluoride concentration, since the fluoride should be removed from the roof by the first flush, will flow overland and into the stormwater system without treatment. After the rain event is over, water in the courtyard will be lost by evapotranspiration. This configuration would allow for the treatment of the first flush water only. Inside the courtyard, the gravel and topsoil planted with grasses were designed to equalize and reduce the flow. Once runoff enters the gravel area, it could be discharged into AA treatment system or could be stored and undergo evapotranspiration between rainfall events, thus reducing the flow and providing more constant flow of runoff entering the AA system. A control site (without a green courtyard module) consisting of existing asphalt pavement with the same dimensions as the green courtyard was also constructed adjacent to the same roofline as the courtyard for comparison. This asphalt pavement was used as the control because the existing area near the aluminum smelter is paved with asphalt materials.

Illustration of the whole system.
During a rainfall event the water draining from the roof surface, including the initial flush, was directed through the gravel layer to a treatment system, which consisted of an approximately 200 L drum (58 cm diameter) filled to 50 cm with 30% fine (0.425 mm) and 70% coarse particles (2.35 mm) of AA obtained from Rio Tinto Alcan, Canada. AA is widely used to reduce fluoride concentrations in water due to its high affinity for fluoride ions and can reduce fluoride concentrations to near zero (Fawell et al., 2006). Water in excess of the storage capacity of the green courtyard will run overland directly into the stormwater system.
To evaluate the system and compare it with the control site, flow was measured and samples were taken throughout several rain events using an automated sampler (ISCO 6700) at both sites every 15 min along with daily summaries, which included the average, minimum, and maximum levels. This automated sampler contains a Doppler flow sensor and a recording rain gauge linked to it which are programmed to record rainfall, runoff and to collect samples at pre set time intervals. The U.S. EPA SPADNS method (Hach Method 8029) was used to measure fluoride concentration (Hach Company, 2007) using a spectrophotometer (HachInc, Model DR2700). Before samples were analyzed the spectrophotometer was calibrated to ensure an accuracy level of 95% or greater. The range of fluoride concentrations detectable by the test was 0.02–2.00 mg/L. When the fluoride concentrations exceeded the maximum limit of the test, the sample was diluted, and then analyzed. Multiple rainfall events in the summer and autumn of 2010 were investigated to evaluate the performance of the three modules (roof, green courtyard, and AA). Table 1 summarizes the date and number of rainfall events investigated along with rainfall depth for each rainfall event.
Model Development
A three part mathematical model was developed to predict stormwater flow and fluoride concentrations: (1) flow of water, (2) fluoride build-up and wash-off, and (3) fluoride transport. These processes were described by a set of differential equations which were solved analytically for every time step (15 min) and written in Matlab (Mathworks, Inc., 1984–2007). The model combines a mass balance with a one-dimensional advection-dispersion model. The roof, courtyard, and treatment units were modeled separately (Fig. 2) to allow for aspecific assessment of each system. Using a mass balance, effluent concentrations from the roof were first calculated, and then used as input to the green courtyard model. Similarly, effluent concentrations from the green courtyard were calculated and used as input parameters to the treatment model.
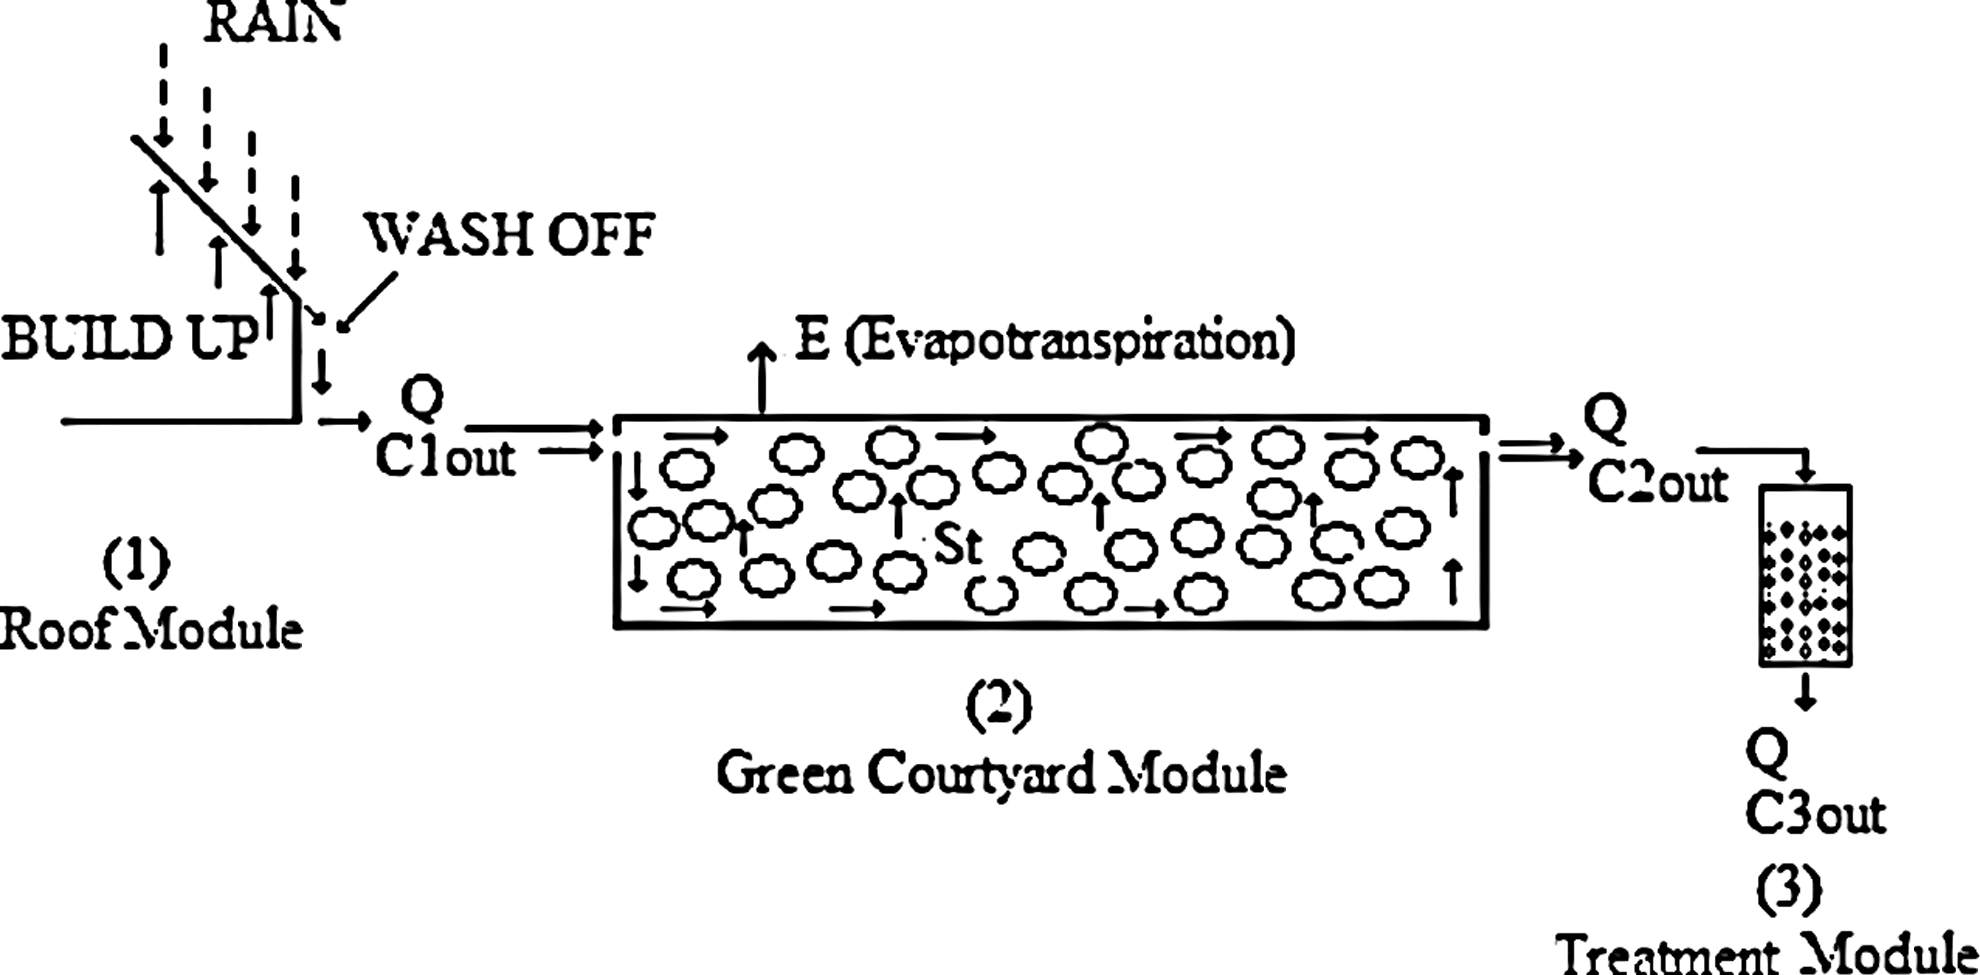
Illustration of the three system modules.
In the roof module, fluoride accumulation on the roof is a function of the build-up process during dry and rainy periods and wash-off process during rainy periods. This process can be described mathematically based on the mass balance around the roof as (accumulation=build up rate−wash of rate), which was further modeled as first order system:
where L is a build-up rate (M/L2·T), k is the wash-off coefficient (L−1), R is runoff intensity (L/T), and w is the mass accumulated on the roof (M/L2). The second term on the right hand side of the equation represents a typical wash off function (Zoppou, 2001). During dry periods (R=0, no rain), Equation (1) is reduced to dw/dt=L. Thus the mass on the roof increases linearly with time since the build-up rate (L) is constant. The mass washed off of the roof was calculated as the difference between the initial mass and the remaining mass at every time step. The effluent concentration in the water flowing off the roof (C1out) was then calculated using the mass washed off and the volume of water which was calculated from water flow data. The outputs from the roof module (water flow, mass washed off, and effluent concentration) were used as input parameters to the courtyard module. A mass balance approach on both water flow and fluoride was used around the courtyard system (Fig. 2). In this model, it was assumed that the courtyard module is completely mixed during the rainy period when there is a continuous flow of water into the system. Before rainfall events, there is space available to capture the water from the roof due to evapotranspiration between events; the amount of space depends on the length of the dry period between events. When it rains, the water draining from the roof, including the initial flush will flow into the courtyard where the water level will rise until it reaches the output point before being directed into the AA treatment cell. During this time the first flush entering the gravel layer of the green courtyard is mixed with water stored from previous events.
Mass balance on water flow
During the first rainfall event, it was assumed that the system was initially empty (no water). The mass balance on water flow during rain event is dSt/dt=Qin, while during dry period the mass balance is dSt/dt=−EA, where, St is storage of the courtyard system (L3), Qin is the flow rate into the courtyard system (L3/T), E is the evapotranspiration rate (L/T), and A is the surface area of courtyard system (L2). The direct rainfall into a courtyard system was neglected due to the fact that the infiltration rate from the top clay soil is very small (∼1 mm/h) (Diamond and Shanley, 2003). For example, for rainfall events investigated at the site from August 13 to October 20, the average rainfall intensities were 30–60 cm/day (13–25 mm/h). Giving that the area of the courtyard (140 m2) and infiltration rate of 1 mm/h, the total volume of water that can infiltrate per hour is 140 L/h, some of which would be held by soil and plants. For the roof (165 m2) with that rain intensity (13–25 mm/h), the total volume collected and directed to the courtyard system is 2145–4125 L/h. This means that direct rainfall onto the courtyard represents less than 3% of the water flow from the roof and thereby does not significantly influence the results.
Mass balance on the fluoride
The general equation that describes the change in mass inside the courtyard system is
where M is the mass of fluoride inside the courtyard system (M), Cin is the fluoride concentration entering courtyard system (M/L3), which is equal to the fluoride concentration leaving the roof (Cin=C1out), Qout is the flow rate out of the courtyard module (L3/T), and C2out is the fluoride concentration leaving courtyard module (M/L3).
Mass balance during rainy periods
The fluoride mass balance during a rain event could follow one of two scenarios. The first scenario was applied when the storage (St; volume of the water in the green courtyard system) is less than the total volume of the system (Vt [L3]; no flow out of the green courtyard [Qout=0]). In this case dM/dt=QinCin. As the storage changes with time, Equation (2) becomes
where C2 is the fluoride concentration inside the courtyard module (M/L3) when there is no outflow of water (St<Vt). In this case, the storage changes with time due to inflow only (dSt/dt=Qin). The second scenario was applied when the courtyard was full of water or St=Vt., and such that C2out and C2 are equal, assuming that the courtyard is completely mixed. The mass balance equation is
In this case, there is no change in the volume and Qin=Qout which yields
Mass balance during dry periods (no rain)
During dry periods, water is lost from the green courtyard due to evapotranspiration without a change in fluoride mass (dM/dt=0). However, there is a change in both storage and concentration with time, which yields
where dSt/dt=−EA, which yields
For the treatment module, fluoride transport through AA was described by an advection-dispersion equation with sorption using a partial differential equation that assumes no mass transfer limitations within the treatment cell
where D is the dispersion coefficient (L2/T), v is the pore water velocity (L/T), C3 is the concentration leaving the AA drum (M/L3), Cs is the concentration adsorbed to the filter media (M/M), and Kd is the linear equilibrium adsorption coefficient (L3/M). Equation 9 suggests a linear relationship between the liquid and solid phase concentrations of fluoride. Although the fluoride isotherm with AA followed a nonlinear relationship, it was found that at aqueous concentrations below 20 mg/L, the difference between a linear extrapolation and the nonlinear isotherm was <10%.‡
Model parameters
The main model parameters are runoff intensity (R), build up rate of fluoride on the roof (L) and wash-off coefficient (k) for the roof module, flow rate (Qin), and evapotranspiration rate (E) for the courtyard module, pore water velocity (v), and equilibrium adsorption coefficient (Kd) for the AA module. Runoff intensities (R) were measured at the site during rainfall events. The buildup rate (L; 0.01 mg/[cm2·h]) was calculated using a mass balance approach on the aluminum production and emission measurements supplied by Alcoa (personal communication, June 8, 2010). This build-up rate was assumed to be constant due to a constant aluminum production rate. The flow rate into the courtyard module (Qin) and pore water velocity (v) were obtained from the runoff data from the roof module. Values of the evapotranspiration rate (E) at the site were obtained for different months (National Weather Service, 2010). Several researchers have shown that the ET from green roofs is not well predicted using published climate data (Kasmin et al., 2010; Voyde et al., 2010). Therefore, measurement of soil moisture content at the site would provide more reliable data about ET rates. Due to the lack of such measurements, published average monthly values were used as an input parameter to this model. However, using a range of representative ET rates resulted in changes in fluoride concentrations leaving the courtyard of <7%. The equilibrium linear adsorption coefficient at low concentration (Kd) (1.6 cm3/mg) was obtained experimentally from batch experiments.‡ Since the wash-off coefficient is site-specific, the wash-off coefficient (k; 0.7 cm−1) was obtained by the best fit between the predicted breakthrough curve and experimental data measured at the site during the first rainfall event (June 22–24) using the derivative free method DIRECT (a global optimization algorithm) (Finkel, 2005) to compute the nonlinear least-squares error (J) that minimizes the error between the computed and measured values (J=0.004; Fig. 3A). The empirical value of the wash-off coefficient was then verified for the second rainfall event (Fig. 3B). This value was then used to simulate the remaining rainfall events observed at the site at different times.
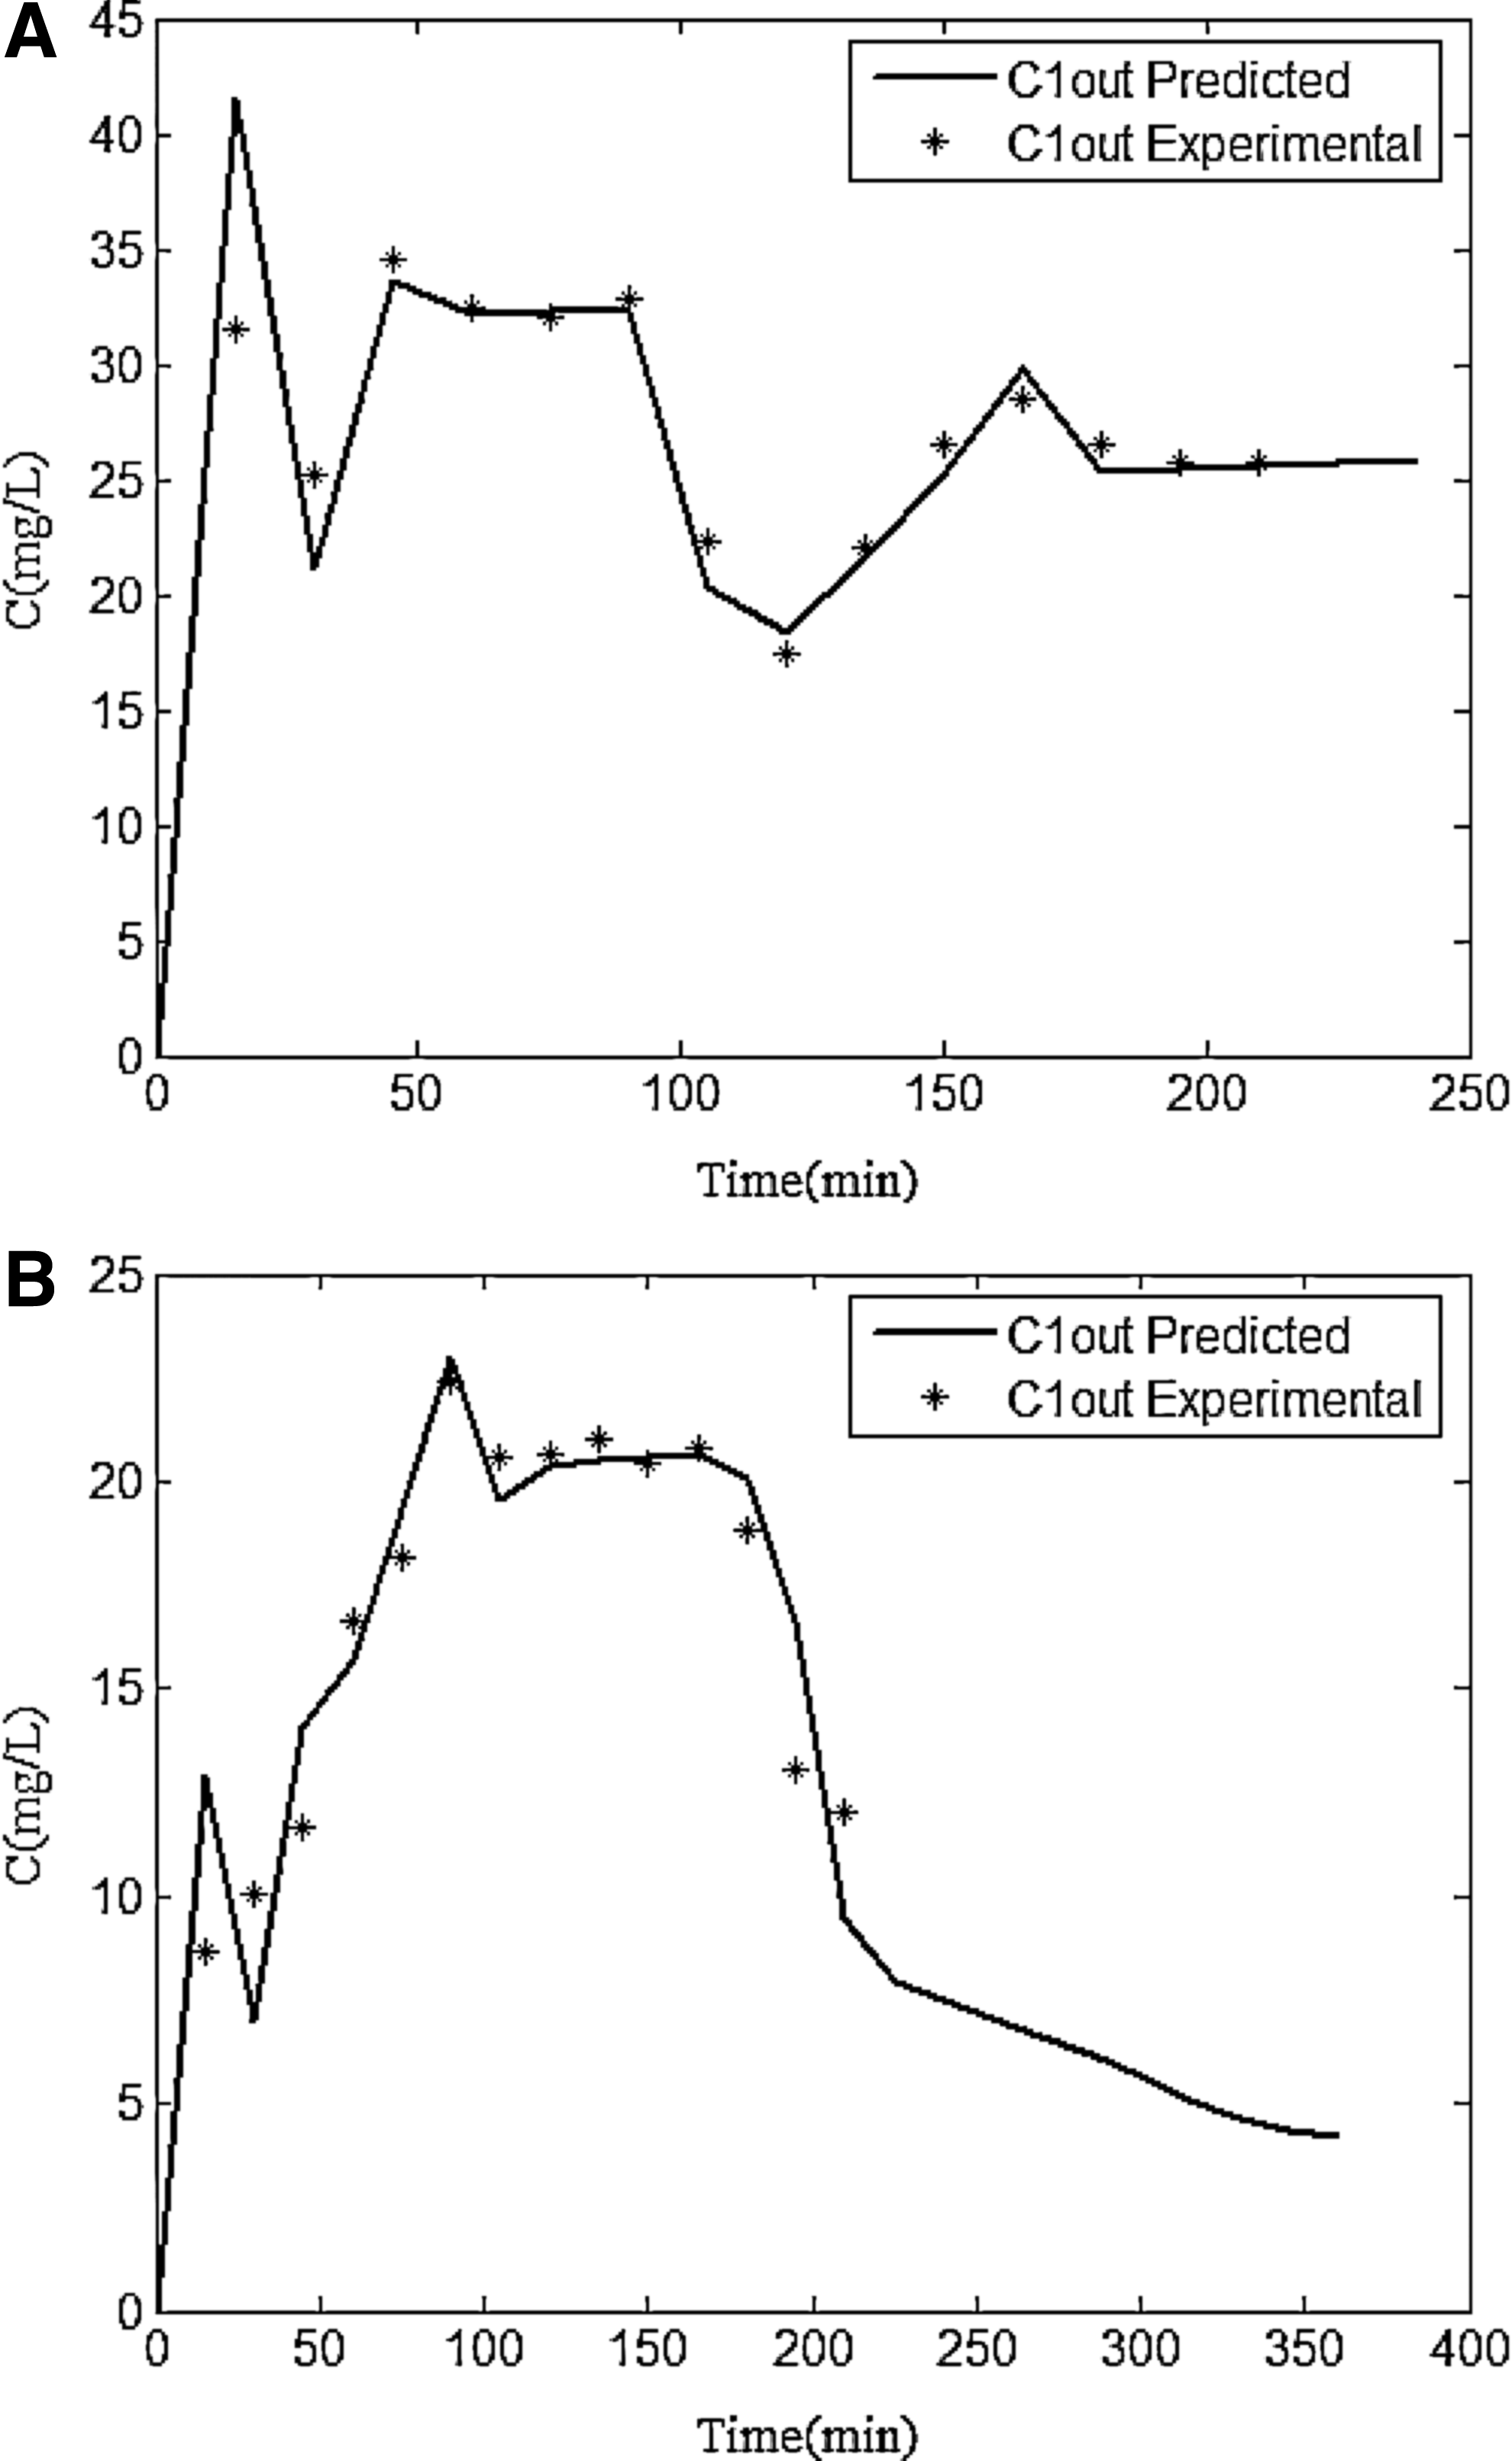
Predicted effluent concentration along with experimental measurements of fluoride from the roof (C1out) for first rainfall event
Results and Discussion
The rainfall events investigated to evaluate the performance of three modules (roof, green courtyard, and AA) are presented in Table 1. The model was used to determine the wash-off coefficient using two rain events at the beginning of the 2010 field season. For the remaining rain events, model predictions of effluent concentrations from the three model components were compared to measurements without adjustment of any constants to determine the model efficacy. In addition, the effect of the model parameters rain intensity, rain frequency, and length of dry period were evaluated for their impacts on effluent concentrations.
The flows through both the green courtyard and control sites for rainfall events from August 13 to October 20, 2010 are presented in Fig. 4A. The peak flow through the Green Courtyard was always 30–70% less than the peak flow through the control site for all the events. Additionally, there was a lag in the flow from the courtyard system compared to the control site. Due to unmitigated direct runoff generation from the impervious roof surface, the control flow spikes quickly after rain began to fall, yet the Green Courtyard effluent was delayed compared to the control, as the water had to pass through the pervious courtyard area first. This delay varies from one rain event to another depending on rainfall intensity and the duration of the dry period between events. A longer dry period allows for greater loss of water by ET resulting in additional storage capacity for the next rainfall event resulting in more delay. This is particularly true during summer months (May to September) when the temperature is high.
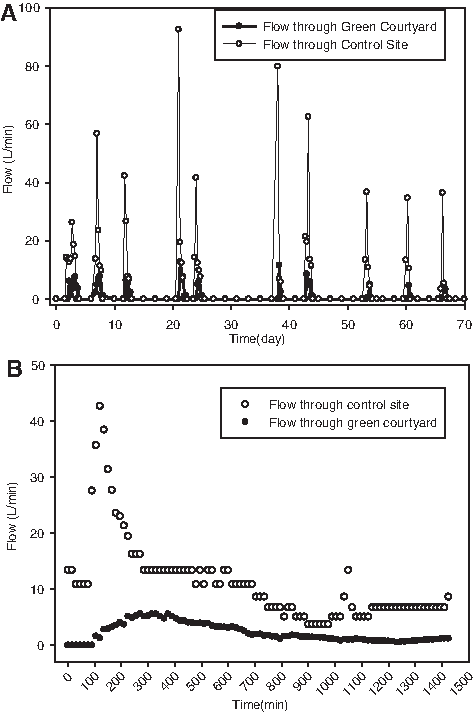
Flow through both green courtyard and control sites for rainfall events measured at the site from August 13 to October 20, 2010,
A comparison of the flows through the Green Courtyard and control site during a single rain event measured at the site on October 3, 2010, is shown in Fig. 4B. This rainfall event was comparable to a 1 year design storm for 1 day rainfall event in the same area (NRCC, 2010–2013). Figure 4B shows that the flow through the Green Courtyard was about 50% smaller and more consistent than for the control site. For this rainfall event, it took about 90 min for water to flow out from the Green Courtyard. If no water has been stored from previous events (if the courtyard was empty) it would need at least 240 min (based on flow data and total volume of the Green Courtyard) to totally fill the Green Courtyard. This suggests that water has been stored from previous rainfall events. Similar analysis conducted for every single rainfall event showed the same trend of water being stored from previous events.
Field measurements of fluoride concentration showed that even without AA treatment, the courtyard system was able to reduce effluent fluoride concentrations leaving the green courtyard relative to the control site by 50–75% (Fig. 5). This reduction in fluoride concentration may be attributed in part to the dilution process where the first flush entering the gravel layer of the green courtyard is mixed with water stored from previous events that is lower in concentration. The next step in the process, AA, effectively removed fluoride to an undetectable level (<1.0 mg/L; Fig. 5).
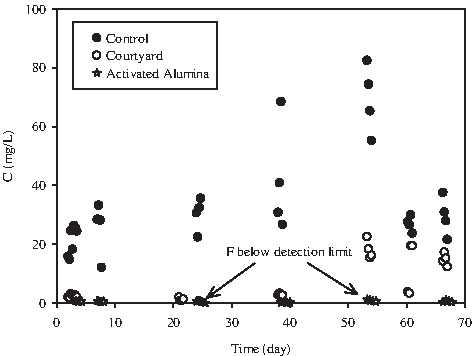
Fluoride concentration in control and courtyard area (before activated alumina treatment) measured from August 13 to October 20, 2010.
For rainfall events measured at the site from August 13 to October 20, 2010, model predictions of fluoride concentrations exiting the roof and green courtyard compared very well with field measurements (Fig. 6). The green courtyard reduced both average and peak fluoride concentrations by 50–75% which is attributed to the dilution process discussed above. This agreement between predicted and measured results (J=0.007) supports our assumption of complete mixing in the courtyard where the initial flush (with higher concentration) and water stored from the previous event (with lower concentration) are mixed. For each single rain event, the peak concentration for green courtyard is lower compared with the roof effluent during the first flush (Fig. 6). Effluent concentration from the roof varied significantly with the highest concentration occurring during the middle and the end of simulated time (30–80 mg/L) and the lowest at the beginning of simulated time (10–30 mg/L; Fig. 6). These concentrations were directly related to the rain frequency and length of the dry period before the rain event. For example, during the long dry period during the middle of simulated time (from day 25 to 38; Fig. 7A) fluoride accumulated to higher quantities on the roof and was flushed off by the first rain event after this dry period resulting in the highest quantity leaving the roof (∼5.1 kg; Fig. 7B). At the beginning of the simulation, short dry periods and frequent rain events (Fig. 7A) did not allow fluoride to accumulate substantially on the roof resulting in lower modeled effluent quantities (∼0.5 kg; Fig. 7B). Although higher quantities were flushed off during the middle of simulated time (day 38) than that during the end of simulated time (days 54, 60; Fig. 7B), effluent concentration at day 38 was lower (Fig. 6). This is mainly attributed to the higher rain intensity at day 38 (Fig. 7A). Higher rainfall intensity increases the overall volume of runoff water and correspondingly decreases its concentration.

Experimental and modeled effluent fluoride concentration from the roof (C1out) and from green courtyard (C2out) measured from August 13 to October 20, 2010.

Measured rainfall intensities
Due to the fact that the resolution in Figs. 6 and 7 is insufficient for examining the fluoride concentration within the time scale of individual events, data for two typical rainfall events (October 1–4, 2010) were examined more closely (Fig. 8) using the model. These two rainfall events were comparable to a 1 year design storm for 2 day rain events in the same area (NRCC, 2010–2013). The model was used here to verify previous observations and to examine the effect of parameters, such as rain intensity, rain frequency, length of dry period, wash off coefficient, and evapotranspiration on fluoride concentrations. In these simulations, it was assumed that the roof initially had no fluoride accumulation (time zero) but did accumulate fluoride after time zero. The mass of fluoride on the roof increases linearly during dry periods and decreases very rapidly during rainfall (Fig. 8A), causing an increase in the mass washed off the roof (Fig. 8B-i). Although the runoff rate was greater during the latter part of the first storm (Fig. 8B-ii), the stored mass of fluoride available for wash-off was almost depleted, and consequently the mass of fluoride in the roof runoff declined rapidly (Fig. 8B-i). At the end of the first storm event, when the runoff rate is very small (Fig. 8B-ii), a slight increase in the mass remaining on the roof is predicted (Fig. 8A), which indicates that accumulation is greater than wash-off during that period because the model assumes that the build up process is continuous during both dry and rainy periods since aluminum production is a continuous process.

Wash-off process showing the mass remained on the roof
The wash-off process is significantly affected by the rainfall intensity as is apparent during the second rainfall event. Although a slight increase in the mass washed off of the roof is observed at the beginning of the storm event, a significant increase in the mass washed off can be seen in the middle of the storm event (Fig. 8B-i) where the rainfall intensity is the highest (Fig. 8B-ii). The wash-off coefficient is another important parameter that can affect the transport of fluoride from the roof. Figure 9 shows the mass remaining on the roof assuming different wash-off coefficients (0.25–1.0 cm−1) for rain events measured at the site from October 1–4, 2010. Increasing the wash-off coefficient increases the mass washed off from the roof. The greater the wash-off coefficient, the smaller the required volume of runoff to achieve the same loading.
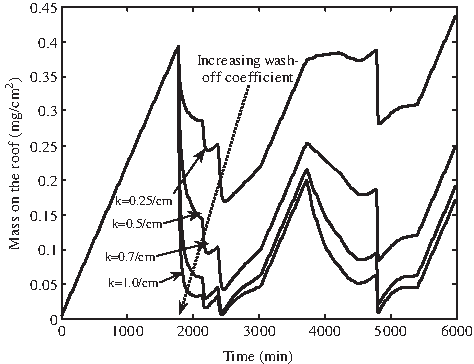
Mass remaining on the roof as a function of the wash-off coefficient for rain events measured from October 1–4, 2010.
For rainfall events from October 1–4, 2010, model predictions of fluoride concentrations exiting the roof and green courtyard compared very well with field measurements (J=0.002; Fig. 10). The effluent concentration from the courtyard system is reduced by >50% (compared with the influent concentration) due to dilution when the first flush entering the courtyard system is higher in concentration than the later flow (stored in the courtyard from previous rain event). Also, due to the storage effect the effluent concentration peak is delayed relative to the roof run-off peak because no water flows out of the system until the system is completely filled (Fig. 10). Thus, the green courtyard reduces the peak flow, which would result in less flooding and the need for smaller stormwater collection systems. Simulation and field results show that under the site conditions evaluated, effluent fluoride concentrations from AA were consistently <1.0 mg/L (Fig. 10).

Measured and modeled effluent concentrations from the three systems, roof (C1out), green courtyard (C2out), and activated alumina (C3out) for rain events measured from October 1–4, 2010.
Conclusions
A mathematical model was developed and applied as an operational tool to predict the stormwater flow and fluoride concentrations in the run-off from an aluminum smelter roof, through the green courtyard, and in the effluent from an AA system allowing for an effective assessment of the pollution-control system. For the two rainfall events investigated, the fluoride that accumulated over time on the roof in dry weather quickly washed off during the beginning of the storm event. Although the runoff rate may be greater during the remainder of the storm duration, the stored mass of fluoride available for wash-off was nearly depleted, and consequently the mass of fluoride declined rapidly. Determining the time duration of rainfall event carrying the highest concentration of contaminant provides an opportunity for stormwater managers and engineers to control water pollution in an economical and efficient way. Green courtyard systems can capture the most polluted runoff reducing the total volume of runoff to be treated with AA which may reduce the cost of operation. Model results also showed that, under the site conditions, the AA can remove fluoride from an influent concentration range of 10–50 mg/L in stormwater to an undetectable level (<1.0 mg/L). Further field work must be conducted to have a more complete picture this system's effectiveness. As published average monthly values of ET may not be appropriate inputs, measurement of soil moisture content in the site would provide more reliable data about ET rates. Additionally, AA column experiments would need to be conducted under different loading rates to study the effect of loading rate on treatment efficiency. These experiments are ongoing.
Since run-off is produced at all industrial sites, this technology may be appropriate at many sites worldwide to reduce runoff and the environmental impact of the contaminants. In addition, it may be appropriate for a range of stormwater contaminants if the appropriate reactive media is used within the system.
Footnotes
Acknowledgments
The authors gratefully acknowledge the financial support of the New York State Pollution Prevention Institute at the Rochester Institute of Technology and ALCOA Inc. for funding and assisting in the field study. Special thanks as well to Tory Boyd and Maura Trimble for help with the field sampling.
Disclosure Statement
No competing financial interests exist.
‡
Boyd, V. (2010, unpublished). Passive filtration and retention of stormwater runoff from an alumina smelter [Master's thesis]. Potsdam, NY: Clarkson University.
‡
Boyd (2010, unpublished).