
Abstract
Abstract
Effects of various electrodes and prefiltration to minimize disinfection byproducts (DBPs) in electrochemical water disinfection was evaluated. The target microorganism, Escherichia coli O157:H7, was effectively inactivated even applying a solar-charged storage battery for the electrolysis process. Extent of microbial inactivation decreased with lower water temperature and higher pH in the free chlorine disinfection system. The RuO2/Ti electrode was most efficient because it produced the lowest concentration of chlorate and the highest generation of free chlorine. Prefiltration using a ceramic filter inhibited formation of halogenated DBPs because it removed precursors of DBPs. For safe point-of-use water treatment, the use of a hybrid prefiltration stage with the electrolysis system is strongly recommended to reduce risks from DBPs. The system is particularly suited to use in developing regions.
Introduction
O
Electrochemical water purification technology has been used in various stages of water treatment, such as in coagulation and disinfection processes (Chen, 2004). Recently, many different dimensionally stable anodes, such as platinum (Pt), iridium (Ir), and ruthenium (Ru) supported by titanium (Ti), have been applied to the electrochemical oxidation process in water treatment because of their versatile electrocatalytic properties and stability (Panizza and Cerisola, 2009). RuO2-coated electrodes are particularly attractive because of their remarkable electrocatalytic properties, whereas IrO2 are more stable and have a longer service life (Hoseinieh et al., 2010). In water treatment, the main purpose of electrolysis is in situ production of free chlorine species (HOCl/OCl−), which have a universal disinfecting ability. During electrolysis of natural water that contains a moderate amount of chloride ions (Cl−), hypochlorous acid (HOCl) and hypochlorite ions (OCl−) are formed as a result of the following Reactions (1)–(3) (Viswanathan and Tilak, 1984):
The most commonly used model for the inactivation of microorganisms by disinfectants such as HOCl/OCl− was derived from the work of Chick (1908) and Watson (1908). The model equation is given as follows:
where N is the number of microorganisms remaining at time T (colony-forming units [CFU]/mL), N0 is the initial number of microorganisms (CFU/mL), C is the disinfectant concentration, and k and n are empirical constants. The CT values (the disinfectant concentration, C [mg/L], multiplied by the exposure time, T [min]) can then be beneficially used in disinfection practice to achieve target inactivation objectives (U.S. EPA, 1991).
The electrolysis provides a simple means of producing free chlorine, and the required equipment is easy to install and operate, making it appropriate for use in developing countries. However, as this electrochemical technology requires electrical energy, off-grid energy generation or some other method of power supply is needed for practical application in regions where the grid power supply is unreliable. Photovoltaic cells are capable of directly converting sunlight into electricity, and are a popular source of alternative energy connected with storage batteries (Deshmukh and Deshmukh, 2008). The use of solar energy has many advantages because it is renewable and nonpolluting. There is another drawback of water electrolysis: the formation of halogenated organic by-products such as THMs and HAAs, and hazardous inorganic by-products such as chlorate.
Thus, this study evaluated the efficiency of disinfection using a solar-charged storage battery and investigated the effect of various electrodes and prefiltration to minimize the DBPs in the electrochemical water disinfection system.
Materials and Methods
Preparation of experimental samples
The raw water used in this study was synthetic water using distilled deionized water containing humic acid (10 mg/L; Sigma-Aldrich) and kaolin (30 mg/L; RC-15) to simulate the NOM and inorganic particles, respectively. The humic acid used in this study was not sodium salt for making a condition also with insoluble NOM. Filtered water samples were prepared by passing them through a type of ceramic pottery water filter (0.2–3.0 μm pore size, silver impregnated ceramic, 10 L capacity) that is widely used in Cambodia as point-of-use filters (obtained from the Resource Development International Cambodia [RDIC]). The mean Cl− concentration in the natural waters of various countries was reported to range from 5 to 250 mg/L (WHO, 1978; Gelb and Anderson, 1981; Brooker and Johnson, 1984; Morales, 1987; Bhawan, 2008). Therefore, the initial Cl− concentrations in the experimental samples were adjusted to 50 and 100 mg/L by the addition of pure sodium chloride (NaCl; Sigma-Aldrich) not only to evaluate the electrochemical system distinctly, but also to simulate the Cl− level in natural water. The pH values were adjusted to 5 or 10 in the pH effect experiment of disinfection and adjusted to 7 in the various electrodes effect experiment with 1 mM of phosphate buffer.
Electrochemical apparatus and procedures
Experiments were performed in a 300-mL Pyrex batch reactor equipped with two Pt/Ti grid-shaped undivided cells (30 mm×30 mm, 2 mm gap) from Dolki Korea, Ltd. Electrical power was supplied from a storage battery (Shuangjing Battery, 6-DZM-10) with a capacity of 10 V and 10 A after charging for 2 h. To control the battery output, a DC–DC converter module (Hanjin Data) was set at a constant voltage (10 V). The applied current (∼0.3–0.5 A) depended on each experimental condition, such as the Cl− concentration, temperature, and pH value. The charging system used in this study was a solar panel connected to a controller (SolarCenter).
The Pt/Ti electrode was compared with the other electrodes, IrO2/Ti and RuO2/Ti (Samsung DSA), which were also grid-shaped undivided cells (30 mm×30 mm, 2 mm gap). In this experiment, electric power was supplied using a DC power supply (ODA Technology) with a constant current at 0.5 and 1.5 A to compare the three electrodes accurately. Figure 1 shows a schematic diagram of the electrolysis reactor and electrodes used in this study. All experiments were performed in replicate, and the data shown herein represent an average of the two replicates.

Schematic diagram of the electrolysis system.
Preparation and analysis of microorganisms
E. coli O157:H7, the target microorganism used in this study (ATCC 43894), was inoculated into the Luria-Bertani medium (BD Co.) and incubated in a shaking incubator at 200 rpm for 12 h at 37°C. After centrifugation of the suspension, the concentrate was washed three times with phosphate-buffered saline. The final concentration of E. coli in the suspension (the water sample filtered by the RDIC ceramic filter) used for the experiment was 8.9×10³ CFU/mL. A 1-mL sample was collected at the sampling time and the residual-free chlorine was quenched with 0.02 mL of 0.1 M Na2S2O3. The remaining cells in the reactor were assayed using the spread plate method with desoxycholate agar (BD Co.), and the E. coli count was represented as CFU/mL.
Analytical methods
Free chlorine was measured using the N,N-diethyl-p-phenylenediamine (DPD) method with a DR/2500 spectrophotometer (Hach Co.). The total THMs were determined by a gas chromatograph/mass spectrometer (GC/MS; Varian) equipped with a purge-and-trap pretreatment device. The HAAs were determined by a GC/electron capture detector (Varian) after derivatization. The chlorate (ClO3−) was determined by a single-column ion chromatograph (Metrohm) equipped with a Metrosep A Supp 5, 4.0 mm×250 mm (Metrohm) separation column. Several other parameters, including the dissolved organic carbon (DOC) content (TOC analyzer; Shimadzu), specific ultraviolet (UV) absorbance (SUVA254 at 254 nm wavelength), pH (pH meter; Thermo Scientific), conductivity, total dissolved solid (TDS) content (Cond TDS meter; Thermo Scientific), and suspended solid (SS) content and color were measured using standard methods (APHA/AWWA/WEF, 2005). It is generally accepted that the absorbance of natural waters at UV wavelengths around 250 nm is caused primarily by aromatic structures (Korshin et al., 1997). The SUVA is the ratio of UV light absorbance of wavelength, (usually 254 nm) to the concentration of DOC in the water, so that this parameter is generally used for analytical methods of aromatic compounds.
Results and Discussion
Prefiltration using the RDIC ceramic filter
Water quality characteristics of the synthetic raw water and the filtered water sample used in this study are shown in Table 1. Comparing the change in water characteristics before and after filtration, ∼93% of turbidity was removed by passing the water through the ceramic filter, and the SS content was completely removed by the rejection of kaolin particles in the experimental sample. Conductivity, a key parameter affecting electrochemical reactions (Bard and Faulkner, 2001), was not significantly changed by filtration. Although 32% of DOC was partially removed by filtration, there was a significant reduction of color-causing compounds and the SUVA254 value, which are used as indicators of humic acid and aromatic compounds, which can be precursors of DBPs during electrochemical reactions (Karanfil et al., 2002). Even though these parameters such as DOC, color, and SUVA254 were measured just after a 0.45-μm membrane filtration (APHA/AWWA/WEF, 2005), the reason why these values decreased by passing through the ceramic filter was its smaller pore size and silver impregnated material. Consequently, filtration of water through the RDIC ceramic filter seems to be a viable pretreatment option before the electrochemical process.
Synthetic raw sample: [KL]0=30 mg/L, [HA]0=10 mg/L, [Cl−]0=100 mg/L.
KL, kaolin; HA, humic acid; Cl−, chloride ions; DOC, dissolved organic carbon; SUVA, specific ultraviolet absorbance; TDS, total dissolved solid; SS, suspended solid.
Formation of free chlorine using electrolysis
Figure 2a compares the free chlorine formation capability during electrolysis from the two power sources (DC power supply and solar-charged battery system) for the same water matrix ([Cl−]0=100 mg/L, 25°C) and applied voltage of 10 V. As seen in Fig. 2a, the free chlorine formation with the solar-charged storage battery was not significantly different from that with the DC power supply. The significance probability (p-value) from the Friedman test (F-test) was 0.953. This implies that a solar storage battery can supply the constant electrical current required to power the electrolysis system and achieve chlorine production.

Formation of free chlorine in the electrolysis process:
Figure 2b shows the effects of the initial Cl− concentration on the formation of free chlorine. The free chlorine formation increased linearly with increasing operating time since a sufficient Cl− concentration existed. With an increase of Cl− from 50 to 100 mg/L, the rate of chlorine production increased approximately twofold (0.0588 mg/[L·min] at 50 mg/L of Cl−; 0.1189 mg/[L·min] at 100 mg/L of Cl−). The formation of free chlorine during electrolysis was compared at water temperatures of 13°C and 25°C (Fig. 3). As seen in Fig. 3, the formation of chlorine was not affected by the temperature difference (p-value from F-test=0.989). These results indicate that, for an electrolysis system with the same applied voltage conditions, chlorine production is dependent on the Cl− concentration included in an electrolyte.
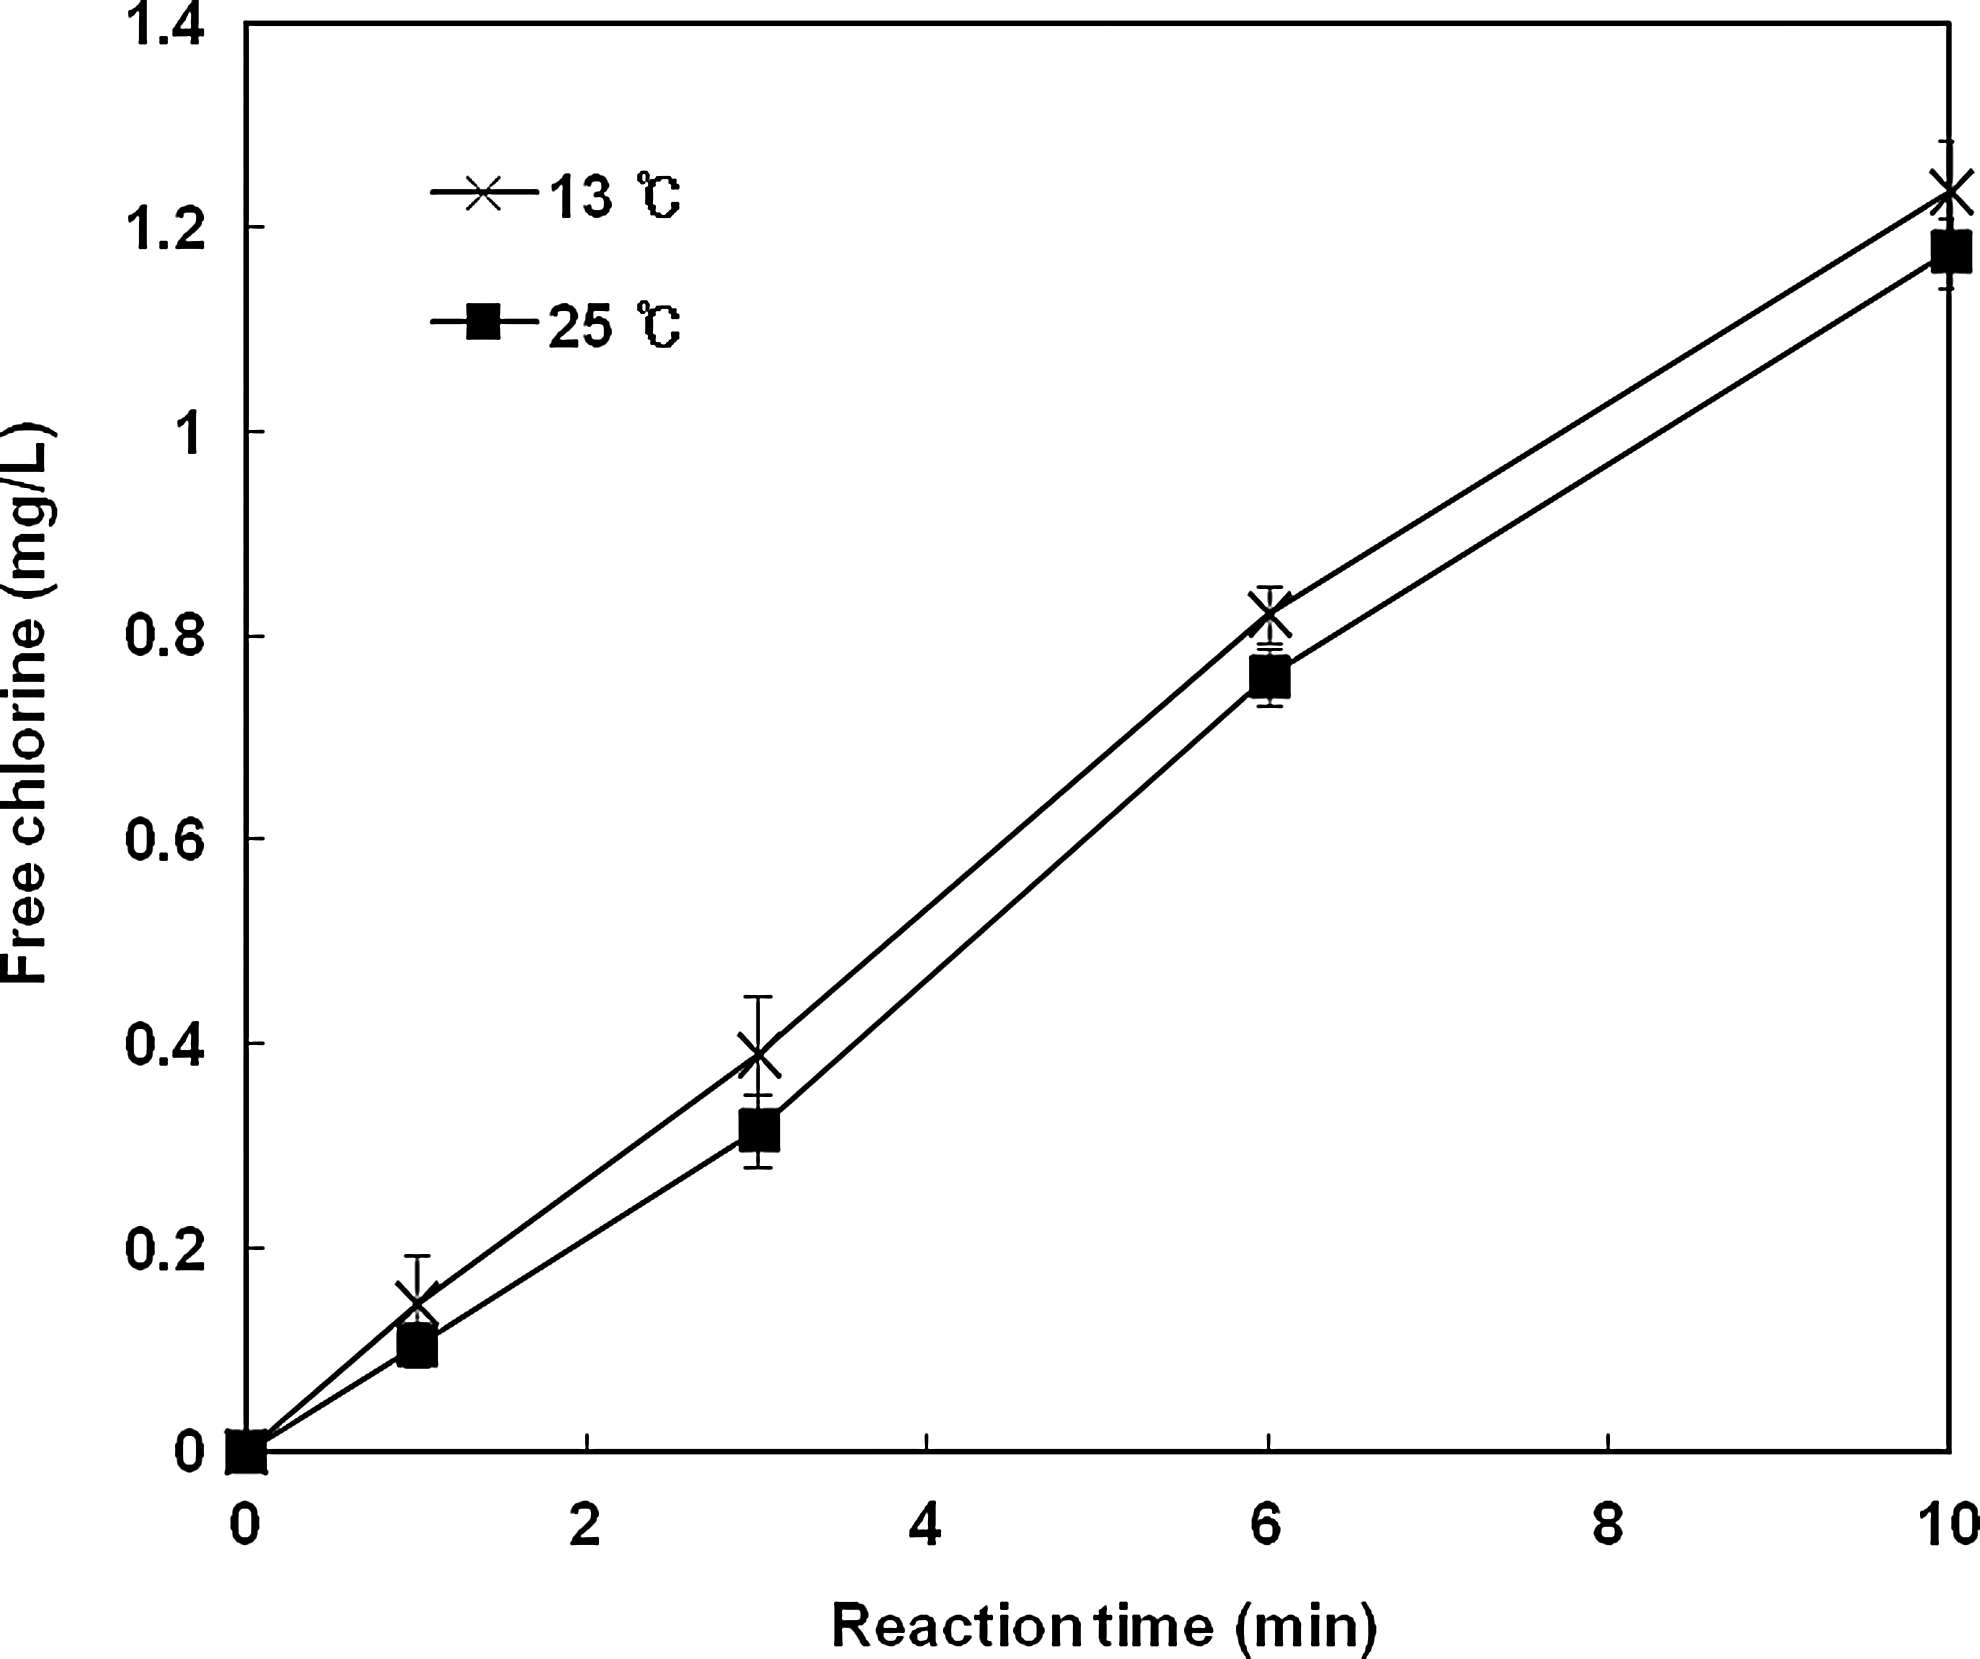
Effect of temperature on formation of free chlorine ([Cl−]0=100 mg/L, pH 7.2, applied voltage=10 V, electrode=Pt/Ti, water sample=prefiltered water).
Disinfection efficiency
According to a previous study, the RDIC ceramic water filters are known to effectively reduce the number of bacteria, protozoa, and helminths (Brown and Sobsey, 2006). Our study also found that ∼3-log E. coli O157:H7 were removed following ceramic filtration (data not shown). Even given the substantial reduction in the microorganism concentration after filtration, caution is required because bacterial numbers could recover after inactivation due to the invasion of cells by contamination, resuscitation, and regrowth (LeChevallier et al., 1996) in storage. Therefore, the electrolysis process for disinfection was examined after the ceramic prefiltration. The filtered water sample was spiked with E. coli (8.9×10³ CFU/mL) before electrolysis.
Table 2 lists the CT values of free chlorine calculated from the data shown in Figs. 1 and 2. Figure 4 shows the extent of inactivation of E. coli O157:H7 during the electrolysis process. As shown in the CT values (Table 2), the extent of inactivation increased with the initial Cl− concentration under the same temperature conditions. Even though the CT value was slightly higher at 13°C than at 25°C in case of a 100-mg/L Cl−, the extent of inactivation of E. coli O157:H7 decreased by ∼1.2-log (93.7%) during 0.5 min of electrolysis. The extent of inactivation decreased with decreasing temperatures because microorganisms are highly affected by the water temperature (Larson et al., 2003). It is well known that inactivation of microorganisms is slower at a lower temperature, when the chlorine disinfectant is applied. This is because the metabolism of the microorganism responds more slowly to chlorine at lower temperatures (Cho et al., 2004).
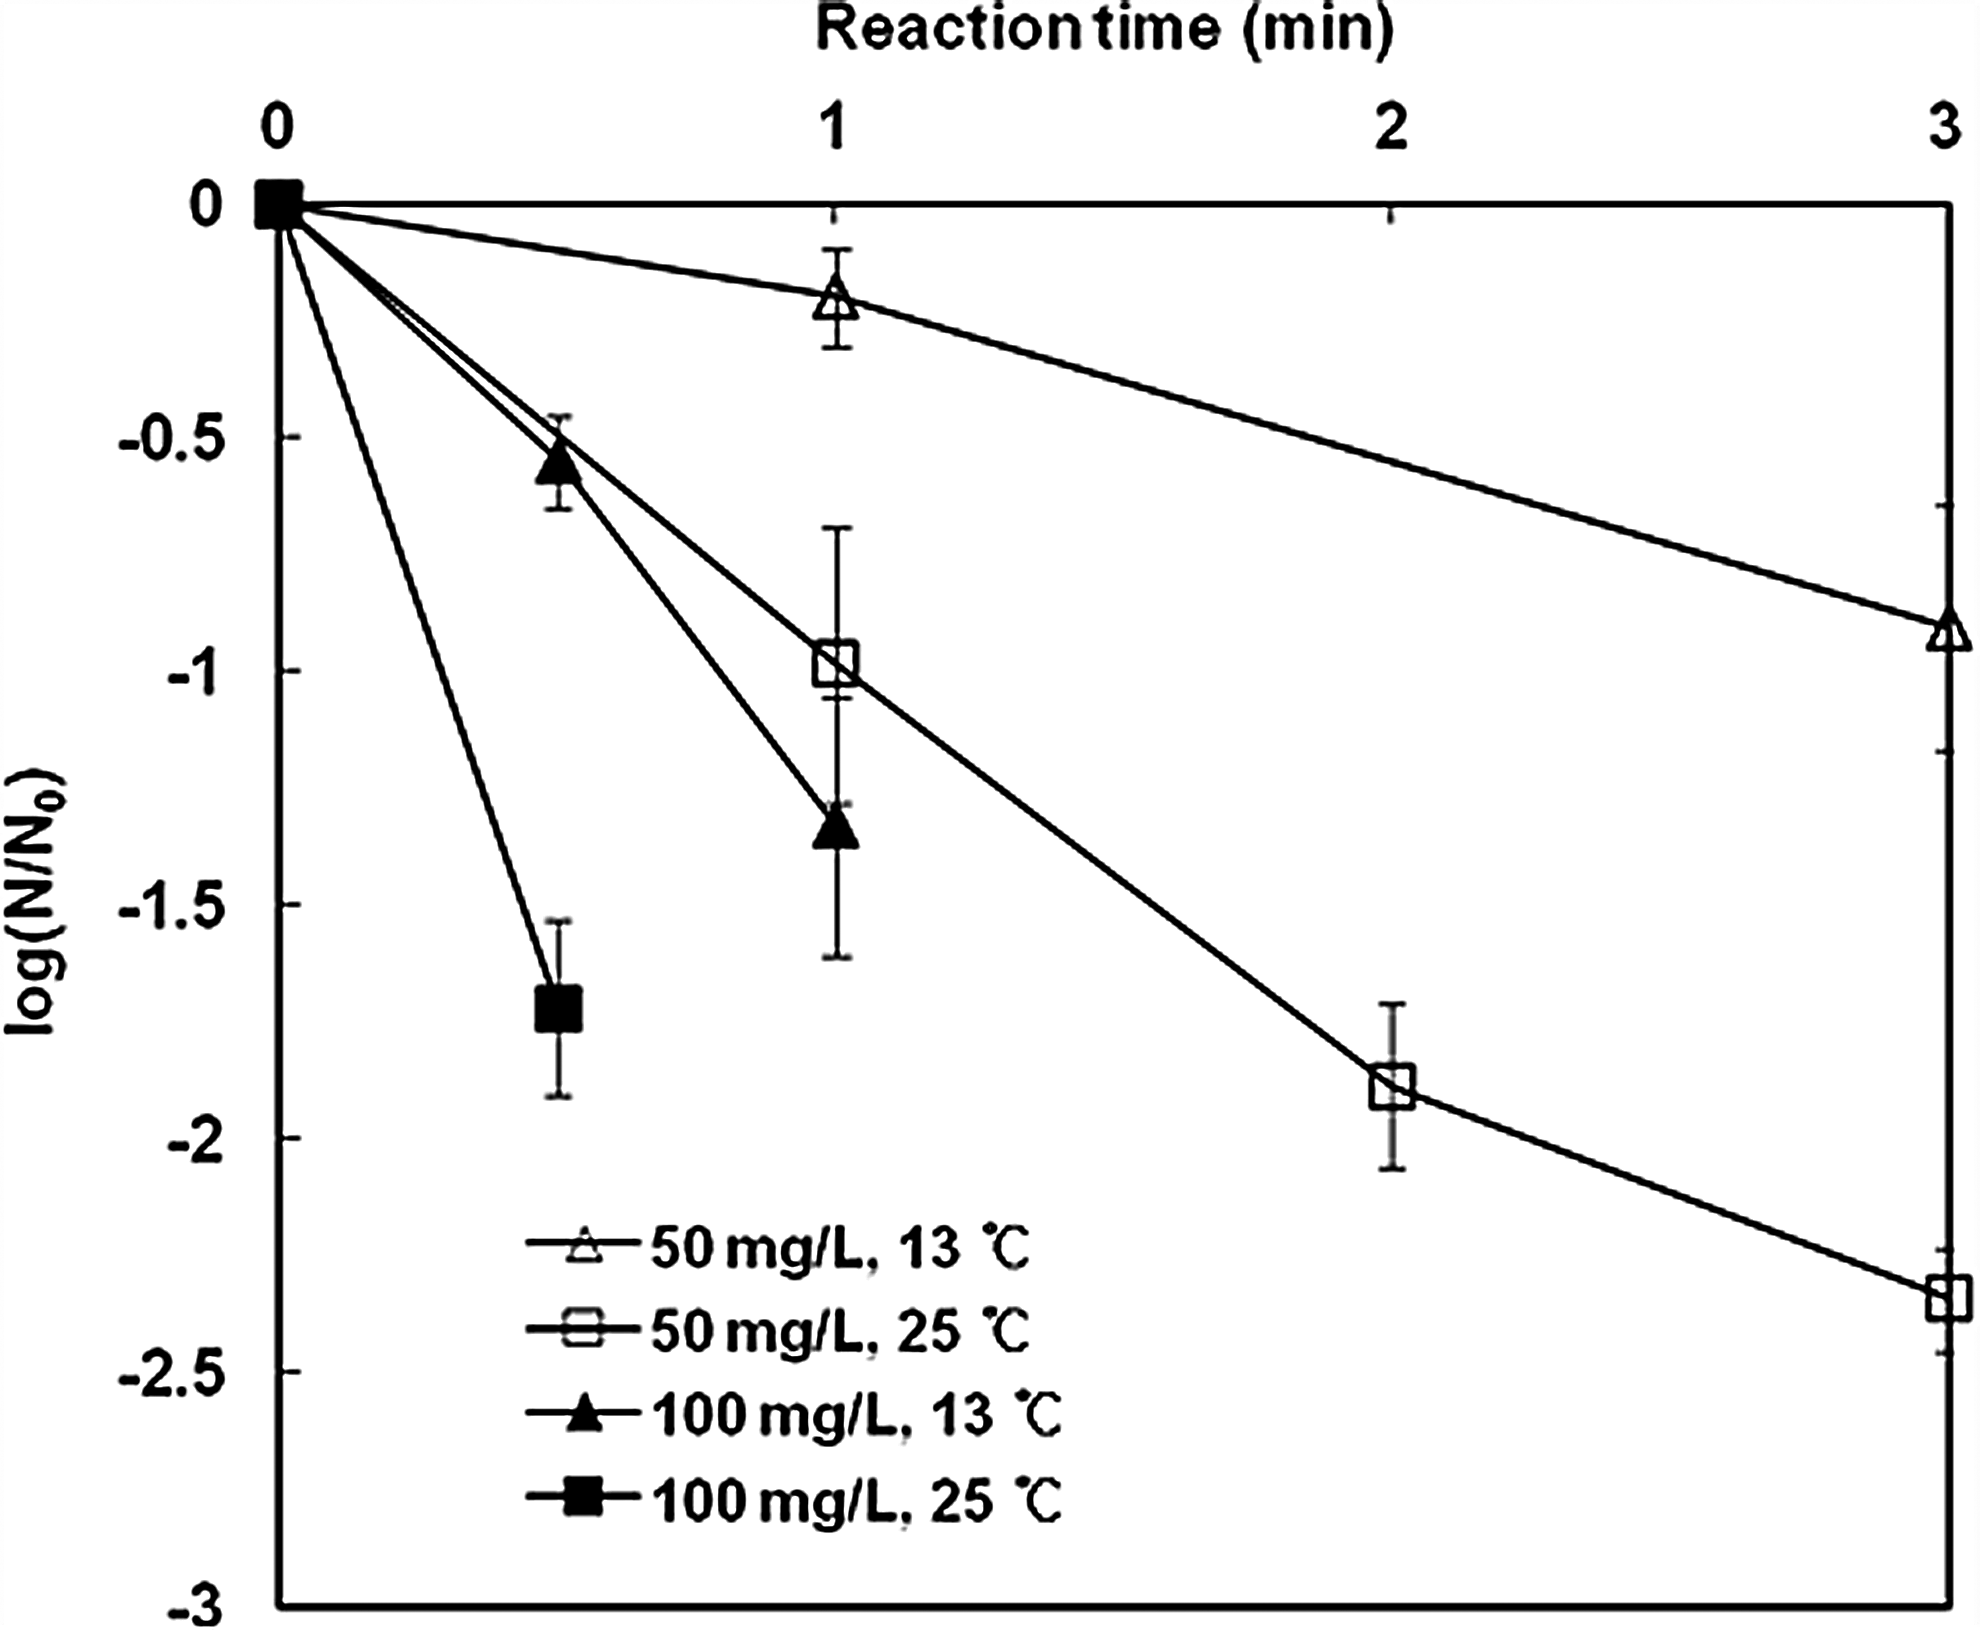
Inactivation of Escherichia coli O157:H7 by electrolysis ([Cl−]0=50 and 100 mg/L, pH 7.2, temperature=13°C and 25°C, applied voltage=10 V, electrode=Pt/Ti, water sample=prefiltered water).
The E. coli O157:H7 was only inactivated by 1.0-log (99.0%) at a 50-mg/L of Cl− and a temperature of 13°C even after a 3-min electrolysis. Hence, when electrolysis is applied at a lower water temperature, much attention is necessary in microorganism disinfection by allowing a longer electrolysis time than that determined at room temperature.
In chlorination, pH is also an important factor in the disinfection of microorganisms. Figure 5 compares the inactivation extents of E. coli at different pH values (pH 10, 7.2, and 5). In electrolysis, the extent of E. coli inactivation increases with decreasing pH because the fraction of HOCl increases at lower pH, and HOCl is considerably more powerful than OCl− for disinfection (White, 1992; Son et al., 2004). At pH 7.5, there is an equal distribution of HOCl and OCl− [shown in reaction (3); pKa=7.5]. At pH 5 and 10, the predominant forms of chlorine species are HOCl and OCl−, respectively. Therefore, in a free chlorine-forming electrolysis process, low-pH water conditions would be considerably more favorable for disinfection.

Inactivation of E. coli O157:H7 by electrolysis at varying pH ([Cl−]0=50 mg/L, temperature=25°C, applied voltage=10 V, electrode=Pt/Ti, water sample=prefiltered water).
Effect of various electrodes on the formation of free chlorine and chlorate
Free chlorine generation rates using IrO2/Ti and RuO2/Ti electrodes were compared with Pt/Ti under the same electrolysis conditions ([Cl−]0=100 mg/L, constant current=0.5 A using a DC power supply). To facilitate reliable comparison, distilled deionized water and a DC power supply were used. As shown in Figure 6, free chlorine generation increased with the electrolysis run time, and formation rates were all linear with respect to run time for all the tested electrodes. The highest concentration of free chlorine was observed with the RuO2/Ti electrode, followed by IrO2/Ti and Pt/Ti. The RuO2/Ti electrode system produced up to 96 mg/L of free chlorine after 10 min of electrolysis, which is approximately double that obtained with the IrO2/Ti electrode (48 mg/L of free chlorine) and 19 times higher than with the Pt/Ti electrode (5 mg/L of free chlorine). In terms of free chlorine generation, the RuO2/Ti electrode was rated as the most effective.

Formation of free chlorine using different electrodes in the electrochemical process ([Cl−]0=100 mg/L, pH 7, constant current=0.5 A, water sample=distilled deionized water).
Although the RuO2/Ti electrode was the most effective for free chlorine generation, electrode selection should be carefully evaluated, taking into account the potential for the formation of hazardous inorganic by-products such as chlorate (ClO3−). This study compared the levels of chlorate formation on the three tested electrodes. Chlorate is widely known to be a neurotoxin and to cause hemolytic anemia by destroying red blood cells (Siddiqui, 1996). Therefore, the World Health Organization (WHO) has proposed a drinking water guideline concentration of 700 μg/L (WHO, 2008b). Chlorate is known to be produced through the following reactions (Viswanathan and Tilak, 1984; Czarnetzki and Janssen, 1992):
It is also known to be formed directly at the anode in electrochemical reactions (Tasaka and Tojo, 1985):
Figure 7 compares the chlorate formation profiles observed during electrolysis using the three different electrode materials (Pt/Ti, IrO2/Ti, and RuO2/Ti). In general, chlorate formation increased with electrolysis time for all electrodes. The highest concentration of chlorate was found with Pt/Ti, followed by the IrO2/Ti and RuO2/Ti electrodes. The Pt/Ti electrode produced up to 4.8 mg/L of chlorate over 10 min of electrolysis, which is approximately double that of the IrO2/Ti electrode (2.5 mg/L chlorate after 10 min of electrolysis) and 2.8 times higher than the RuO2/Ti electrode (1.7 mg/L free chlorine after 10 min of electrolysis). The results show that the Pt/Ti electrode was the least efficient because it produced the highest concentration of chlorate and the lowest generation of free chlorine. On the contrary, the RuO2/Ti electrode was the most efficient electrode because it produced the lowest concentration of chlorate and the highest generation of free chlorine.

Formation of chlorate using different electrodes in the electrochemical process ([Cl−]0=100 mg/L, pH 7, constant current=0.5 A, water sample=distilled deionized water).
Table 3 outlines the potential values required for oxygen evolution from an electrochemical process with each of the three electrodes (Panizza and Cerisola, 2006). The electrode materials for generating chlorate should have high oxygen over potential because otherwise a large portion of the applied current would be used to produce oxygen as a side reaction, thereby dropping the efficiency of direct oxidation at the anode and reactive oxygen species formation, which could contribute to the generation of chlorate in the electrochemical process (Jung et al., 2010). However, in terms of free chlorine generation, the anode materials are required to have a high electrocatalytic activity toward the production of the free chlorine (Szpyrkowics et al., 2005). Jeong et al. (2009) also reported that the Pt electrode showed the lowest electrocatalytic activity; on the other hand, RuO2/Ti and IrO2/Ti exhibited a higher activity toward the generation of free chlorine, which is consistent with the result of our study (Fig. 6). This trend is associated with the fact that a RuO2/Ti electrode can more easily oxidize Cl− when it is present as an electrolyte, thus allowing for the formation of a greater amount of active chlorine.
SHE, standard hydrogen electrode.
For process optimization and selection of the most appropriate electrode, the ratio of chlorate and free chlorine concentration during electrolysis were measured for the three different electrode systems (Fig. 8). The lowest and almost constant chlorate formation yield was observed with the RuO2/Ti electrode (0.015–0.018), and the highest chlorate formation yield (0.66–0.85) was observed with the Pt/Ti electrode system. Overall, the RuO2/Ti-type electrode was judged to be the most viable electrode. The Pt/Ti electrode should not be used for drinking water applications.
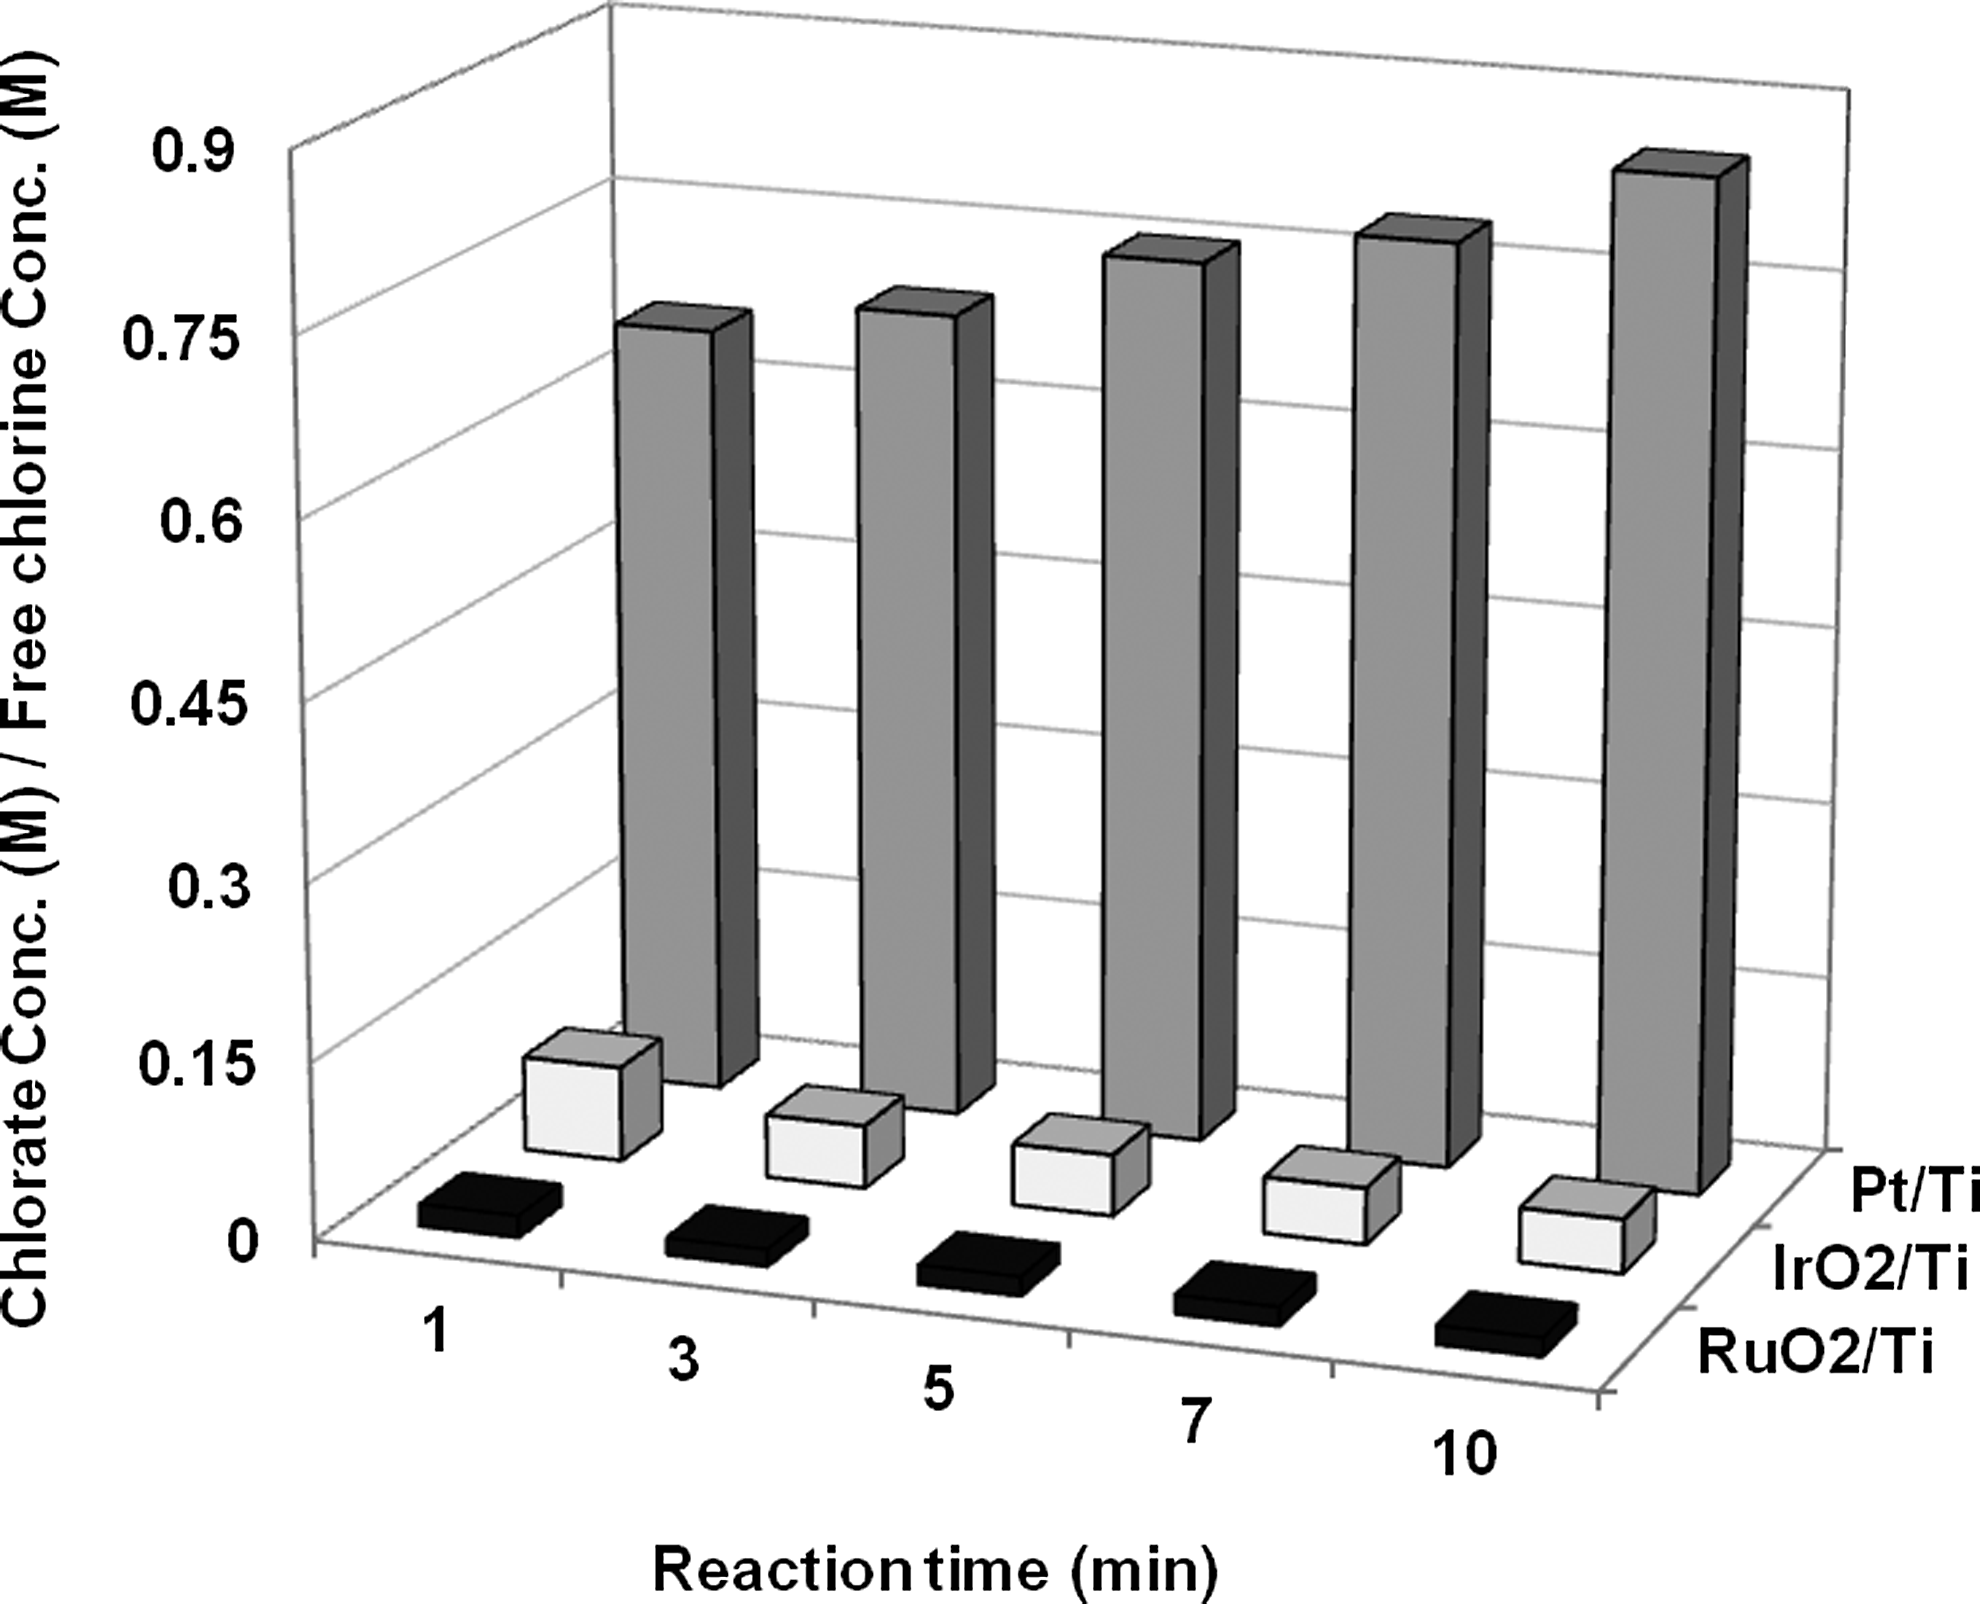
Formation of chlorate by the formation of free chlorine using different electrodes in the electrochemical process ([Cl−]0=100 mg/L, pH 7, constant current=0.5 A, water sample=distilled deionized water).
Effect of prefiltration on the formation of THMs and HAAs
The major purpose of this experiment was to compare the formation of halogenated organic DBPs (THMs and HAAs) during electrolysis using three different electrodes, both with and without ceramic filtration. Table 4 shows the concentrations of THMs and HAAs measured during electrolysis when 10 mg/L of free chlorine is produced. The reason why the concentrations of free chlorine were adjusted to the same value was that it could be focused on the electrode performance without an effect of free chlorine concentration because the free chlorine mainly affects the generation of DBPs. The concentrations of the DBPs were also compared following injection of 10 mg/L of free chlorine solution (sodium hypochlorite [NaOCl]) into the reactor directly without electrolysis for exclusion of an effect of electrochemical performance. Initially, 10 mg/L of humic acid and 100 mg/L of Cl− were added to the tested water. All the samples (pH 7) were incubated at 25°C for 24 h, including the reaction time before analysis of THMs and HAAs. Although the reaction time was different in the each experiment, the effect of reaction time on the generation of DBPs during total incubating time of 24 h was negligible. The tested electrode systems required different electrolysis durations to produce 10 mg/L of free chlorine due to the different capacity of the electrodes to generate it as mentioned previously: 30, 3, and 2 min for Pt/Ti, IrO2/Ti, and RuO2/Ti, respectively. The concentrations of THMs detected in the electrolyzed samples were 137, 100, and 105 μg/L for Pt/Ti, IrO2/Ti, and RuO2/Ti, respectively; these were higher than the THM (82 μg/L) concentrations in the sample following direct NaOCl injection. The formation characteristics of THMs appeared to be independent of the electrode type, but varied according to electrolysis duration, with a longer run time associated with a higher concentration of THMs. It is interesting to note that DOC increased from 1.0 to 1.7 mg/L with a longer electrolysis run time. It was concluded that some insoluble humic acid could be dissolved into the solution during electrolysis: electrolysis therefore increased DOC, which caused THM levels to increase. HAAs did not follow the same formation reaction characteristics as THMs, but were also produced both during electrolysis and in the NaOCl solution.
Synthetic raw sample without prefiltration: [Cl−]0=100 mg/L, [HA]0=10 mg/L, constant current=1.5 A.
THM, trihalomethane; HAA, haloacetic acid.
To exclude the contribution of insoluble humic acid to the formation of THMs and HAAs, the experiment was repeated using prefiltered water with the RDIC ceramic filter (Table 5). In that case, considerably lower levels of THMs and HAAs were detected [under the U.S. EPA thresholds for THMs (80 μg/L) and HAAs (60 μg/L) permissible in drinking water], and the formation characteristics of these compounds were independent of the electrode types, but dependent on the DOC, which was caused by NOM in the solution. Comparison of the results in Tables 4 and 5 shows that insoluble humic acid has a significant effect on the formation of THMs and HAAs in the electrochemical process because electrolysis could increase the DOC level. Therefore, prefiltration before water electrolysis should be carefully considered to produce safer potable water.
Prefiltered sample: [Cl−]0=100 mg/L, [HA]0=10 mg/L, constant current=1.5 A.
Conclusions
The RDIC ceramic filtration of synthetic water containing humic acid (10 mg/L) and kaolin (30 mg/L) effectively removed the SS content and the color-causing compounds. The formation of free chlorine with the solar-charged storage battery was not significantly different from that with the DC power supply. With a Cl− concentration of 100 mg/L, although the CT value was slightly higher at 13°C than at 25°C, the extent of inactivation of E. coli O157:H7 decreased by ∼1.2-log. The extent of E. coli inactivation increased with decreasing pH values because the fraction of HOCl increases with a decrease in pH, and HOCl is a considerably more powerful disinfectant than OCl−. The water temperature and pH should be carefully considered in a free chlorine disinfection system. The RuO2/Ti electrode was most efficient because it produced the lowest concentration of chlorate and the highest generation of free chlorine. The filtered sample subjected to electrolysis showed considerably lower levels of THMs and HAAs than the synthetic raw water sample. The insoluble humic acid has a significant effect on the formation of THMs and HAAs in the electrochemical process because electrolysis increases DOC. In conclusion, the hybrid electrochemical water disinfection system, comprising electrolysis using the RuO2/Ti electrode combined with prefiltration, is strongly recommended for producing safer potable water by reducing the risks from the formation of by-products.
Footnotes
Acknowledgments
This work was supported by the Yonsei University Research Grant of 2012 and the National Research Foundation of Korea (NRF) grant funded by the Korea government (MSIP) (2013R1A2A2A05006466).
Author Disclosure Statement
No competing financial interests exist.