
Abstract
Abstract
In this study, mesoporous titanosilicate (MTS)/reduced graphene oxide (RGO) composite materials were prepared as a function of the RGO content and used as novel adsorbents for a mixed-solute solution of methylene blue and rhodamine B (RhB). Adsorption capacities of the composite materials were higher than those of MTS or RGO by themselves, demonstrating that adsorptive performances of the composite materials are better than the inorganic or organic materials alone. Composite material containing 20 wt% RGO (20MTSG) showed the best adsorption capacity for both contaminants where its adsorptive behavior in the mixed-solute solution can be ascribed to the unique morphology of the large layered structure of MTS and RGO, as well as many aggregates of small-sized plates. Compared to the other composite materials, 20MTSG contained an abundant edge structure of RGO, resulting in a relatively higher RhB adsorption capacity. RhB preferred the adsorption sites on RGO to the adsorption sites on MTS due to steric hindrance inside the mesopores of MTS.
Introduction
M
Three-dimensional mesoporous silica has been used for environmental applications due to advantages of interconnected channels and a large surface area that allow reactants to diffuse easily and prevent mesopore blockages (Carreon and Guliants, 2005; Sinha et al., 2005). A number of researchers have investigated the incorporation of transition metal ions or metal oxides into the framework of mesoporous silica to improve significantly its hydrothermal stability, adsorbability, and photocatalytic performance (Carreon and Guliants, 2005; Sinha et al., 2005; Wu and Zhao, 2011). Among them, titanium (Ti) has been widely used as an additive because it forms a common semiconducting oxide with a high photocatalytic activity. In addition, it has been reported that the combination of titanium dioxide (TiO2) and mesoporous silica induces an enhancement of the adsorbability of hazardous organic molecules due to the significant increase of surface area (Luan et al., 1999; Chien et al., 2004; Bhargava and Akolekar, 2005; Messina and Schulz, 2006; Chen and Mao, 2007).
Graphene has emerged as one of the most exciting materials since its experimental discovery in 2004 (Novoselov et al., 2004; Rao et al., 2009; Poirier and Schopfer, 2010). The combination of graphene or reduced graphene oxide (RGO) nanosheets and TiO2 particles has been shown to be a promising pathway to generate good candidates for water purification by both adsorption and photocatalysis because of the improved accessibility of organic molecules and efficient facilitation of the charge carrier separation (Zhang et al., 2010; Leary and Westwood, 2011; Nguyen-Phan et al., 2011; Ramesha et al., 2011; Zhang et al., 2011; Li et al., 2012; Nguyen-Phan et al., 2012).
In this study, we prepared mesoporous titanosilicate (MTS)/RGO composite materials as a function of the RGO content and explored the adsorptive characteristics of the materials for a mixed-solute solution of methylene blue (MB) and rhodamine B (RhB). The MTS/RGO composites showed better adsorption performances than MTS or RGO by themselves. The adsorption behavior of the composite materials in the mixed-solute solution was interpreted on the basis of the structure of the organic dye molecules and steric hindrance for adsorption sites. This work may provide new insights into adsorption sites of inorganic/RGO composite materials for organic contaminants.
Materials and Methods
Synthesis of MTSG composites
All chemicals were purchased from Aldrich and used as received without any purification. First, graphene oxide was synthesized from expanded graphite (grade 1721, Asbury Carbon) by a modified Hummers method (Hummers and Offeman, 1958). For the preparation of MTS/RGO composites, an aqueous solution containing cetyltrimethylammonium bromide (CTAB) and sodium hydroxide (NaOH) was mixed until it became homogeneous, and different amounts of the GO dispersion were added. The mixture was sonicated for 2 h at room temperature and then magnetically stirred at 313 K for 2 h. A mixture of tetraethoxysilane (TEOS) and titanium isopropoxide (TTIP) was added dropwise. The TEOS:TTIP:CTAB:NaOH:H2O molar ratio was 10:1:6:2:6,000. The whole solution was stirred at room temperature for 30 min and then at 313 K for 12 h. The solution was continuously hydrothermally treated at 353 K for 10 h. The solid products were recovered by washing with warm ethanol and dried at 353 K overnight. The as-synthesized powders were finally heat-treated at 823 K for 4 h under argon (Ar) flow. The calcined materials were denoted as “xMTSG” for MTS/graphene composites, where ‘x’ is the graphene oxide content (1, 5, 10, 15, and 20 wt%). The RGO and MTS were also synthesized for comparison using the same procedure without the addition of the Ti/Si source and graphene oxide dispersion respectively.
Characterization techniques
The structure of the composites was observed by a field-emission scanning electron microscope (FE-SEM; JSM-600F; JEOL). A JSM-600F field emission scanning electron microscope was used at a voltage of 10–15 kV. The samples were coated with platinum (Pt; ca. 3 nm) by vacuum sputtering for SEM observation. The high-resolution transmission electron microscopy (HRTEM) bright-field images and EDX spectra were obtained using a JEM-2100F (JEOL). Specimens were prepared by suspending in an ethanol solution, and two drops of ethanol solution containing the ground catalyst powder were placed onto a carbon film-coated gold (Au) grid. Raman spectra were collected using a DRX Raman microscope (ThermoFisher Scientific) with 633 nm laser excitation. Nitrogen gas (N2) sorption measurements were conducted on a ASAP 2020 instrument (Micromeritics). The samples were degassed under a vacuum at 240°C for 5 h prior to automatic analyzer analysis at −196.15°C. Brunauer–Emmett–Teller (BET) and Barrett–Joyner–Halenda (BJH) calculations were applied to determine the specific surface area, pore volume, and pore size distribution.
Adsorption in the mixed-solute solution
Adsorptivity of the composite materials was elucidated through the removal of a mixture of MB (10 ppm) and RhB (10 ppm) whose molecular structures are shown in Fig. 1A and B, respectively. Ten milligrams of the adsorbent was immersed in 100 mL of the mixed-solute solution (volume ratio of 1:1) under constant stirring inside a dark chamber. The concentrations of the mixed-solute solution before and after adsorption at room temperature were measured by a UV-Vis absorbance microplate spectrophotometer (Spectra Max® Plus 384) at λmax=552 and 664 nm for RhB and MB respectively.
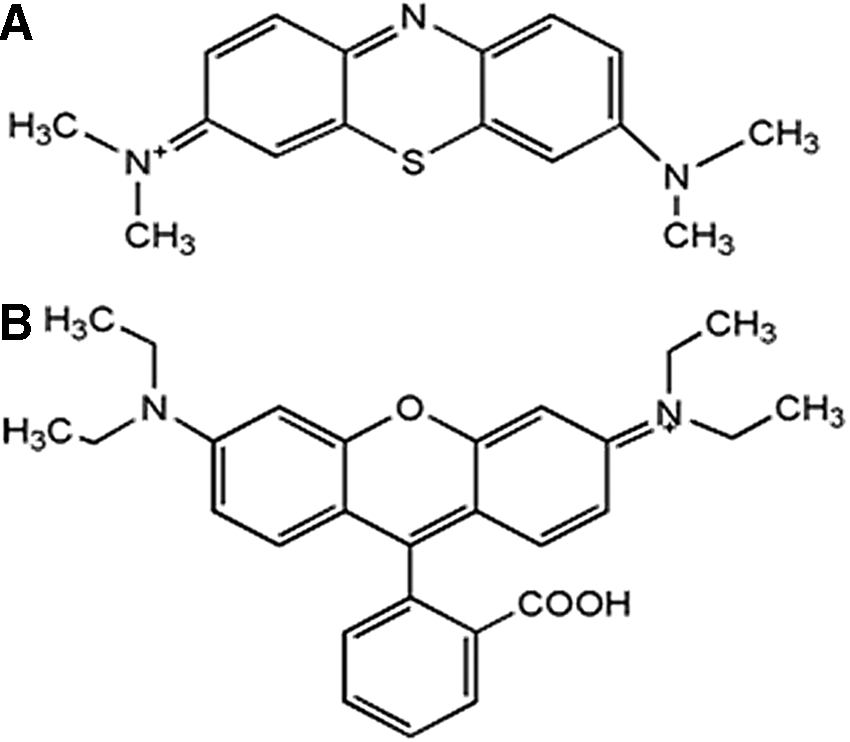
Molecular structures of
Adsorption equilibrium experiments were carried out by agitating 10 mg of adsorbent with 100 mL of the mixed-solute solution of the desired concentration at room temperature. The concentrations of the mixed solutes before and after adsorption were measured by a UV-Vis absorbance microplate spectrophotometer (Spectra Max® Plus 384) at λmax=552 and 664 nm for RhB and MB respectively. The solution pH was measured with a pH meter (pH/ISE/Conductivity Meter, model 460 CP; Istek). The Langmuir isotherm model was employed to study the adsorption capacity of the adsorbents. The amounts adsorbed onto the adsorbent, qe (mg/g) were calculated by a mass balance relationship [Eq. (1)].
where C0 and Ce are the initial and equilibrium liquid-phase concentrations of MB and RhB respectively (mg/L), V is the volume of the solution (L), and W is the weight of the dry composite materials used (g).
Results and Discussion
Characterization of the composite materials
Textural properties, including the surface area, pore volume, and pore diameter, were obtained by analyzing the N2 sorption data. In Fig. 2, the adsorption/desorption isotherms can be assigned as type IV according to the IUPAC classification (Sing et al., 1985). Loops with an intermediate shape between types H2 and H3 were recorded in all composite materials except the 20MTSG sample. This indicates that the composite materials are composed of aggregates of plate-like particles related to slit-shaped mesopores. However, in the case of 20MTSG, the desorption isotherm pattern and hysteresis type are slightly different from those of the other composite materials, implying different textural properties. The textural values are summarized in Table 1. In the composite materials, the surface area and pore volume gradually decreased with increasing RGO content except for 20MTSG. Only the textural values of 20MTSG deviated from the basic trend in which the values decreased with increasing RGO content. When the nominal RGO content was increased from 15 to 20 wt% (20MTSG), the BET surface area increased from 765.8 to 832.2 m2/g and the BJH pore diameter increased from 6.42 to 8.10 nm. Therefore, the 20MTSG composite material has unique properties compared to the other composite materials fabricated in this study. The actual RGO contents in the composite materials were determined from the thermogravimetric analysis (TGA) results shown in Supplementary Fig. S1 and are listed in Table 1. The actual RGO contents are less than the nominal GO content because GO is composed of 30–40 wt% of oxygen, containing groups such as hydroxyl, epoxy, carboxyl, and ketone groups at the edge and on the basal plane. Also, weight loss occurs during the reduction or deoxygenation of GO to RGO by solvothermal treatment and subsequent calcinations. During the reduction of GO to RGO, a sp2 hybrid structure is formed on the basal plane, and hydroxyl and carboxyl groups remain at the edge of the RGO sheet (Dreyer et al., 2010). It was determined that the actual RGO content was nearly proportional to the nominal GO content.

Nitrogen gas (N2) sorption isotherms of the xMTSG materials.
Experimentally determined by thermogravimetric analysis.
Determined from nitrogen gas (N2) adsorption/desorption experiments.
Intensity ratio of the D and G bands, estimated from the Raman spectra.
MTS, mesoporous titanosilicate; GO, graphene oxide; RGO, reduced graphene oxide.
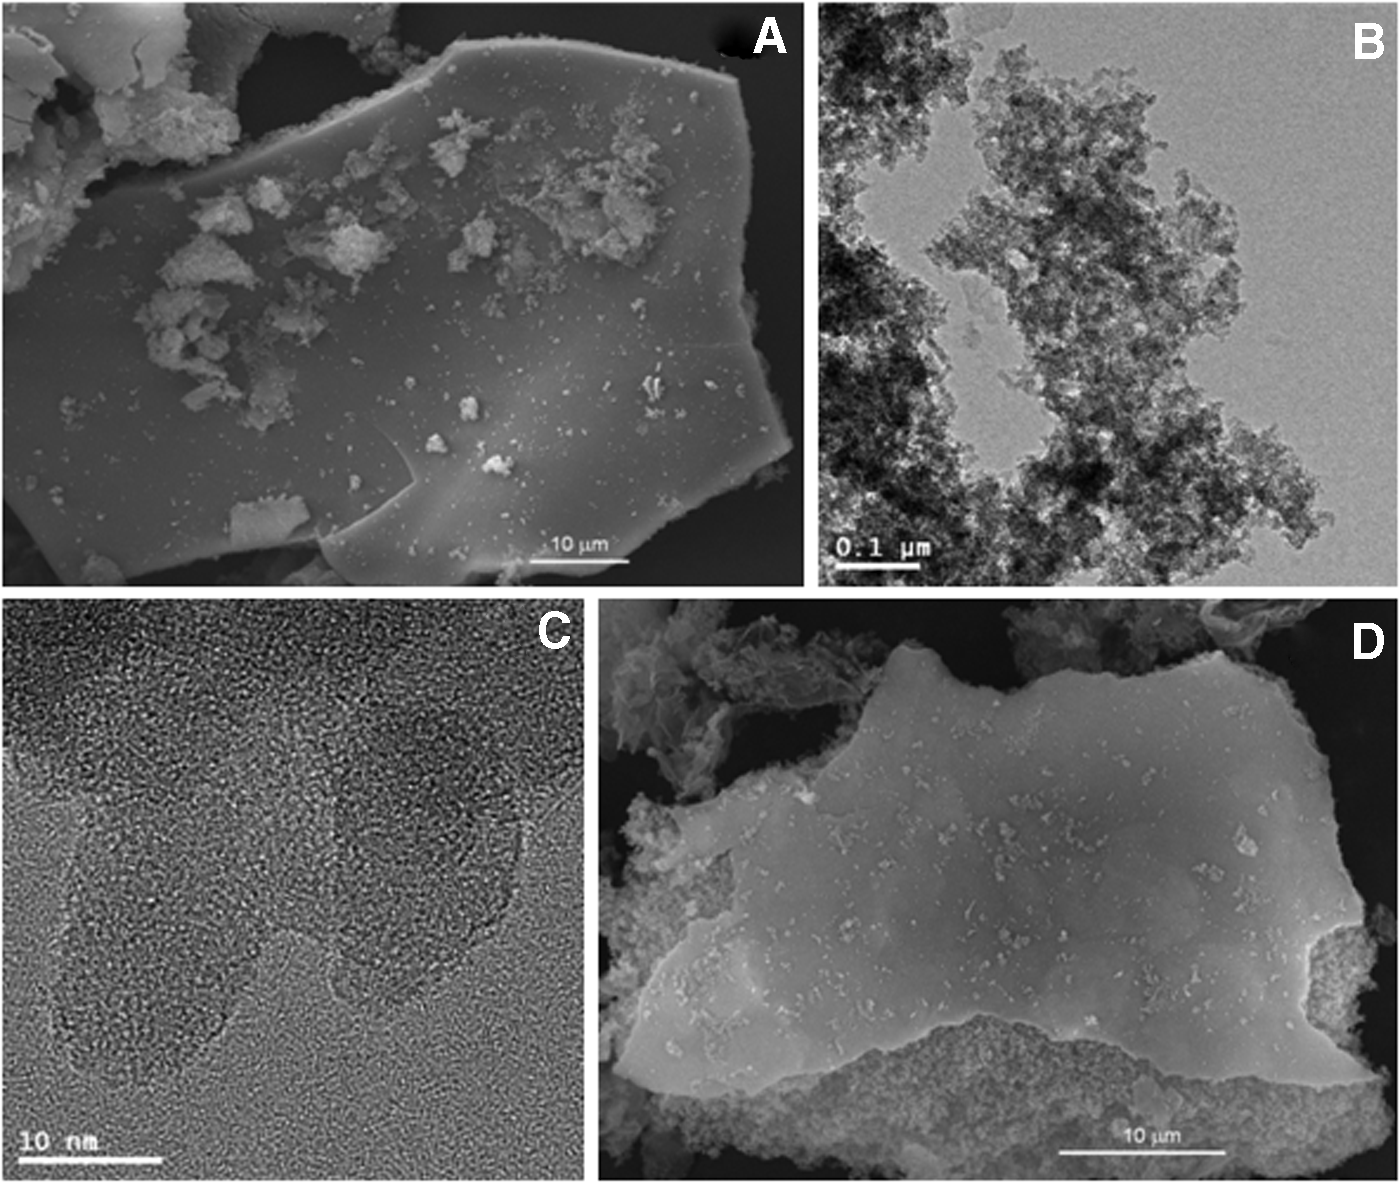
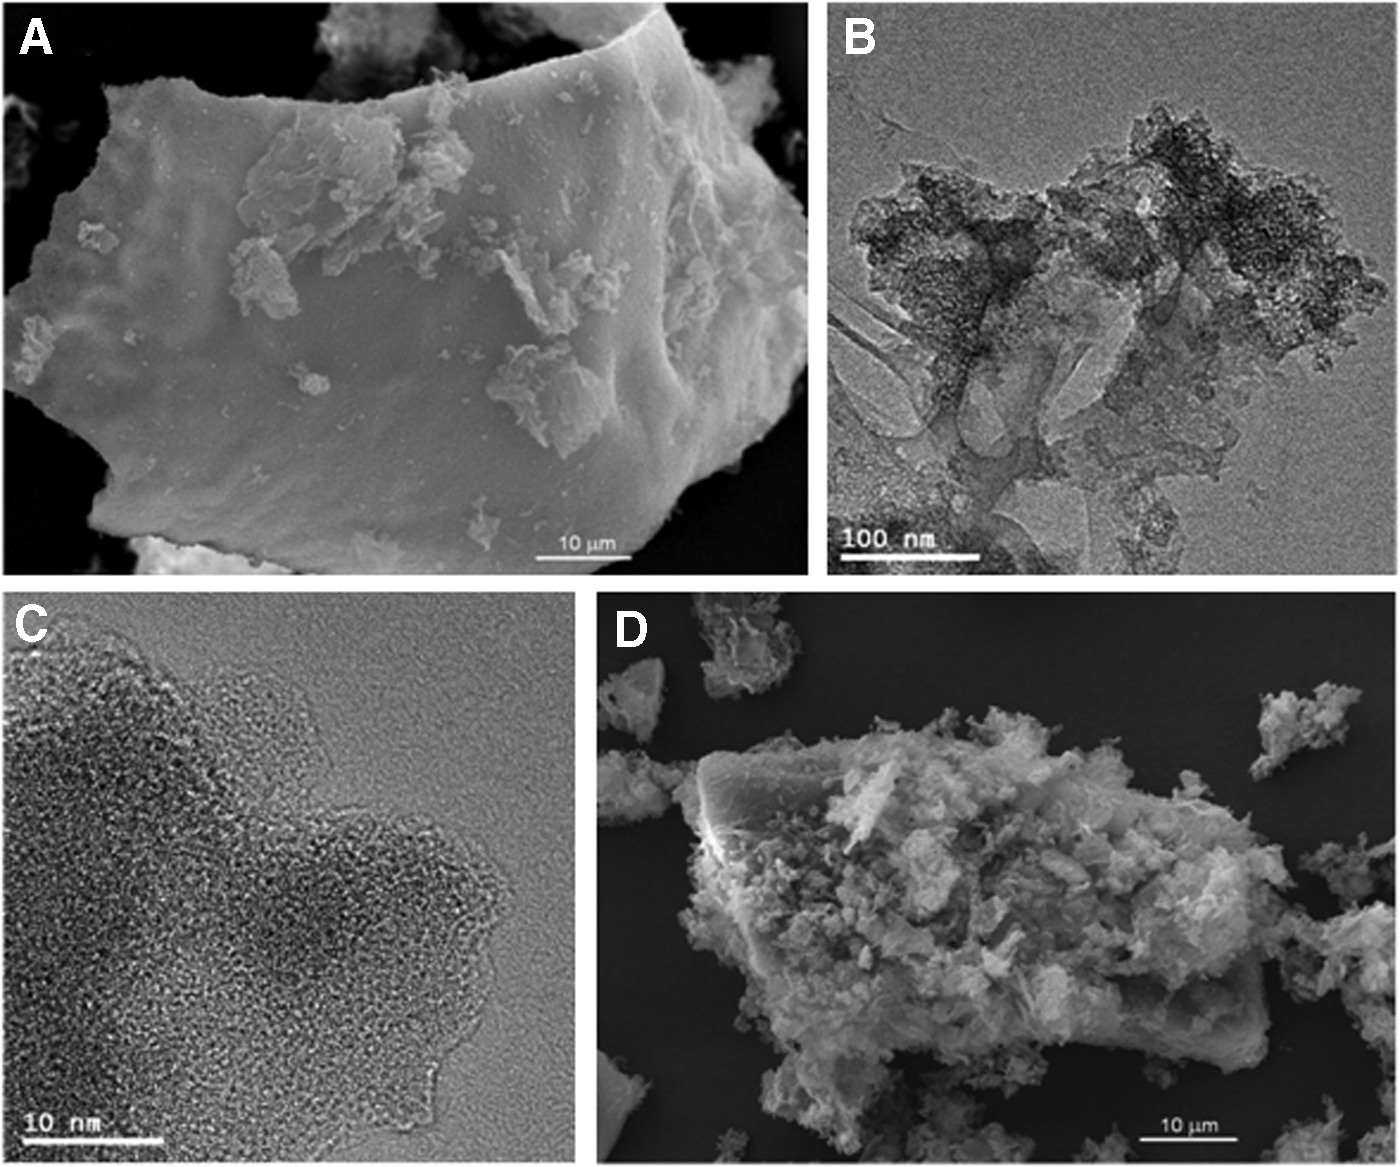
Morphology and structure of the composite materials were observed by electron microscope. Figures 3 and 4 show FE-SEM and HRTEM images of the composite materials. As described previously, the composite materials basically have a large crumb of a layered structure of MTS and RGO, on which the interconnected wormhole-like framework mesostructure was well distributed (Nguyen-Phan et al., 2012). RGO essentially played the role of a two-dimensional platform for the deposition and growth of MTS. However, 20MTSG is composed of not only the large crumb of a layered structure of MTS and RGO but also many small-sized aggregates with a plate structure (Fig. 4D), which would be beneficial for the accessibility of large organic dye molecules. The size of RGO used in this study to make the composite materials ranged from 1 to 10 μm, whereas the size of sandwich-like structure is >20 μm in the composite materials (Nguyen-Phan et al., 2012). Up to 15MTSG, the formation of a giant crumb of a layered structure of MTS and RGO is predominant. When the RGO content is increased up to about 13 wt% (20MTSG), there is a morphological change in the composite materials due to the excess RGO content. That is, the aggregates consisting of small plates in the range of 1–5 μm are also abundant with a crumb of a layered MTS/RGO structure in 20MTSG. The adsorption sites at the edges of RGO are well developed in 20MTSG due to an abundance of the small plate-like aggregates. The composition analysis and distribution of each component in the composite materials are represented by the FE-SEM/EDX spectra and mapping of the 15MTSG sample in Supplementary Fig. S2 where it is clear that C, O, Si, and Ti are well distributed over the large area of the layered structure.
Field-emission scanning electron microscopy (FE-SEM)
FE-SEM
Raman spectra were acquired to confirm the presence of RGO and evaluate the interactions between MTS and RGO (Fig. 5). Two representative D and G bands at 1341 and 1589 cm−1 are found in the composite materials with different relative intensities (ID/IG). With increasing RGO content, the ID/IG ratio in the composite materials gradually increased from 0.841 to 1.019 (Table 1), illustrating either a decrease of the average size of sp2 domains or a change of the properties of the RGO sheets due to interactions with MTS. The D and G bands correspond to the breakage of symmetry by edges or a high density of defects, as well as the first-order scattering of the E2g vibration mode observed for the sp2 domains respectively (Tuinstra and Koenig, 1970). Accordingly, the higher ID/IG ratio implies that a portion of the edge structure to basal sp2 planes in the RGO sheets increases with increasing RGO content. The edge structure in the RGO sheet of 20MTSG is relatively abundant compared to the other composite materials, which is consistent with the interpretation of the SEM images.

Raman spectra of the pristine GO precursor and xMTSG composites.
Adsorption behavior of the composite materials
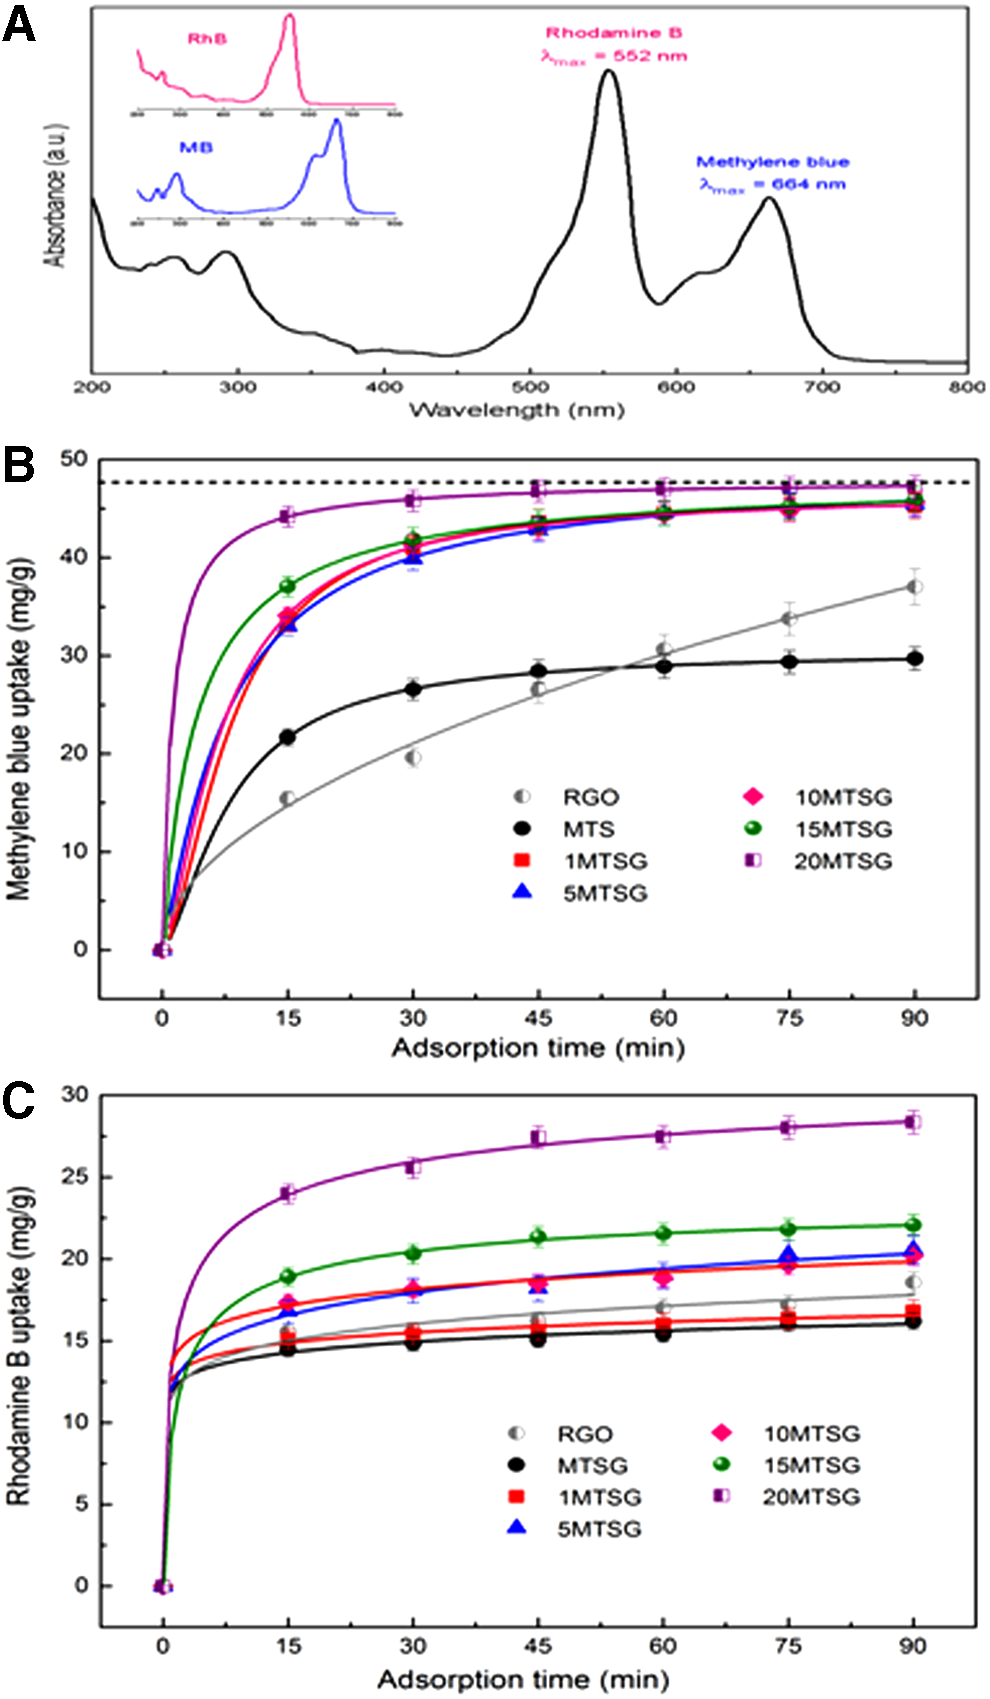
A mixed-solute solution containing MB and RhB was employed to evaluate the adsorption behavior of the composite materials. The UV-Vis spectrum of the MB and RhB solution is shown in Fig. 6A, where the characteristic bands for MB and RhB appear at 664 and 552 nm respectively. On the basis of the intensity of the characteristic bands, the adsorption uptakes for MB and RhB were calculated and plotted in Fig. 6B and C, respectively. The quantitative data for the adsorption kinetics, including the adsorption rate constant, equilibrium uptake, and correlation coefficient, are presented in Table 2. Two kinetic models—pseudo-first-order kinetics and pseudo-second-order kinetics—were used for the quantitative analysis. The fitted plots for the pseudo-first- and the pseudo-second-order models are shown in Supplementary Fig. S3. The data points fitted by the pseudo-first-order model for MB are a little bit scattered around the fitted lines, while the points for RhB adsorption largely deviate from the fitted lines (Fig. S3A and B), resulting in correlation coefficients of 0.95–0.99 for MB adsorption and 0.83–0.95 for RhB adsorption. On the contrary, in the fitted data for the pseudo-second-order model, all of the data except for the MB adsorption points on RGO are very well matched, and the correlation coefficients are >0.99. Therefore, based on the correlation coefficients, the pseudo-second-order kinetics model is a better model for fitting the adsorption data of both contaminants.
Equilibrium adsorption capacity obtained from the kinetics experiments.
Adsorption rate constant, equilibrium uptake, and correlation coefficient estimated from the pseudo-first-order adsorption model ln(qe−qt)=f(t).
Adsorption rate constant, equilibrium uptake, and correlation coefficient determined from the pseudo-second-order adsorption model (t/qt) vs. f(t).
MB, Methylene Blue; RhB, rhodamine B.
Based on the qe value, which is the equilibrium uptake acquired from the pseudo-second-order model, the composite material adsorption capacities for both contaminants are higher than those of RGO and MTS alone, indicating that more adsorption sites are generated by making composite materials. For the adsorption of MB, the adsorption capacities of the composite materials are higher than those of RGO and MTS, but the values remained nearly constant at around 46–47 mg/gads, regardless of the RGO content. On the contrary, the adsorption of RhB on the composite materials shows different behavior where the adsorption capacity of 20MTSG is remarkably high compared to the other adsorbents with a value of 28.70 mg/gads.
To measure adsorption capacities of each adsorbent in detail, adsorption isotherm tests were conducted. Figure 7A and B shows the adsorption isotherms for MB and RhB, respectively, and qmax values calculated by the Langmuir isotherm equation are listed in Table 3. The Langmuir equation is linearized as follows:
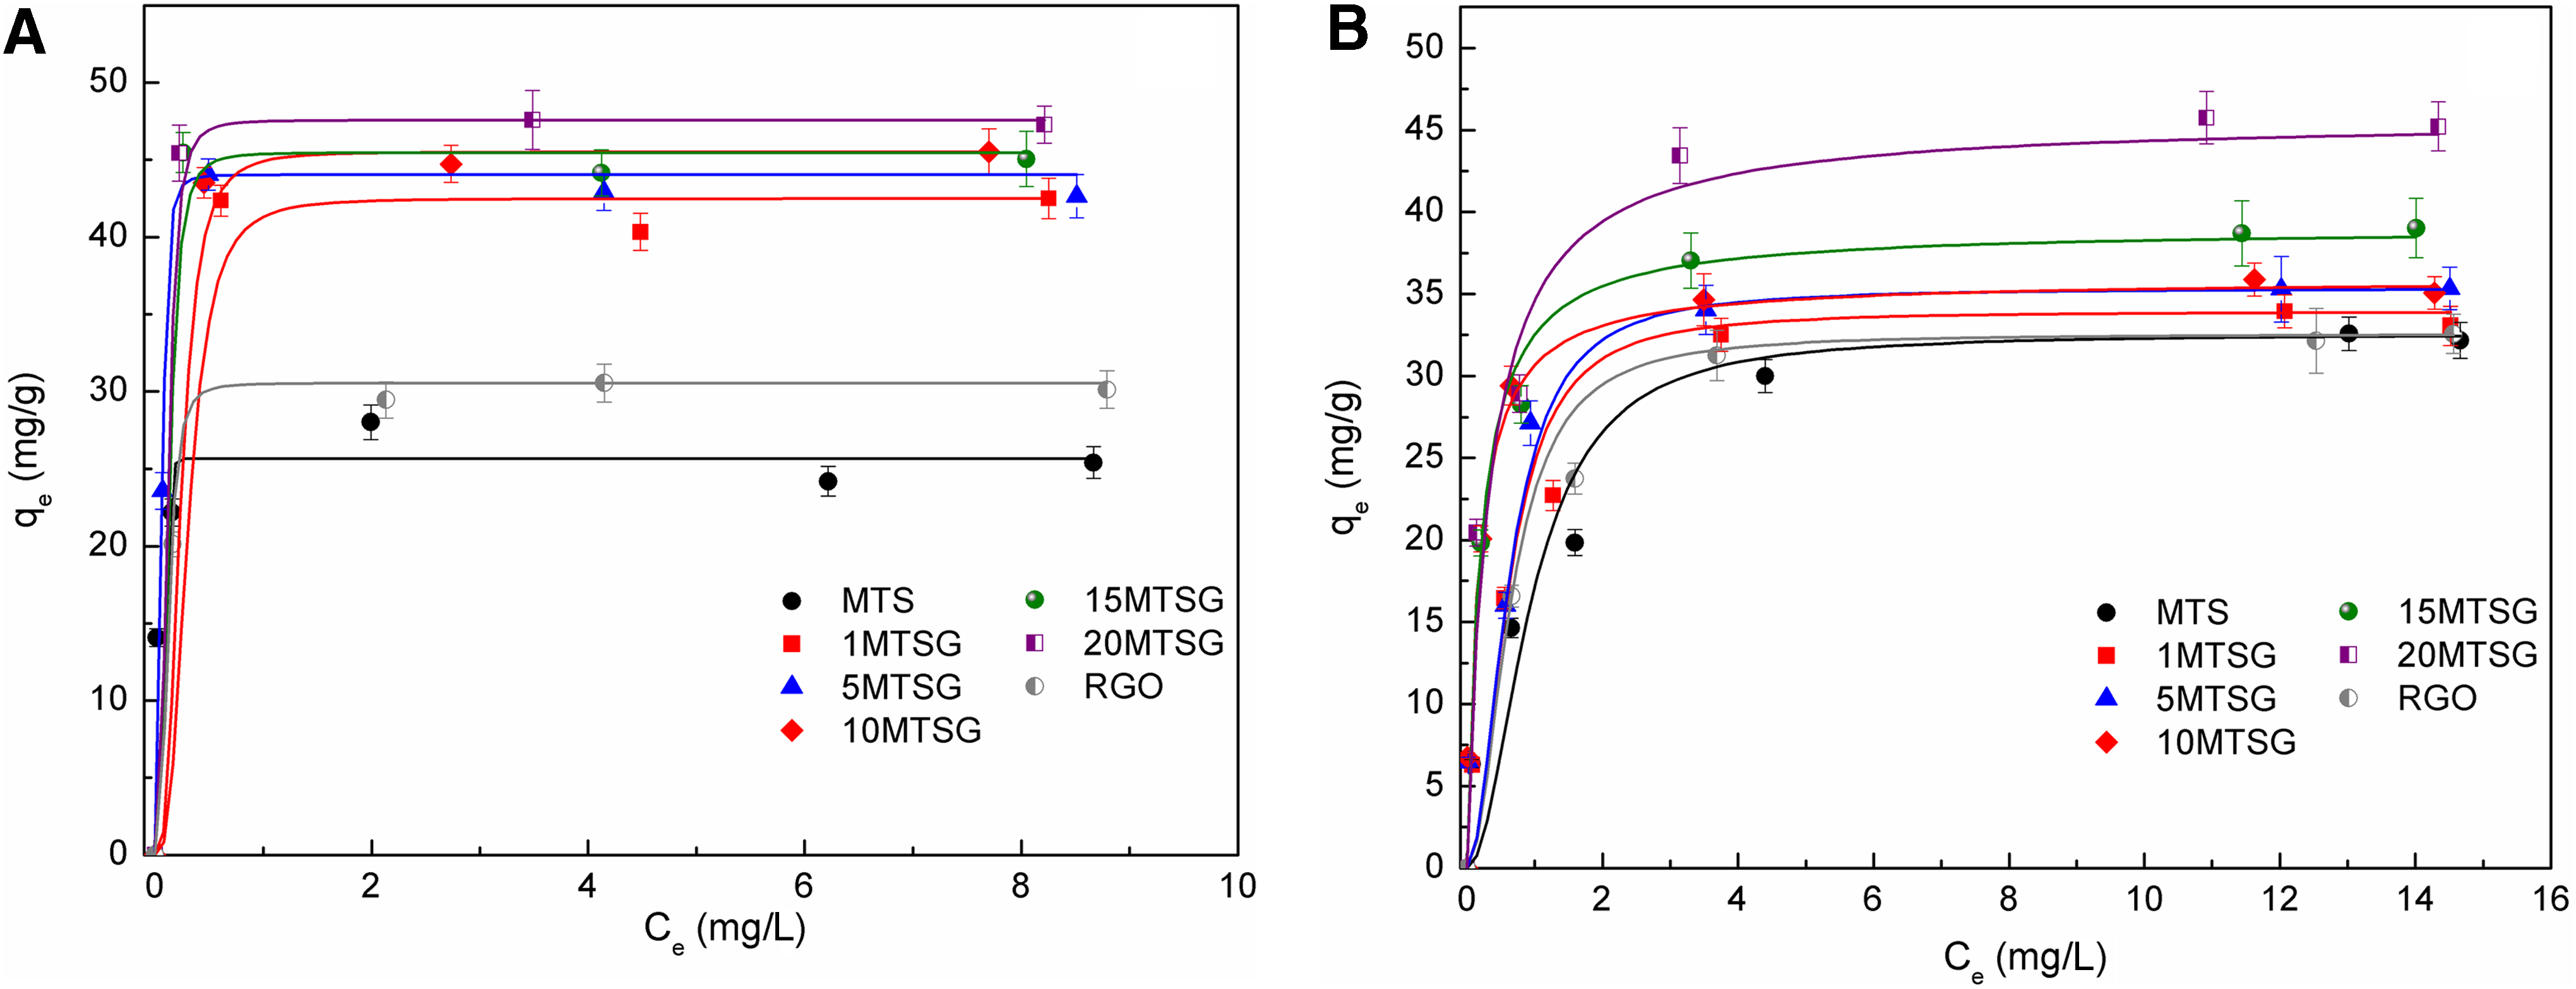
Adsorption isotherms for individual MB
where KL is the Langmuir constant and qmax is the amount of adsorbates adsorbed when the saturation is attained.
For MB, the trend in qmax values is similar to that in qe values obtained from the adsorption kinetic experiments. 20MTSG shows the highest qmax at 47.62 mg/gads, whereas the qmax values for RGO and MTS are 30.77 and 25.91 mg/gads respectively. The qmax values for MB are almost the same as qe obtained from the adsorption kinetics. In contrast, the qmax values for RhB are slightly higher than qe values obtained from the adsorption kinetic tests. However, the basic trend in qmax values for RhB with the RGO contents remains unchanged. 20MTSG show the highest qmax value for RhB, 42.55 mg/gads, whereas the qmax values of RGO and MTS are 28.49 and 26.25 mg/gads respectively. Accordingly, even in adsorption isotherms, adsorption capacities of the composite materials for both contaminants are higher than those of RGO and MTS alone, confirming better adsorptive behavior of the composite materials.
In this work, the synergetic effect of adsorbents are expected by combining a good inorganic adsorbent (MTS) and a good organic adsorbent (RGO). MTS has the advantages of a high surface area and more hydroxyl groups on the surface due to Ti addition. Moreover, RGO has dual types of adsorption sites: functional groups (−OH, −COOH) and sp2 hybrid structure (Xu et al., 2012). In the experimental results, the composite materials, xMTSG, show better adsorption capacity than each adsorbent, giving an evidence of the synergetic effect. It might be caused by high surface area of the composite materials due to stable morphology of the layered structure of MTS and RGO. The surface area of RGO was measured at 68.0 m2/g in this study, even though theoretical surface area of graphene is much high (∼2600 m2/g). The gap between the real value and the theoretical value is due to the incomplete exfoliation of GO and the aggregation of RGO layers. Additionally, the surface area of MTS is 457.5 m2/g—much lower than those of the composite materials (>765 m2/g). In the composite materials, the RGO sheets play the role of two-dimensional platforms for the deposition and growth of MTS, producing high surface areas of xMTSG.
There are several types of adsorption sites on the composite materials. In MTS, hydroxyl groups (Me−OH) are known as a main adsorption site. In a previous report (Nguyen-Phan et al., 2012), increasing the Ti content induced increased adsorption capacity for MB, resulting from an increase of the relative amounts of Ti−OH groups in the composite materials. Moreover, dye molecules also adsorb onto the RGO surface through interactions with different adsorption sites including hydroxyl groups, carboxylic acid groups, and the sp2 hybrid structure in RGO (Wang et al., 2013). Hydroxyl (−OH) or carboxylic acid groups (−COOH) on RGO can interact with the functional groups of dye molecules (Xu et al., 2012). In addition, π–π bonding between the sp2 structure of RGO and the aromatic rings of dye molecules is one of the adsorption interactions. The possible adsorption sites on RGO and MTS are proposed in Fig. 8.
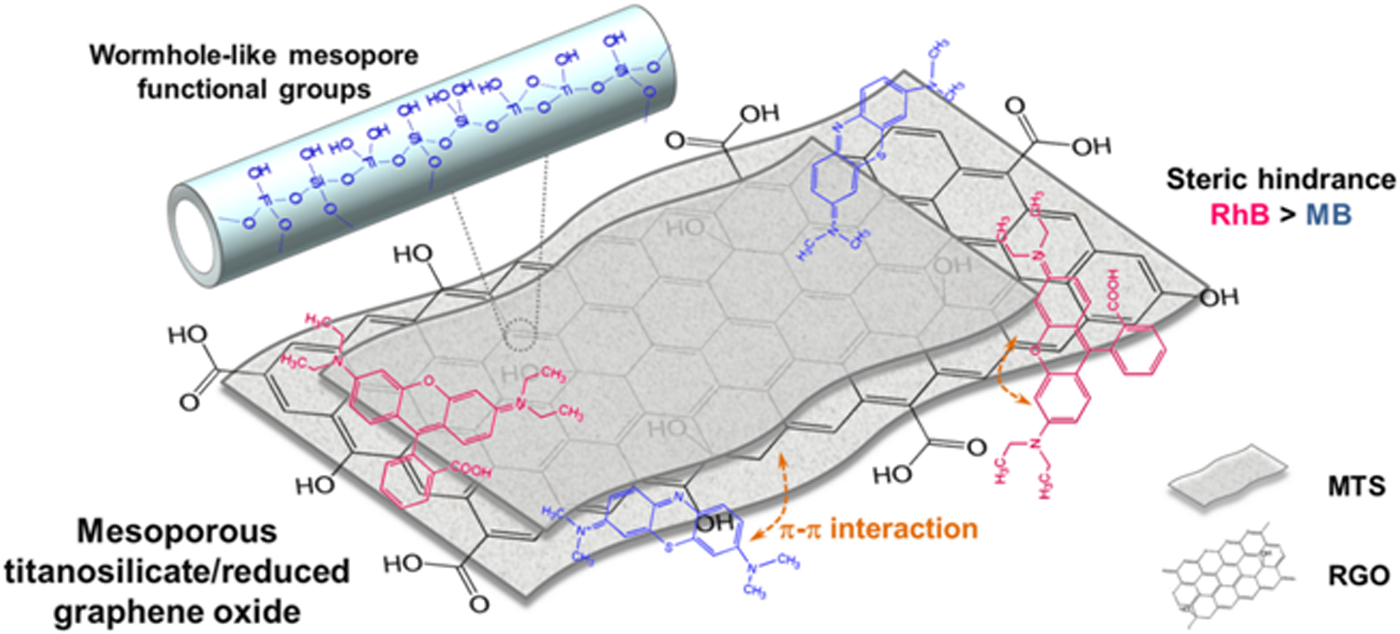
Proposed scheme for the adsorption sites on MTS and RGO.
The adsorption onto hydroxyl groups in MTS could be limited as a result of steric hindrance due to the mesoporous structure. Since most of the Ti and Si are in the framework of the well-developed mesoporous structure, hydroxyl groups (Me−OH), the adsorption sites of MTS, are mainly distributed inside mesopores, resulting in steric hindrance for the adsorption of large dye molecules. In our case, RhB, a larger dye molecule, has much more steric hindrance than MB due to its molecular structure and size (Fig. 1). However, RGO is a sheet-like structure, and the adsorption sites are located on the surface of RGO, resulting in less steric hindrance for the adsorption of dye molecules. In other words, the adsorption sites on RGO have no preference for MB or RhB. In summary, MB can adsorb on the adsorption sites on both RGO and MTS, while RhB prefers the adsorption sites on RGO compared to Me−OH on MTS due to the steric hindrance for adsorption.
When the RGO content is increased in the composite materials, the adsorption sites on MTS and RGO are relatively decreased and increased respectively. However, we can assume that the total number of adsorption sites including the adsorption sites on RGO and MTS remain constant except for 20MTSG. On the basis of the textural data and SEM images, the properties of 20MTSG seem to be different from those of the other composite materials. The textural data of 20MTSG deviated from the general trends in which the surface area and pore diameter decrease with increasing RGO content. The SEM image of 20MTSG shows many aggregates of small-size plates compared to the other composite materials. The structure of the small-sized stacked agglomerates can induce more −OH and −COOH groups in the edge, which is consistent with the Raman spectroscopy results. Accordingly, it can be proposed that 20MTSG contains more adsorption sites on RGO than the other composite materials, and relatively more RhB can adsorb on 20MTSG because of the reduced steric hindrance for adsorption.
Conclusions
We synthesized MTS/RGO composite materials with different RGO contents and tested them as novel adsorbents for a mixed-solute solution of MB and RhB. The composite materials showed better adsorption behavior than the inorganic or organic materials by themselves. In this study, 20MTSG was the best adsorbent for both contaminants on the basis of the adsorption capacities. The adsorption behavior of 20MTSG was attributed to its unique morphology consisting of many aggregates of small-sized plates, as well as a large crumb of a layered structure of MTS and RGO. In the case of 20MTSG, more adsorption sites existed on the edges of the RGO, resulting in a relatively higher RhB adsorption capacity. This behavior was explained by a proposed scheme in which RhB adsorbed selectively on the adsorption sites on RGO due to the steric hindrance of RhB molecules for adsorption inside the mesopores of MTS.
Footnotes
Acknowledgment
This work was supported by the Research Fund of University of Ulsan.
Author Disclosure Statement
No competing financial interests exist.
References
Supplementary Material
Please find the following supplemental material available below.
For Open Access articles published under a Creative Commons License, all supplemental material carries the same license as the article it is associated with.
For non-Open Access articles published, all supplemental material carries a non-exclusive license, and permission requests for re-use of supplemental material or any part of supplemental material shall be sent directly to the copyright owner as specified in the copyright notice associated with the article.