
Abstract
Abstract
The objective of this article is to present a new type of volatile organic compound (VOC) monitoring method based on semiconductor gas sensors. The concept has been developed to account for the continuous measurement difficulties, which result from a sensor memory effect and unpredictable variability of VOC concentration in a monitored environment. The method has been based on dynamic, short-term grab sampling and semiconductor gas sensor exposure in a predefined mode of operation. It allows for at-line monitoring with a time resolution better than 15 min. The measuring setup is compact and easy to operate. The method was tested in workplace conditions involving benzene and toluene emission during a waste stabilization process. Based on findings, the error of the method is no more than 16% of a measuring range. At the current stage of development, the method may be applied to semiquantitative monitoring, yet it has considerable improvement potential.
Introduction
I
VOC is not a precise term. Under European law, VOCs “are functionally defined as organic compounds having at 293.15 K (i.e., 20°C) a vapor pressure of 0.01 kPa or more, or having a corresponding volatility under particular conditions of use” (Council Directive 1999/13/EC). However, there also exist other definitions of VOCs, applicable to specific sectors or countries. The imprecise meaning of the term VOCs and also the fact that these substances comprise an enormous number of chemical species with a wide range of properties indicate that they present a particularly unique analytical dilemma.
A potential hazard to industrial plants, employees, or people living nearby has increased a demand for VOC monitoring. Today, there are a number of well-established techniques, which can be employed either in spot checks or continuous monitoring of pollutants. They strongly vary in complexity and price (Culea et al., 2005; Sumin et al., 2006; Marć et al., 2012).
Monitoring of VOCs is often performed by direct-reading instruments (Gullett et al., 2008). In these devices, samples are taken from the line and fed into an analyzer that analyzes gas in real time. The instruments provide rapid on-line detection or measurement of the concentration of target compounds without any need for further analysis in a laboratory. The equipment may operate for an extended period (weeks or months) with a minimal operator intervention. There are lots of types of direct-reading instruments for VOC monitoring and, as these use different detection principles, they strongly vary in complexity, price, and performance characteristics.
Sensing technology in the field of emission testing is being paid increased attention. According to a current IUPAC definition, a chemical sensor is a device capable of converting a chemical quantity into an analytically useful signal (Hulanicki et al., 1991). Direct-reading instruments can be equipped with a number of different types of gas sensors. They are based on different operating principles. They usually belong to one of the following classes: electrical, optical, mass sensitive thermometric and calorimetric (thermal conductivity sensors, catalytic sensors). Among the different kinds of gas sensors used for VOCs, the semiconductor gas sensors are especially promising (Yamazoe and Shimanoe, 2009). It results from the advantages of the devices, for example, high sensitivity, durability, small weight and dimensions, real simplicity in function, large number of detectable gases (wide possible fields of application), low cost, flexibility in production, and ease of use (Simon et al., 2001). Semiconductor gas sensors are widely used as invaluable safety devices for the detection of methane, propane, carbon monoxide gas, etc. However, industrial application of these devices is difficult and problematic. This limitation results from a number of shortcomings such as relatively high energy consumption (operating temperature >300°C), lack of selectivity, nonlinearities of sensor's response, long-term drift, variations in initial resistance, sensing material poisoning and aging, hysteresis, and sensitivity toward environmental factors, for example, fluctuation of temperature and gas flow (Pearce et al., 2002; Szczurek and Maciejewska, 2013; Zaromb and Stetter, 1984). This work has been aimed at developing a measurement method that would allow applying semiconductor gas sensors to monitor VOCs released during a technological process. We focused our attention on the fact that a sensing mechanism can work in such a way that the response and recovery time of the device will be too long for continuous measurements. The measurement method proposed in this article was developed on the basis of experimental results.
Experimental
The measurement method proposed in this article was developed on the basis of experimental studies. These included dedicated instrumentation and a technological process that was the source of VOC emission.
Instrumentation
Measurements were performed with the direct-reading instrument of original construction designed in the Laboratory of Sensor Technique and Indoor Air Quality Studies at Wroclaw University of Technology. The device was based on a gas sensor array (Fig. 1). It consisted of 15 commercially available Taguchi Gas Sensors: TGS821, TGS822, TGS824, TGS825, TGS826, TGS880, TGS883, TGS800, TGS2201, TGS2201, TGS2106, TGS2104, TGS2602, TGS2620, and TGS2600 (Supplementary Table S1). Due to the fact that chemical reactions of organic compounds during tests could produce gaseous products disturbing the measuring process, each sensor was placed in its own flow-type chamber. The compartments were small, airtight, and made of aluminum. They had a gas inlet and outlet and were equipped with all the necessary electrical connections. The sensors were connected to a measuring unit and a voltage supplier. The sensors were heated. As the operation was under control, it was possible to maintain a constant temperature in the direct vicinity of the sensors. The instrument was equipped with a pump and a set of valves, which enabled the test/reference gas to pass through the instrument at a defined flow rate. The device was fitted with a set of filters. They were used to remove dust, water vapor, and VOCs from the stream of ambient air to prepare purified air. The chambers, gas tubing, and other elements coming into contact with the gas were built of highly chemical-resistant materials. The instrument was prepared for continuous recording of gas sensor signals with a predefined time resolution. The measurement data were recorded with the time resolution of 1 s.
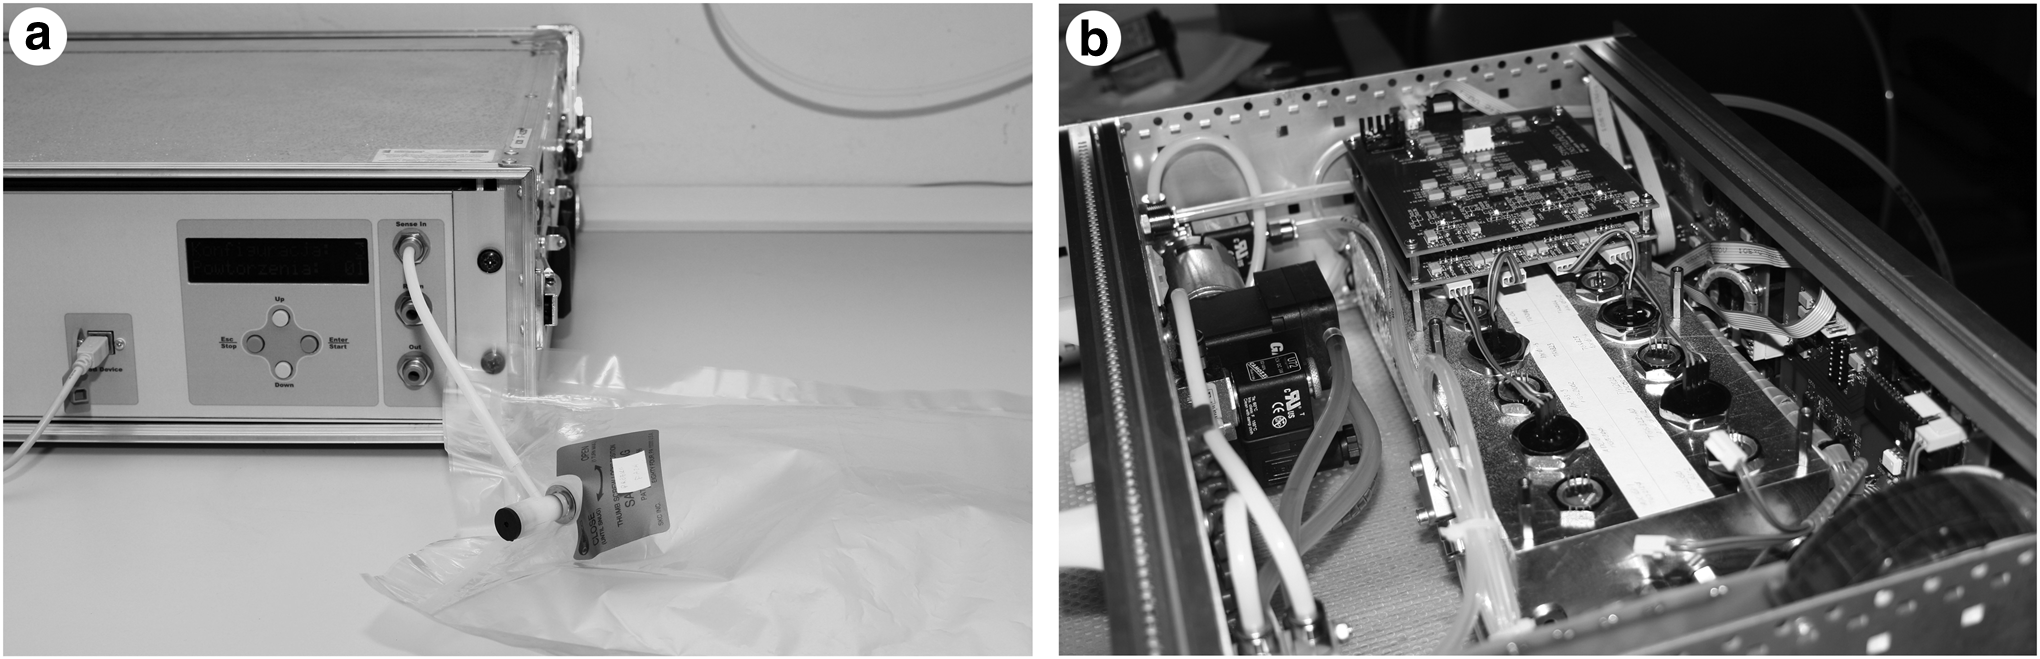
Portable instrument based on a gas sensor array.
The method based on semiconductor gas sensors (proposed in this article) was compared with the method recommended as reference for determination of total VOCs. For that purpose, we applied a portable heated total hydrocarbon analyzer 3030PM with a flame ionization detector (FID; Signal Group). The measurement data were recorded with the time resolution of 1 s.
In this work, the method was tested on toluene and benzene emission. To characterize our approach, experiments were performed with standard gases. These included one-component mixtures of benzene and toluene in air. Based on the VOC concentration range expected in a technological process, the following concentrations of these substances were examined: 0, 2.5, 5, 10, 25, 50, 100, and 200 ppm. The standard gas mixtures were prepared using an evaporation method, described in detail elsewhere (Szczurek et al., 2013). To represent a range of possible measurement conditions, gas mixtures containing toluene were prepared in air with different humidity levels. The measured samples had the following water vapor content: <0.5 g/kg (<5%), 4 g/kg (20–27%), 7 g/kg (35–48%), and 10 g/kg (50–68%). In case of benzene, all gas samples had the same humidity equivalent to the water vapor content of 7 g H2O/kg. The predefined air humidification was achieved using the gas standards generator (Kin-Tek 491). Each concentration was measured thrice.
Technological process
Real conditions for VOC monitoring were simulated in laboratory conditions using a technological process. The authors focused their interest on the waste stabilization/solidification process (Mulder et al., 2001), which was developed with an objective to immobilize the VOCs contained in contaminated soils.
Figure 2 shows the immobilization of VOCs carried out in the workstation. The process consisted of the following unit operations:
Experimental setup. • placing the contaminated soil in a cement mortar mixer (reactor); • adding the binding mixture to the reactor; • mixing the content of the reactor (waste homogenization stage of 5 min); • diluting the mixture with water and mixing simultaneously (hydration stage of 5 min); • emptying and cleaning the reactor; • forming waste-based composites.
Ground soil used in tests was poorly coherent and characterized by both hydration at the level of W=3.41% and low content of organic substances at the level of 1.97%dm. In the experiment, 200 g soil samples having a granularity below 0.5 mm were weighted, placed in containers, and contaminated with 0.5 mL benzene or toluene. Then, the containers with samples were encapsulated to reduce evaporation of gaseous contaminants. For distribution of solvents in the entire volume of material, tightly closed samples were placed in a shaker with tumbling over motion (Heidolph Reax 20/8). The mixing time was 2 min. The samples prepared in such a way were solidified with Portland cement in amounts of 100, 200, and 400 g.
The waste stabilization process was carried out in batches. The batch was indicated by the particular combination of a dose of water and binding component (Portland cement). To initiate concretion (binding) of hydraulic binders, an introduction of diluent water was necessary. The dose of water was closely connected with the amount of used cement and the moisture capacity of neutralized soil. The amount of soil and added contaminants were the same in all the experiments. A single batch involved solidification of three soil samples. Table 1 presents the details of the investigated batches.
Due to the batch system, the process of VOC immobilization in contaminated soil is the source of their periodic emission, which shall be monitored. The magnitude of the pollutant release is substantial during the waste homogenization phase (operation 3).
Methods
Assumptions
Figure 3 shows the dependence of the output of a semiconductor gas sensor upon present and past input values (history of the device). In other words, a memory effect is observed in the sensor response to gas under test. This effect is not important for spot (instantaneous) measurements. However, it becomes significant if monitoring is based on continuous or periodic measurements performed with high frequency in conditions of fluctuating gas concentrations.
Memory effect in a semiconductor sensor.
The memory effect results from the fundamental features of a sensing mechanism typical for semiconductor gas sensors. The response of these devices to tested gas is strongly affected by the transport of reactive species into a sensor, the diffusion of gas molecules inside pores of sensing material, adsorption and desorption, the catalyzed redox reactions on the surface of a sensing layer (mainly their kinetics), and finally, the electrical/electronic effects in the semiconductor (Yamazoe and Shimanoe, 2010). Each of these factors is time dependent and strongly affected by temperature, sample flow, and partial pressure of the tested gas. The important aspect of these dependencies is the hysteresis observed in a sensor response. The parameters influencing the sensing mechanism of the sensor are related to the measurement method used in the direct-reading instrument. Therefore, the authors have assumed that suitable (1) gas sampling, (2) generation of analytical signals, (3) operation mode, (4) signal processing/feature extraction, and (5) data analysis might reduce the memory effects and improve the quality of obtained information.
Gas sampling
In a lot of direct-reading instruments, sensor units are designed to use natural diffusion as a sampling method (Thammakhet et al., 2006). In this approach, gas exchange is relatively slow (Walgraeve et al., 2011). For that reason, it cannot be used in a measurement system with memory effects. Therefore, the authors propose to use dynamic (extractive) sampling (Lodge, 1989). In this case, a sample is taken and transported to a sensor using a sampling pump. In the sample flow system, sensors are placed in a gas stream that allows the rapid exchange of atmosphere inside a measurement chamber. The direct-reading instruments with the sample flow are convenient because a measurement cycle is both short and easy to handle. Thus, a lot of samples can be measured within a short time.
The key issue of air pollutant monitoring is sampling duration. In general, it is classified by three categories, that is, continuous (long term), short term, and instantaneous. The continuous sampling has to be coupled with a high-resolution method of gas detection. Yet, because of memory effects, this requirement is not fulfilled in the case of semiconductor gas sensors. These devices seldom reach an equilibrium state with tested gas due to their slow dynamics versus rapid fluctuations of concentration in turbulent gas flow. The problem with instantaneous sampling consists in a potentially high probability of obtaining an unrepresentative sample that represents a peak of gas concentration. This method is recommended if a quantified parameter is expected to remain constant. In our study, we have assumed that a direct-reading instrument for emission testing must often deal with strong fluctuations in the emission process. In practice, there is no way to predict and determine these fluctuations. Therefore, the information about gas concentrations is better reflected in the samples with time-integrated average concentrations. This type of a sample may be obtained using short-term discrete sampling, in which a volume of tested gas is collected at a specific location, starting from a certain point in time, over a period, usually from seconds to less than several minutes. The best method to accomplish this type of sampling is grab sampling. In this work, a time-weighted average sample is taken at a known sampling rate (0.6 L/min) over a fixed period of time (4.5 min). The gas is collected in a plastic Tedlar bag (10 L). This plastic container is inert, light, and inexpensive and allows the sample to be withdrawn for analysis without any dilution by replacement air or pressure reduction. When the sample collection is finished, the gas is pumped into measurement chambers of a direct-reading instrument and immediately analyzed using sensors that operate in real time. The measurement is performed online at the monitoring site. It means that there is no need for sample transport to a laboratory or special handling to avoid deterioration of collected gas. The results of analysis coupled with grab sampling are expressed as the average concentration over the sampling period. It should be noted that grab sampling enables to perform a calibration process of the whole measurement system in a relatively easy way.
Generation of an analytical signal
In the proposed method, changes of semiconductor resistance are considered as sensor response to VOCs during exposure to gas under test. An output signal is measured in the form of a sequence of raw voltage variations on load resistance connected to a sensor. It is related by time and used as an ordinal variable. The measured quantities are digitized and stored for further processing and analyzing. As a signal is the main source of chemical information, the method of its generation is a key issue in this work. In general, signals are differentiated into static or transient ones. Information included in these two types is different. The static signal is measured when a sensor is in equilibrium with the surrounding gas. In other words, the device is in a steady state. In commercial instruments, this type of signals has been preferred up to now, since they are easily measured and time independent. Additionally, signal processing and data analysis are less complicated in this case. On the other hand, transient signals are a source of multivariate information. This originates from the kinetics of processes that strongly influence sensor response. Static and transient (Varpula et al., 2011) signals are carriers of different information. Therefore, their combination provides more information than if only a single one was used. In this case, it means that significant enhancement of identification and quantification abilities of a measuring instrument may be obtained. For that reason, the authors propose to use both static and transient signals.
The character of a signal determines the method of its generation. In semiconductor gas sensors, transient signals are usually generated by operating these devices at different temperatures. In particular, modulation of this working parameter is used to reduce long-time drift effects and diminish cross sensitivities. In this work, we have proposed to obtain the transient signal by a change of exposure conditions because this method is easy to use and does not deeply change the state of sensing material.
Operation mode
The authors assumed that the operation mode (measuring procedure) should consist of four sequentially performed operations. (1) At the beginning, gas sampling is accomplished. During this operation, sensors are inserted into a flow of pure air (a reference gas). An electrical signal is static. It is treated as a baseline. (2) The dynamic exposure of sensors to a stream of tested gas is performed. The sample is drawn from a Tedlar bag and directed to sensor chambers. The delivery of the sample in such a way is free from fluctuations caused by variations of physical and chemical properties of gas at a sampling point. The gas flow through the direct-reading instrument is set to 1 L/min and kept constant. The dynamic exposure runs for 420 s. This time is sufficient to attain equilibrium between sensors and the surrounding atmosphere. (3) After the dynamic exposure, the next step is accomplished. This is initialized by a gas delivery cutoff. During this phase of operation, the gas flow is stopped. However, the sample remains in sensor chambers. The reactions occurring on the surface of the semiconductor make the chemical composition of gases around the sensors change continuously. The static exposure of the sensors to the tested gas lasts for 420 s. (4) The fourth stage functions both as a recovery process and a source of analytical information. The gas flow through the instrument is activated. Sensors are again in dynamic conditions. A stream of pure dry air is used for the recovery operation. The flow of the gas is at the level of 1 L/min. The exposure of the sensors to a stream of pure air is continued for 420 s. This time is sufficient to attain a baseline. After the cleaning phase, the signal is settled at a baseline value, which is the reference measured before the next gas injection. We assume that during long-term measurements, the operation mode based on the procedure flow-stop-flow (Szczurek et al., 2010) or exposure-cleaning may be used in a periodical manner. In this way, quasicontinuous monitoring may be performed. It will provide detailed information about the temporal variability of the emission process without the need for later analysis in a laboratory.
Signal processing/feature extraction
The characteristic feature of a transient signal is the large number of data collected during each measurement. To reduce calculation problems, a data compression is applied. The result of this operation is the feature defined as the average of subsequent sensor signal values recorded in a predefined time window.
Data analysis
In the proposed method, the aim of data analysis is to provide information about VOC concentration. This operation is based on a transfer function. The term describes the mathematical relationship between an input variable (feature) and the VOC concentration. The following equation is chosen to represent the relationship.
where i indicates the sensor; Ci is the VOC concentration; Ri is the sensor signal feature; ai, bi, ci are the coefficients/parameters of the transfer function; and ɛ represents the random factor.
In our approach, transfer functions are prepared to determine the concentration of a particular VOC based on the responses of different sensors. The quality of fit is evaluated using the coefficient of determination. This measure is further taken as the criterion for selecting the best sensors for the assessment of a particular VOC.
The estimation of transfer function coefficients is based on the measurement data obtained for reference gas mixtures. We assume that the reference gas mixtures are composed of known amounts of the VOC and the purified air that has fixed water vapor content. It is important for measurements of reference gas mixtures to be performed in the same manner as those of real gas samples. Thus, the humidity of reference gas mixtures and test samples is similar. Using the same measurement procedure in both cases, we also ensure that transfer functions parameterized for reference gases may be applied to determine the VOC concentration in real measurement conditions. Transfer functions have to be periodically reparameterized.
In the proposed monitoring method, the concentration of the VOC is computed on the basis of responses of several sensors selected as the best ones for this purpose. Concentration is the average of output values of corresponding transfer functions. The assessment accuracy is estimated using the standard deviation of the mean. The use of a set of sensors for gas assessment offers more confidence in the accuracy of an obtained result.
Results and Discussion
In view of the configuration of the proposed method to monitor particular target compounds in a predictable range of measurement conditions, the following issues were considered:
• the choice of best sensor signal feature; • the selection of best sensors in a sensor array; • the robustness of VOC concentration assessment to the variable humidity of a gas sample.
Figure 4 shows a semiconductor sensor signal typically obtained during gas sample measurement. Its shape is related to the adopted mode of a sensor operation. The essential elements of the sensor signal, that is, the subsequent regions of an increase, stabilization, and a decrease correspond to distinct phases of the measurement cycle.
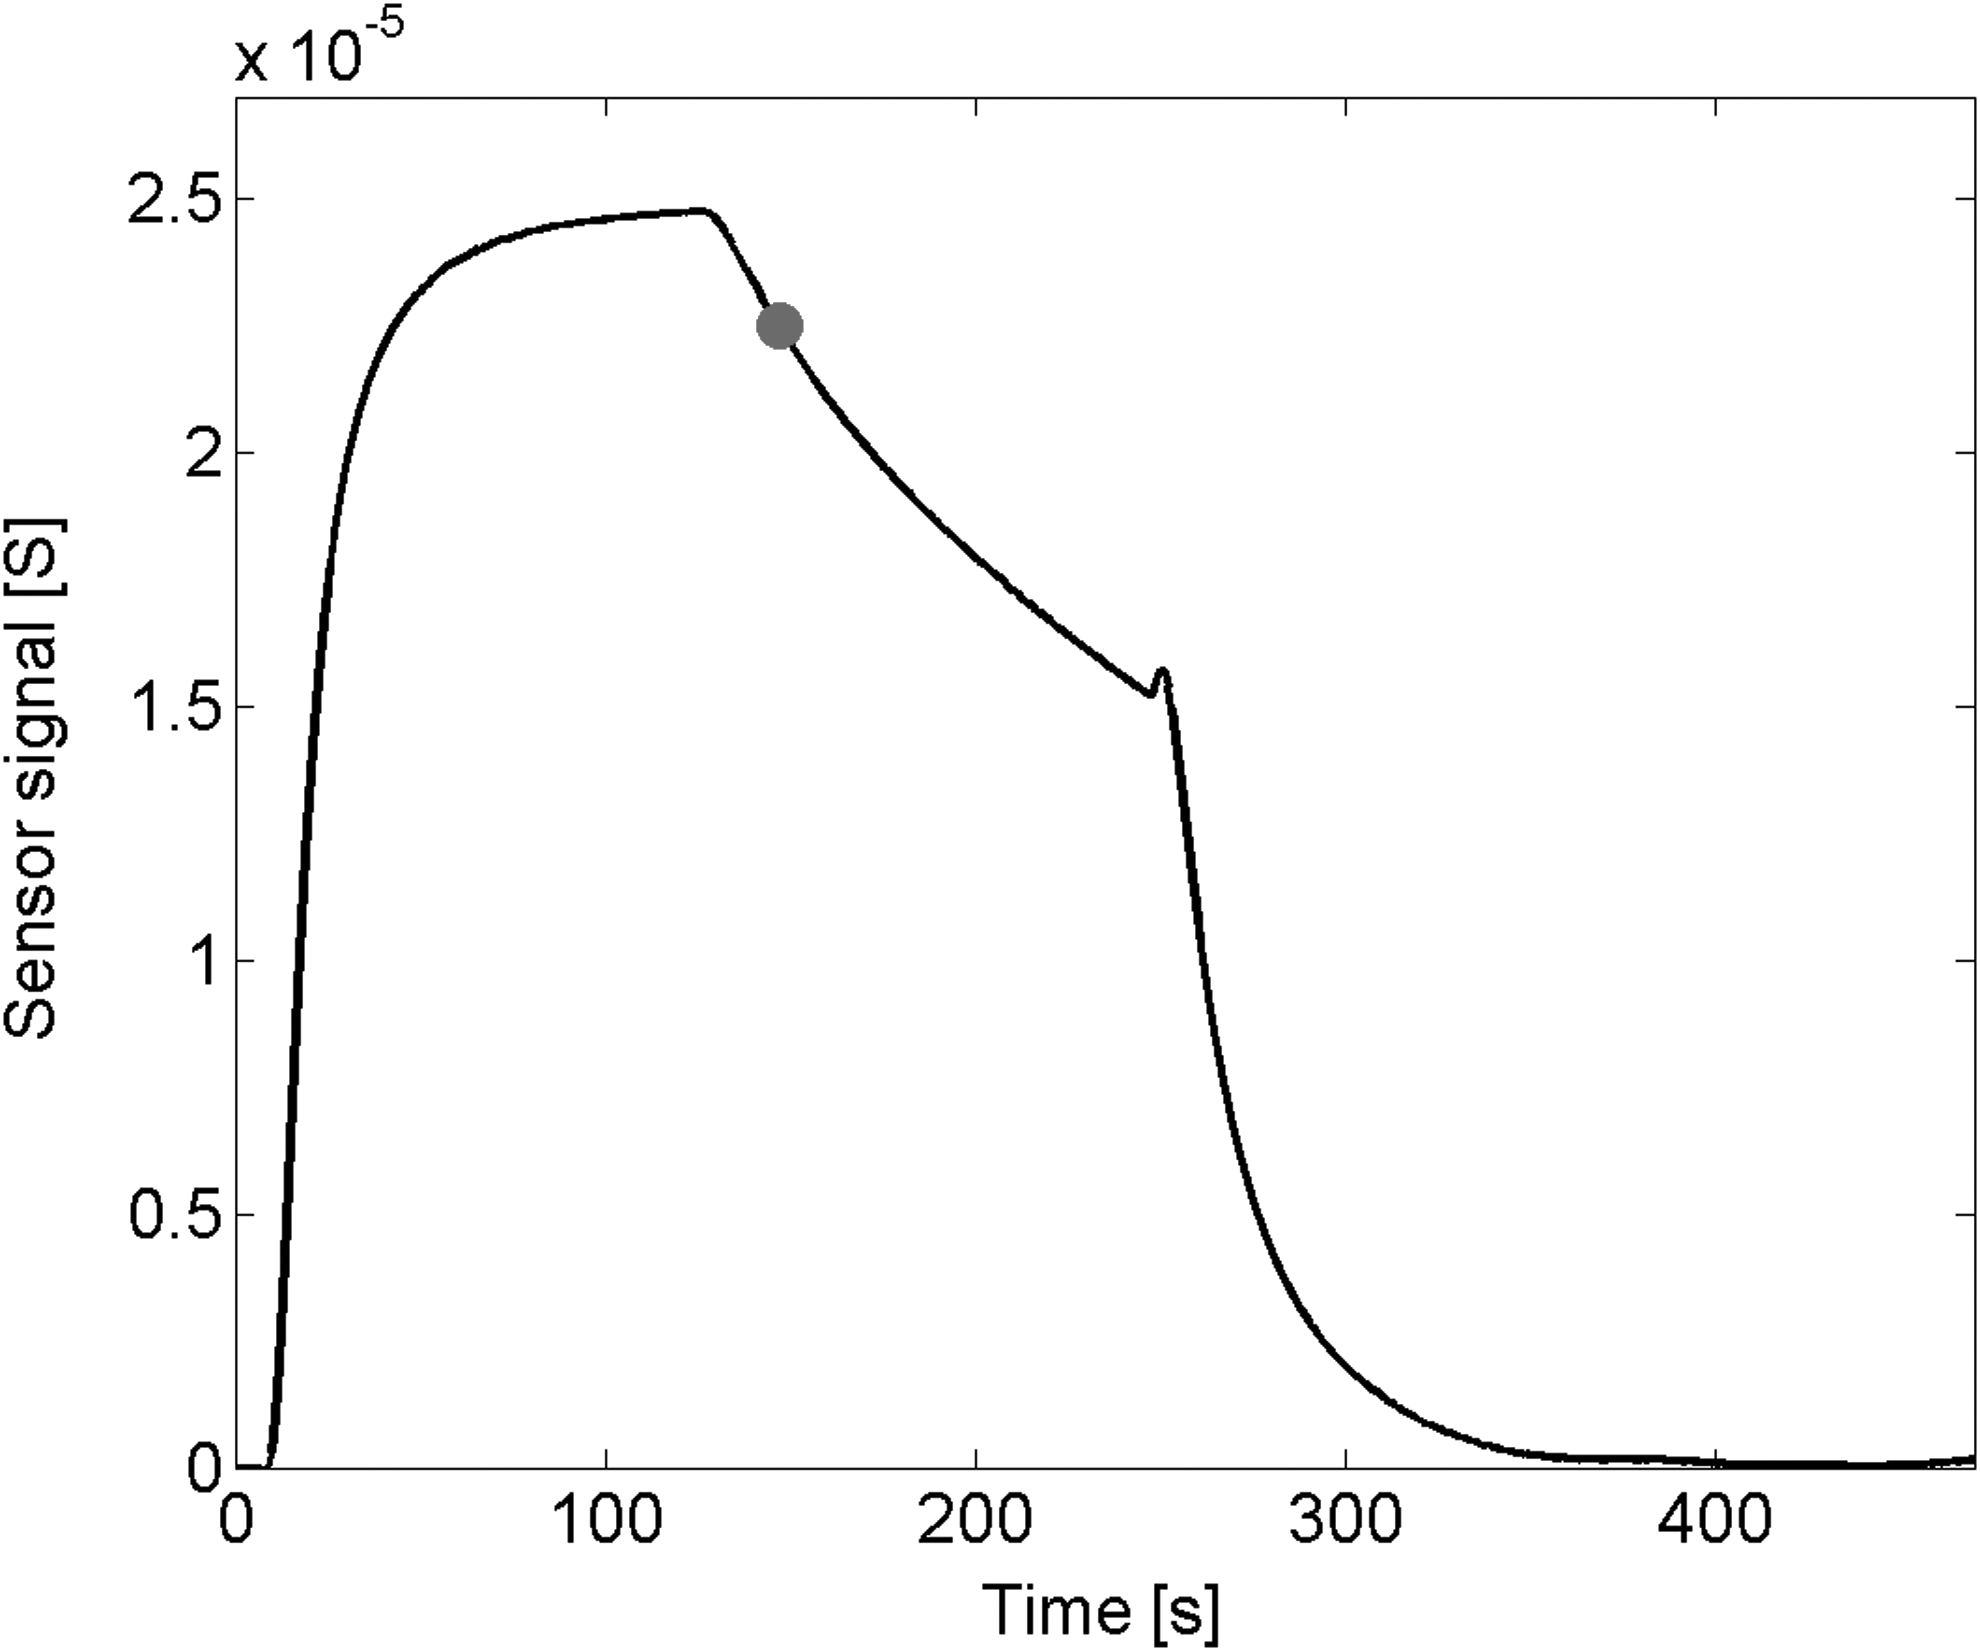
Sensor signal typical for the proposed gas sensing method. The dot indicates a sensor signal feature selected for quantitative determination of benzene and toluene.
Figure 4 presents the sensor signal feature selected for VOC concentration assessment. The coefficients of determination for transfer functions using the feature as an input variable are shown in Table 2. The sensors listed in Table 2 were best suited for benzene and toluene concentration measurement.
The sensor method was calibrated using reference gas mixtures, which had the fixed water vapor content. We used 7 g/kg, which corresponds to the most frequently observed humidity of air. Table 3 shows the error of benzene and toluene concentration assessment in gas samples for various humidity levels. As demonstrated, the error was <8% in case the water vapor content varied between 4 and 10 g/kg. This range of humidity is likely to be encountered in real samples of air contaminated with VOCs.
The measuring range was 0–200 ppm.
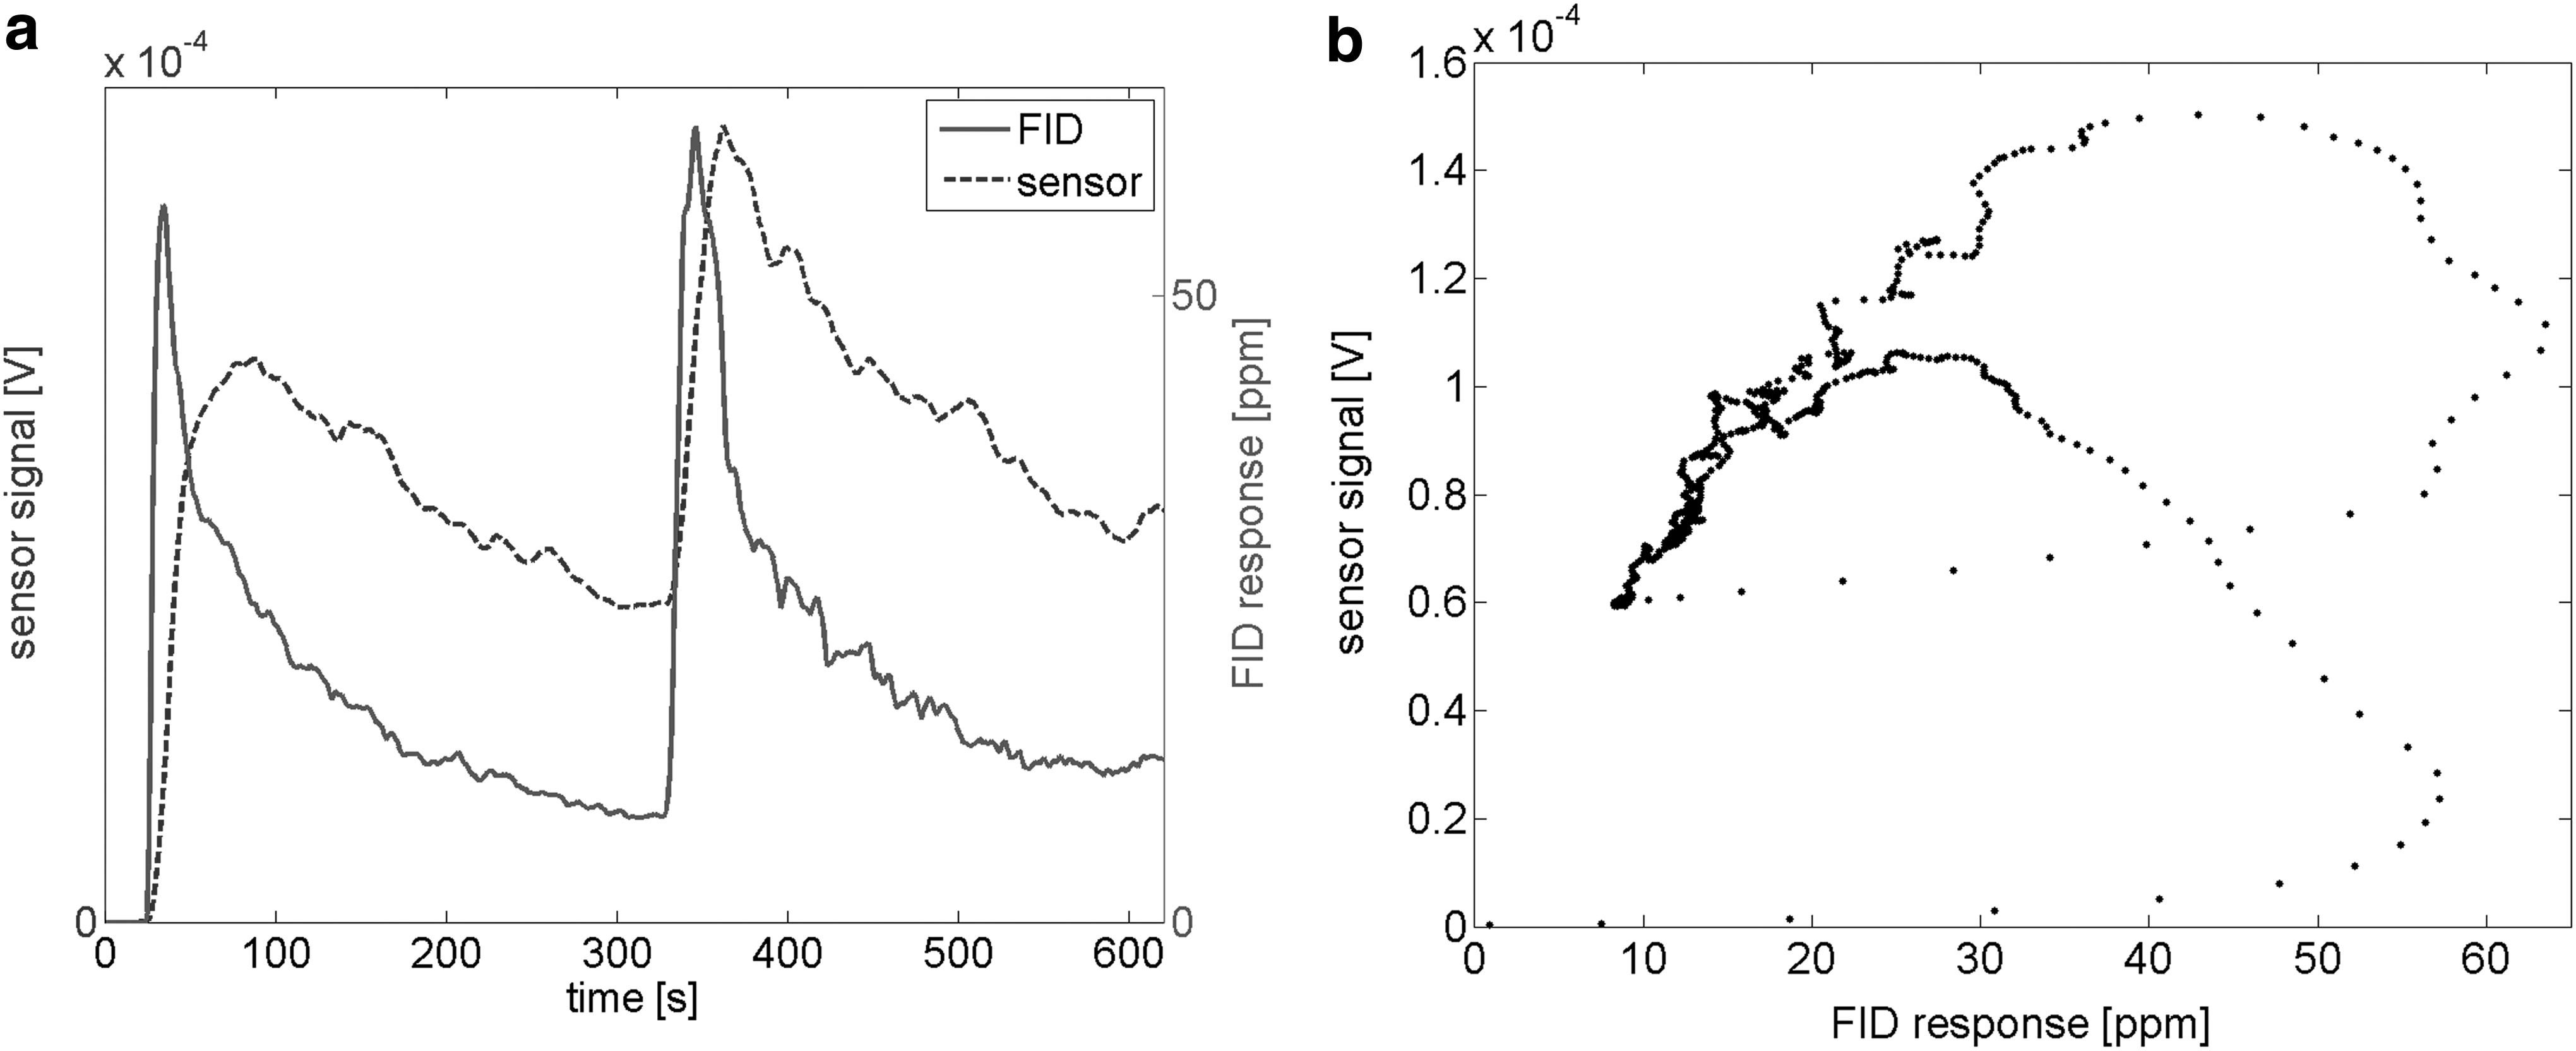
Results of the technological process monitoring based on semiconductor gas sensors are presented in Figure 5. They were compared with the measurement data delivered by the FID instrument. As demonstrated, the monitoring data linearly scale with the outcome of a reference method. It proves the consistency of the monitoring approach introduced in this article. Table 4 presents the concentration assessment errors. Based on them, the accuracy of the sensor method is satisfactory. The observed performance discrepancy when monitoring benzene and toluene could result from the different time that elapsed from the calibration. It emphasizes the importance of this procedure for the accuracy of measurement results.
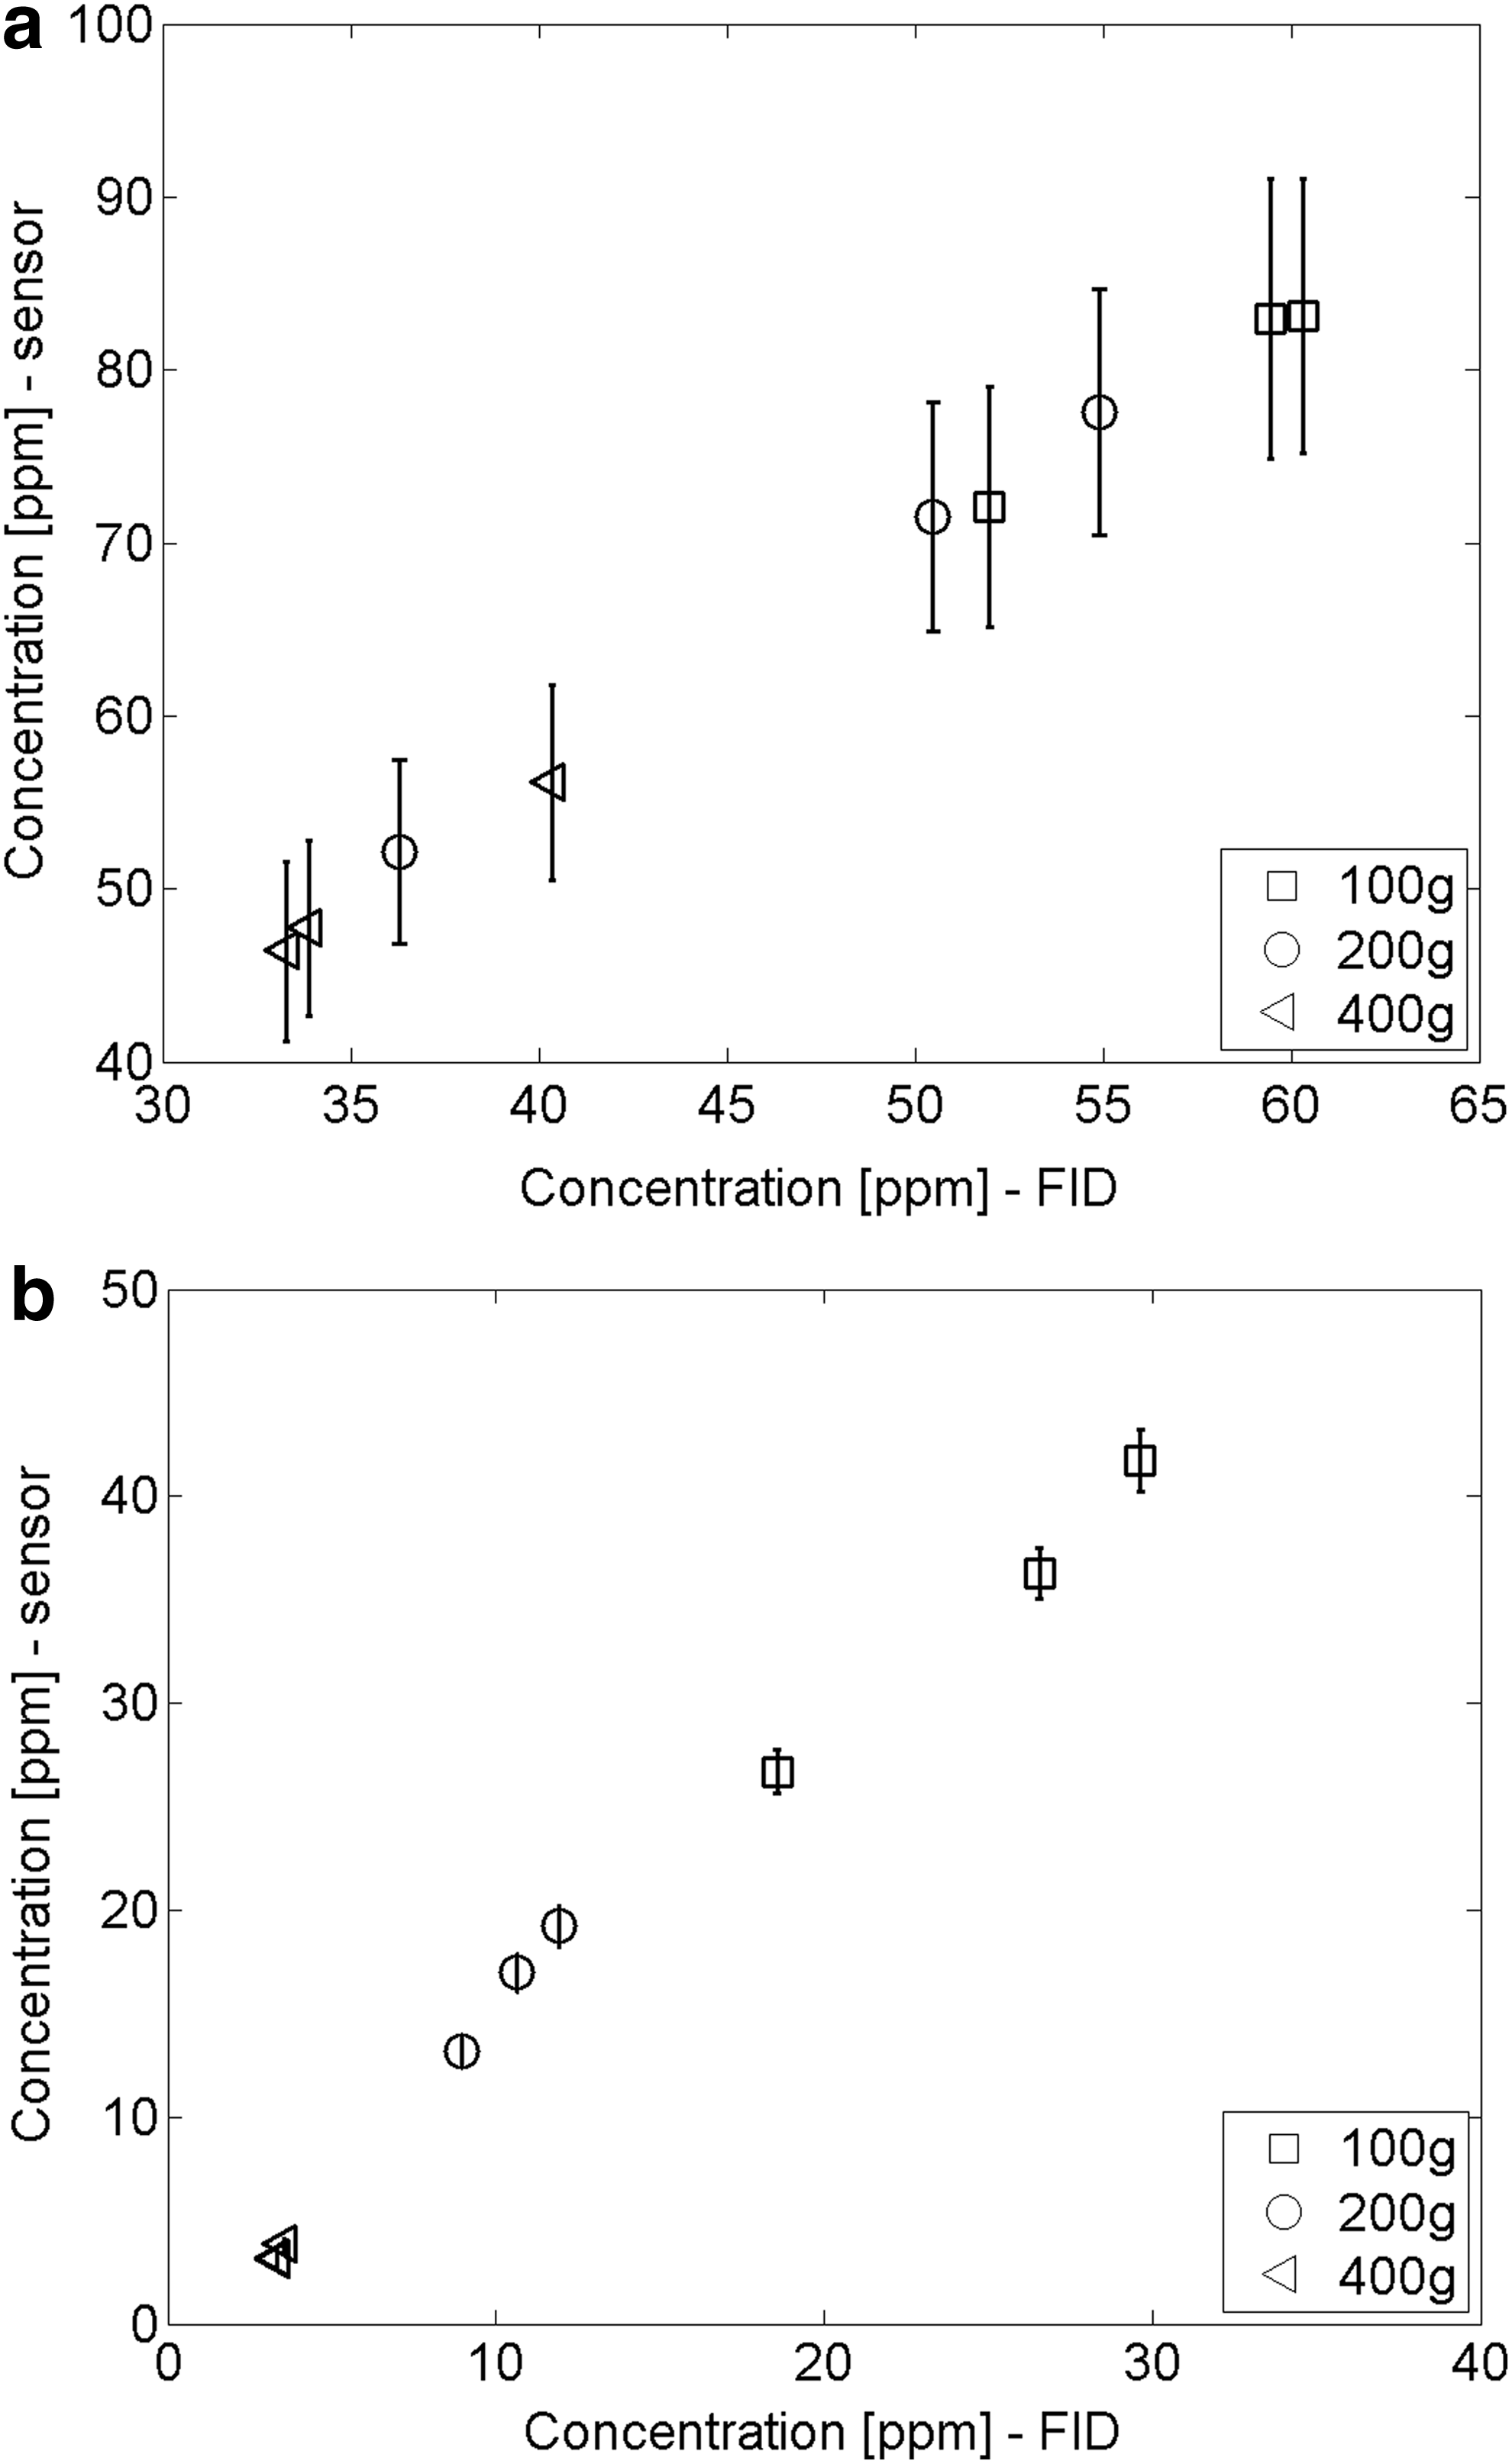
Results of
Conclusions
This work presented a method of VOC monitoring based on semiconductor gas sensors. The development of its concept was inspired by the examination of VOC emission during a real technological process. The method accounts for the shortcomings of continuous sensor measurements, which result from the sensor memory effect and unpredictable variability of VOC concentrations in the monitored environment.
The method involves dynamic short-term grab sampling, sensor exposure to a gas sample in a defined mode of operation, sensor signal recording, and data processing. The method provides the average concentration of the VOC over the sampling period. The measurement setup is uncomplicated and easy to automate. Sensor signal processing and data analysis are simple.
We have demonstrated that the method allows for determination of the VOC concentration with an error of several dozen ppm in air with variable humidity. The approach is suitable for at-line VOC monitoring in an industrial environment with the time resolution of several minutes.
Footnotes
Acknowledgments
This work was supported by the project “Detectors and sensors for measuring factors hazardous to environment – modeling and monitoring of threats,” POIG.01.03.01-02-002/08-00.
Author Disclosure Statement
None of the authors have commercial associations that might create a conflict of interest in connection with the submitted manuscript.
References
Supplementary Material
Please find the following supplemental material available below.
For Open Access articles published under a Creative Commons License, all supplemental material carries the same license as the article it is associated with.
For non-Open Access articles published, all supplemental material carries a non-exclusive license, and permission requests for re-use of supplemental material or any part of supplemental material shall be sent directly to the copyright owner as specified in the copyright notice associated with the article.