
Abstract
Abstract
Engineered nanomaterials (ENMs) increasingly used in commercial products can accumulate in biosolids. Land application of biosolids potentially leads to consequent exposure of ENMs to soils. This article examines the impact of ENM-amended biosolids on biological carbon dioxide production in soils. ENMs, including nano-silver (Ag), zinc oxide (ZnO), titanium dioxide (TiO2), and cerium oxide (CeO2), were applied to soils with dosages of 1 and 1,000 mg/kg, simulating the normal and high concentration exposure scenarios, respectively. Under dark conditions, 1,000 mg/kg of nano-Ag and ZnO exhibited inhibitory effects on aerobic carbon conversion in both a 28-day basal respiration test and a modified 24-h substrate-induced respiration (SIR) test. At 1 and 1,000 mg/kg levels, nano-TiO2 was found to be inert to carbon conversion in both respiration tests. Nano-CeO2 at 1,000 mg/kg exhibited an increased basal respiration rate (48% higher than in the control soil), but having a minimum inhibitory effect in the SIR test. Single particle-inductively coupled plasma–mass spectrometry was used to determine the presence of nano-sized particles in water extracted from soils after 28 days of respiration test. Soils treated with nano-TiO2, CeO2, and Ag released<1% of nanoparticles into the extracted water, while the majority of ENMs were still retained in the soil. Nano- and micron-sized particles containing zinc were not detected even in soils treated with 1,000 mg/kg of nano-ZnO. The findings of this article will inform scientific and regulatory communities about the potential effects of ENMs on microbial respiration in biosolid-amended soils.
Introduction
E
Many ENMs used in commercial products are released into the wastewater stream as a result of everyday domestic and industrial activities (Benn and Westerhoff, 2008; Gottschalk et al., 2009). Only a small fraction of the ENMs is discharged into surface waters in treated effluents. Most ENMs accumulate in biosolids generated during wastewater treatment processes in publicly owned treatment works (Kiser et al., 2009, 2012). For example, more than 96% of the titanium dioxide (TiO2) nanoparticles entering a wastewater treatment plant end up in biosolids (Kiser et al., 2009). Of the 7 million dry tons of biosolids produced each year in the United States alone, more than 40% are land applied (USEPA, 2009), which is the reason why it is believed that future land application of biosolids can lead to exposure of soils to ENMs (Nowack and Bucheli, 2007; Mueller and Nowack, 2008; Gottschalk et al., 2009). The already substantiated concerns of the scientific and regulatory communities about the safe use of ENMs are further augmented by the absence of relevant data on the environmental implications of these activities.
Recent studies suggest that accumulation of ENMs in soils could affect microorganism activity and diversity. For example, nano-zinc oxide (ZnO) has the potential to damage Cupriavidus necator, a common bacterium found in soil, and, consequently, to increase its mortality rate even though this microorganism is resistant to high concentrations of heavy metals (Vos et al., 2009; Neal et al., 2011). A single dose of nano-Ag-amended biosolids at 140 μg Ag/kg soil can lead to 32% lower biomass in terms of Microstegium vimeneum (Colman et al., 2013). A combination of three ENMs, silver, copper, and silica (each at 0.022% w/w), has the capacity to reduce the carbohydrate and amino-acid utilization rates of dominant microorganisms, and, as a result, impact the microbial balance in soils (Kumar et al., 2012). Addition of ZnO and TiO2 nanoparticles to soil at concentrations in the 0.5–2.0 mg/g range has reduced microbial biomass and changed the microbial diversity (Ge et al., 2011, 2012). Nano-Ag at concentrations of 32 and 320 μg/kg significantly decreased microbial biomass in soils (Hänsch and Emmerling, 2010). Although these studies demonstrate the bactericidal effects of ENMs found in common commercially available nano-enabled products, very little is known about ENM impacts on the metabolic activity of soil microorganisms, especially when the soil is amended with biosolids.
The goal of this study is to examine the effects of ENMs, commonly used in nano-labeled products, on the metabolic activity of microorganisms in biosolid-amended soils. The overarching hypothesis is that ENMs commonly incorporated into commercially available nano-enabled products reduce the biological carbon conversion of microorganisms (e.g., organic matter to gases) in biosolid-amended soils. To address this hypothesis, (1) soil from an agricultural site in Arizona was amended with biosolids containing one of four types of ENMs (TiO2, ZnO, CeO2, and Ag); (2) basal respiration and substrate-induced respiration (SIR) rates were examined; and (3) the effects of metabolic activities on nanoparticle concentration and morphology were assessed with scanning electron microscopy (SEM) and energy-dispersive X-ray spectroscopy (EDX). Amounts of water-soluble metals and ENMs after long-term incubation tests were determined by extraction of soil with deionized (ultrapure) water. Inductively coupled plasma–mass spectrometry (ICP-MS) and single particle-ICP-MS (sp-ICP-MS) were applied to quantify the concentration and size distribution of ENMs in the aqueous phase.
Experimental Approach
Sources and characterization of ENMs
Four different types of ENMs were used in this study. Nano-silver stabilized with 0.06% polyvinyl alcohol (PVA; Sigma-Aldrich, Saint Louise, MO) was synthesized with modifications from the published method (Yang et al., 2012). The hydrodynamic diameter of nano-Ag was ∼25 nm as determined by phase analysis light scattering (ZetaPALS; Brookhaven Instruments Corporation, Holtsville, NY). Aeroxide® P25 (Degussa) containing an 81/19% anatase/rutile TiO2 crystal structure mixture was obtained from Evonik Degussa Corporation (Theodore, AL), which was characterized by TEM with an average particle size of 42 nm in a previous work (Weir et al., 2012). Nano-cerium (IV) oxide (CeO2) with reported average sizes of 35 nm (confirmed by sp-ICP-MS, data was not shown) was obtained from Alfa-Aesar (Ward Hill, MA). Nano-ZnO with a reported average size of 30 nm was obtained from Sigma-Aldrich, with an averaged hydrodynamic diameter of 35 nm determined by ZetaPALS. Gold nanoparticles with a diameter of 60 nm from the National Institute of Standards and Technology (NIST) were used as reference nanoparticle standards for sp-ICP-MS.
Soil microcosm and experimental design
Bulk (0–10 cm depth) soil was collected from agricultural fields at the University of Arizona Maricopa Agricultural Center. This soil is classified as Casa Grande sandy clay loam (fine loamy, mixed, and hyperthermic Typic Natrargids), with relatively low organic matter (0.5%) and cation-exchange capacity (10.6 cmol/kg) (Post et al., 1988). Since the University of Arizona acquired this property in 1983, no biosolids have been applied to the field used for soil collection for this project. Visible rocks, roots, and fresh litter were removed from the soil. Air-dried soil samples were passed through a 2-mm sieve, archived in a Ziploc bag, and refrigerated at 4°C until laboratory analyses. The water content of the soil samples was 1.65% by mass, as determined by drying in an oven at 105°C for 24 h (APHA et al., 2005). Air-dried soil samples of 10 g were well mixed with 10 mL of ultrapure water, and the pH of this mixed slurry was 6.1. Clean sludge slurry (ENM free) with 2% total solid content and a chemical oxygen demand of 2,000 mg/L was obtained from a laboratory-scale sequencing batch reactor that was continuously operated for synthetic municipal wastewater treatment (Wang et al., 2012).
To simulate land application of biosolids enriched with ENMs, each targeted ENM (TiO2, ZnO, CeO2, and Ag) was mixed with 5 mL of clean sludge slurry for 2 h, before its introduction to soil. The ENM-sludge mixed slurry was added to 40 g of soil in a 250-mL sterile glass bottle to create an experimental microcosm. This study represents the direct application of biosolids to soil without storing the biosolids for months; the long-term storage of biosolids, on the other hand, could alter the property of ENMs and, therefore, represents another scenario of study. The final concentrations of ENMs in soils were 1 mg/kg dry soil (model estimated concentration range) and 1,000 mg/kg dry soil (high dose range), which were chosen on the basis of model estimation and previous reports (Meyer et al., 2009; Ge et al., 2011). Microcosms consisting of 40-g soil and clean sludge without any ENMs were used as controls. The nine treatments included the control, soils with nano-Ag (1 and 1,000 mg Ag/kg dry soil), soils with nano-titanium dioxide (1 and 1,000 mg TiO2/kg dry soil), soils with nano-zinc oxide (1 and 1,000 mg ZnO/kg dry soil), and soils with nano-cerium oxide (1 and 1,000 mg CeO2/kg dry soil). All tests were conducted in triplicate, including the controls. Before tests began, the water content in each microcosm was adjusted to 25% by mass by adding ultrapure water, which was comparable with published research with 18% water-soil content (Ge et al., 2011). All bottles were sealed with a rubber stopper and aluminum clamps to prevent emission of carbon dioxide generated from soils. Microcosms were incubated at 20°C in the dark, and all bottles were covered with aluminum foil to avoid algal growth and photo-induced reactions. Tests lasted for 28 days as recommended (OECD, 2000).
Basal and SIR tests
To evaluate the long-term effects of ENMs on microbial activity, the basal respiration rates of soils were determined by measuring the carbon dioxide concentration in the airspace of each bottle every 3 days. Periodically, 1 mL of air was sampled and directly analyzed by gas chromatography (GC) coupled with a thermal conductivity detector (GC 2010; Shimadzu, Kyoto, Japan). Detailed analysis procedures can be found in a previous report (Salerno et al., 2009). Each bottle was vented for 40 min after analyzing the CO2 in the bottle every 3 days, following a ventilation frequency from a previous publication as “vented for around 40 min every 3–4 days” (Ge et al., 2011). The air in the room where the respiration test was conducted was continuously vented at a rate of about 1 cubic foot per minute per square foot of the room. This continuous ventilation would facilitate the emission of carbon dioxide from the bottle. All bottles were re-sealed with a rubber stopper and aluminum clamps after venting. The basal respiration rate is the ratio of carbon in the form of carbon dioxide to the dry soil mass (mg C-CO2/g dry soil). Though the cumulative carbon dioxide concentration in the airspace of each bottle was not really a “rate” term (associated with a time unit), the carbon dioxide concentration in air space could be used to indicate the basal respiration rate, as the carbon dioxide concentrations were evaluated at the same time interval (i.e., every 3 days).
Modified SIR studies were conducted to assess the short-term impacts of ENMs on microbial activity (OECD, 2000; Ge et al., 2011). The assay of SIR study was modified from the OECD method (OECD, 2000). After 7, 14, and 28 days' incubation periods of the soil samples used in the basal respiration test, 5-g of soil was sampled out for SIR study from each of the nine treatments. Glucose solution was used to feed the 5-g soil sample, with a final concentration of 2 g glucose/kg dry soil (OECD, 2000), which also led to an increase of final water content as 62.5% by weight. All the samples with glucose were incubated at 20°C±2°C in a 125-mL bottle that was sealed with a rubber stopper and aluminum clamps. To keep the dark condition, aluminum foil was used to cover each bottle. The concentration of carbon dioxide in each airspace was measured every 2 h by GC for 24 h. The SIR rate was calculated by regression of the pseudo-linear range of cumulative carbon dioxide production curve (mg CO2 vs. hours) before reaching the plateau. In the first 14 h of SIR test on soil samples, the carbon dioxide concentration was under detection limit. Thus, we extended the period of SIR test to 24 h, and the SIR was calculated by regression of the pseudo-linear range of cumulative carbon dioxide from 16 to 22 h (the linear range during 24-h study). All respiration rates were normalized to the dry mass of soil (i.e., mg C-CO2/g dry soil/h).
Water extraction of soil and metal content analysis
Water extraction tests were conducted to determine the amounts of ENMs and metals that could be washed out of soil by runaway water. At the end of the 28-day basal respiration test, 5-g soil aliquots amended with the ENM-biosolid mixture were sampled and mixed with 10 mL of ultrapure water in a plastic bottle. The bottles were capped and agitated for a period of 12 h on a wrist-action shaker. The suspension was centrifuged at 3,000 rpm (F=978 G) for 5 min and filtered through a 0.45-μm filter (McBride et al., 1997). The filtrate was directly used in sp-ICP-MS analysis to determine whether ENMs were present in the extracted water. The total metal concentration in the filtrate was determined by acid digestion and ICP-MS analysis according to standard method 3030G (Yang et al., 2014).
Sp-ICP-MS analysis of ENMs in extracted water
To evaluate the concentration and size distribution of released ENMs in extracted water, the sp-ICP-MS technique was conducted using a Thermo Scientific™ X-series II ICP-MS instrument with a time-resolved signal reading in counts per second (cps) output. Dwell time (the time period for integration of one reading) was set as 10 ms. This dwell time was determined to be the optimum yielding satisfactory analytical data (Mitrano et al., 2012). The data processing method was based on transport efficiency determined (Pace et al., 2011) with NIST-standardized 60 nm gold nanoparticles being used as the reference nanoparticle standard. The sample flow rate was set at 0.6 mL/min, and the transport efficiency was determined to be 0.6%. All of the samples were diluted to the ng/L level before being introduced into the instrument. The raw data in the form of cps as a function of time were exported into a spreadsheet first and then further calculated with MATLAB (Version R2011b; Mathworks, Natick, MA).
The minimum detectable size of sp-ICP-MS is dependent on multiple factors, including the instrument conditions, the analyte-specific background noise, and the nanoparticle composition. The sp-ICP-MS has different size detection limits with different types of nanoparticles. The minimum detectable size of nano-Ag is about 18 nm. The minimum cutoff sizes are ∼10 and 70–80 nm for nano-CeO2 and TiO2, respectively, with a threshold of thrice the standard deviation of the background based on multiple tests in our study (Laborda et al., 2011).
Characterization of ENMs in soil by SEM
Samples were dried and ground to powder in a mortar and pestle. Sample aliquots of 0.2 g were suspended in 5 mL of ultrapure water and sonicated in a water bath for a period of 1 h. After sonication, slurry aliquots of 0.5 mL were diluted with 25 mL of methanol (99.8%, ACS Grade; VWR International, Brisbane, CA) and one to two drops of the resultant suspension were placed onto the surface of an electron microscopy stub. The samples were air dried at room temperature (22°C) before electron microscopy. A focused ion beam/scanning electron microscopy (Nova NanoLab™) equipped with an EDX system was applied to characterize the ENMs mixed with biosolids. SEM equipped with an EDX system (Philips XL30-EDAX) was used to locate and characterize ENMs in soil samples.
Statistical analysis
Statistical analysis was conducted by the software SPSS 11.5 for Windows (SPSS, Inc., Chicago, IL). All comparisons were made between the control sample and the different treatments with ENMs in all the tests. For basal respiration test (data in Fig. 1), two-way ANOVA was conducted with post-hoc analysis using least-significant difference (LSD) test. In two-way ANOVA analysis, each treatment was compared with the control in terms of treatment, time, and time×treatment (degree of freedom was satisfied for triplicate data). For other comparisons with the control (data in Figs. 2 and 4), one-way ANOVA analysis was performed using post hoc test (LSD), and there was no correction made for multiple comparison. To address the normality of data, the normality of all the data involved in one-way ANOVA or two-way ANOVA was examined on Shapiro–Wilks W test. For comparison on non-normal data, Kruskal–Wallis nonparametric ANOVA was conducted. All the data involved in ANOVA analysis satisfy the assumption of homogeneity of variances tested by Lavene's test. The significant level in all the analysis was assigned as 0.05.
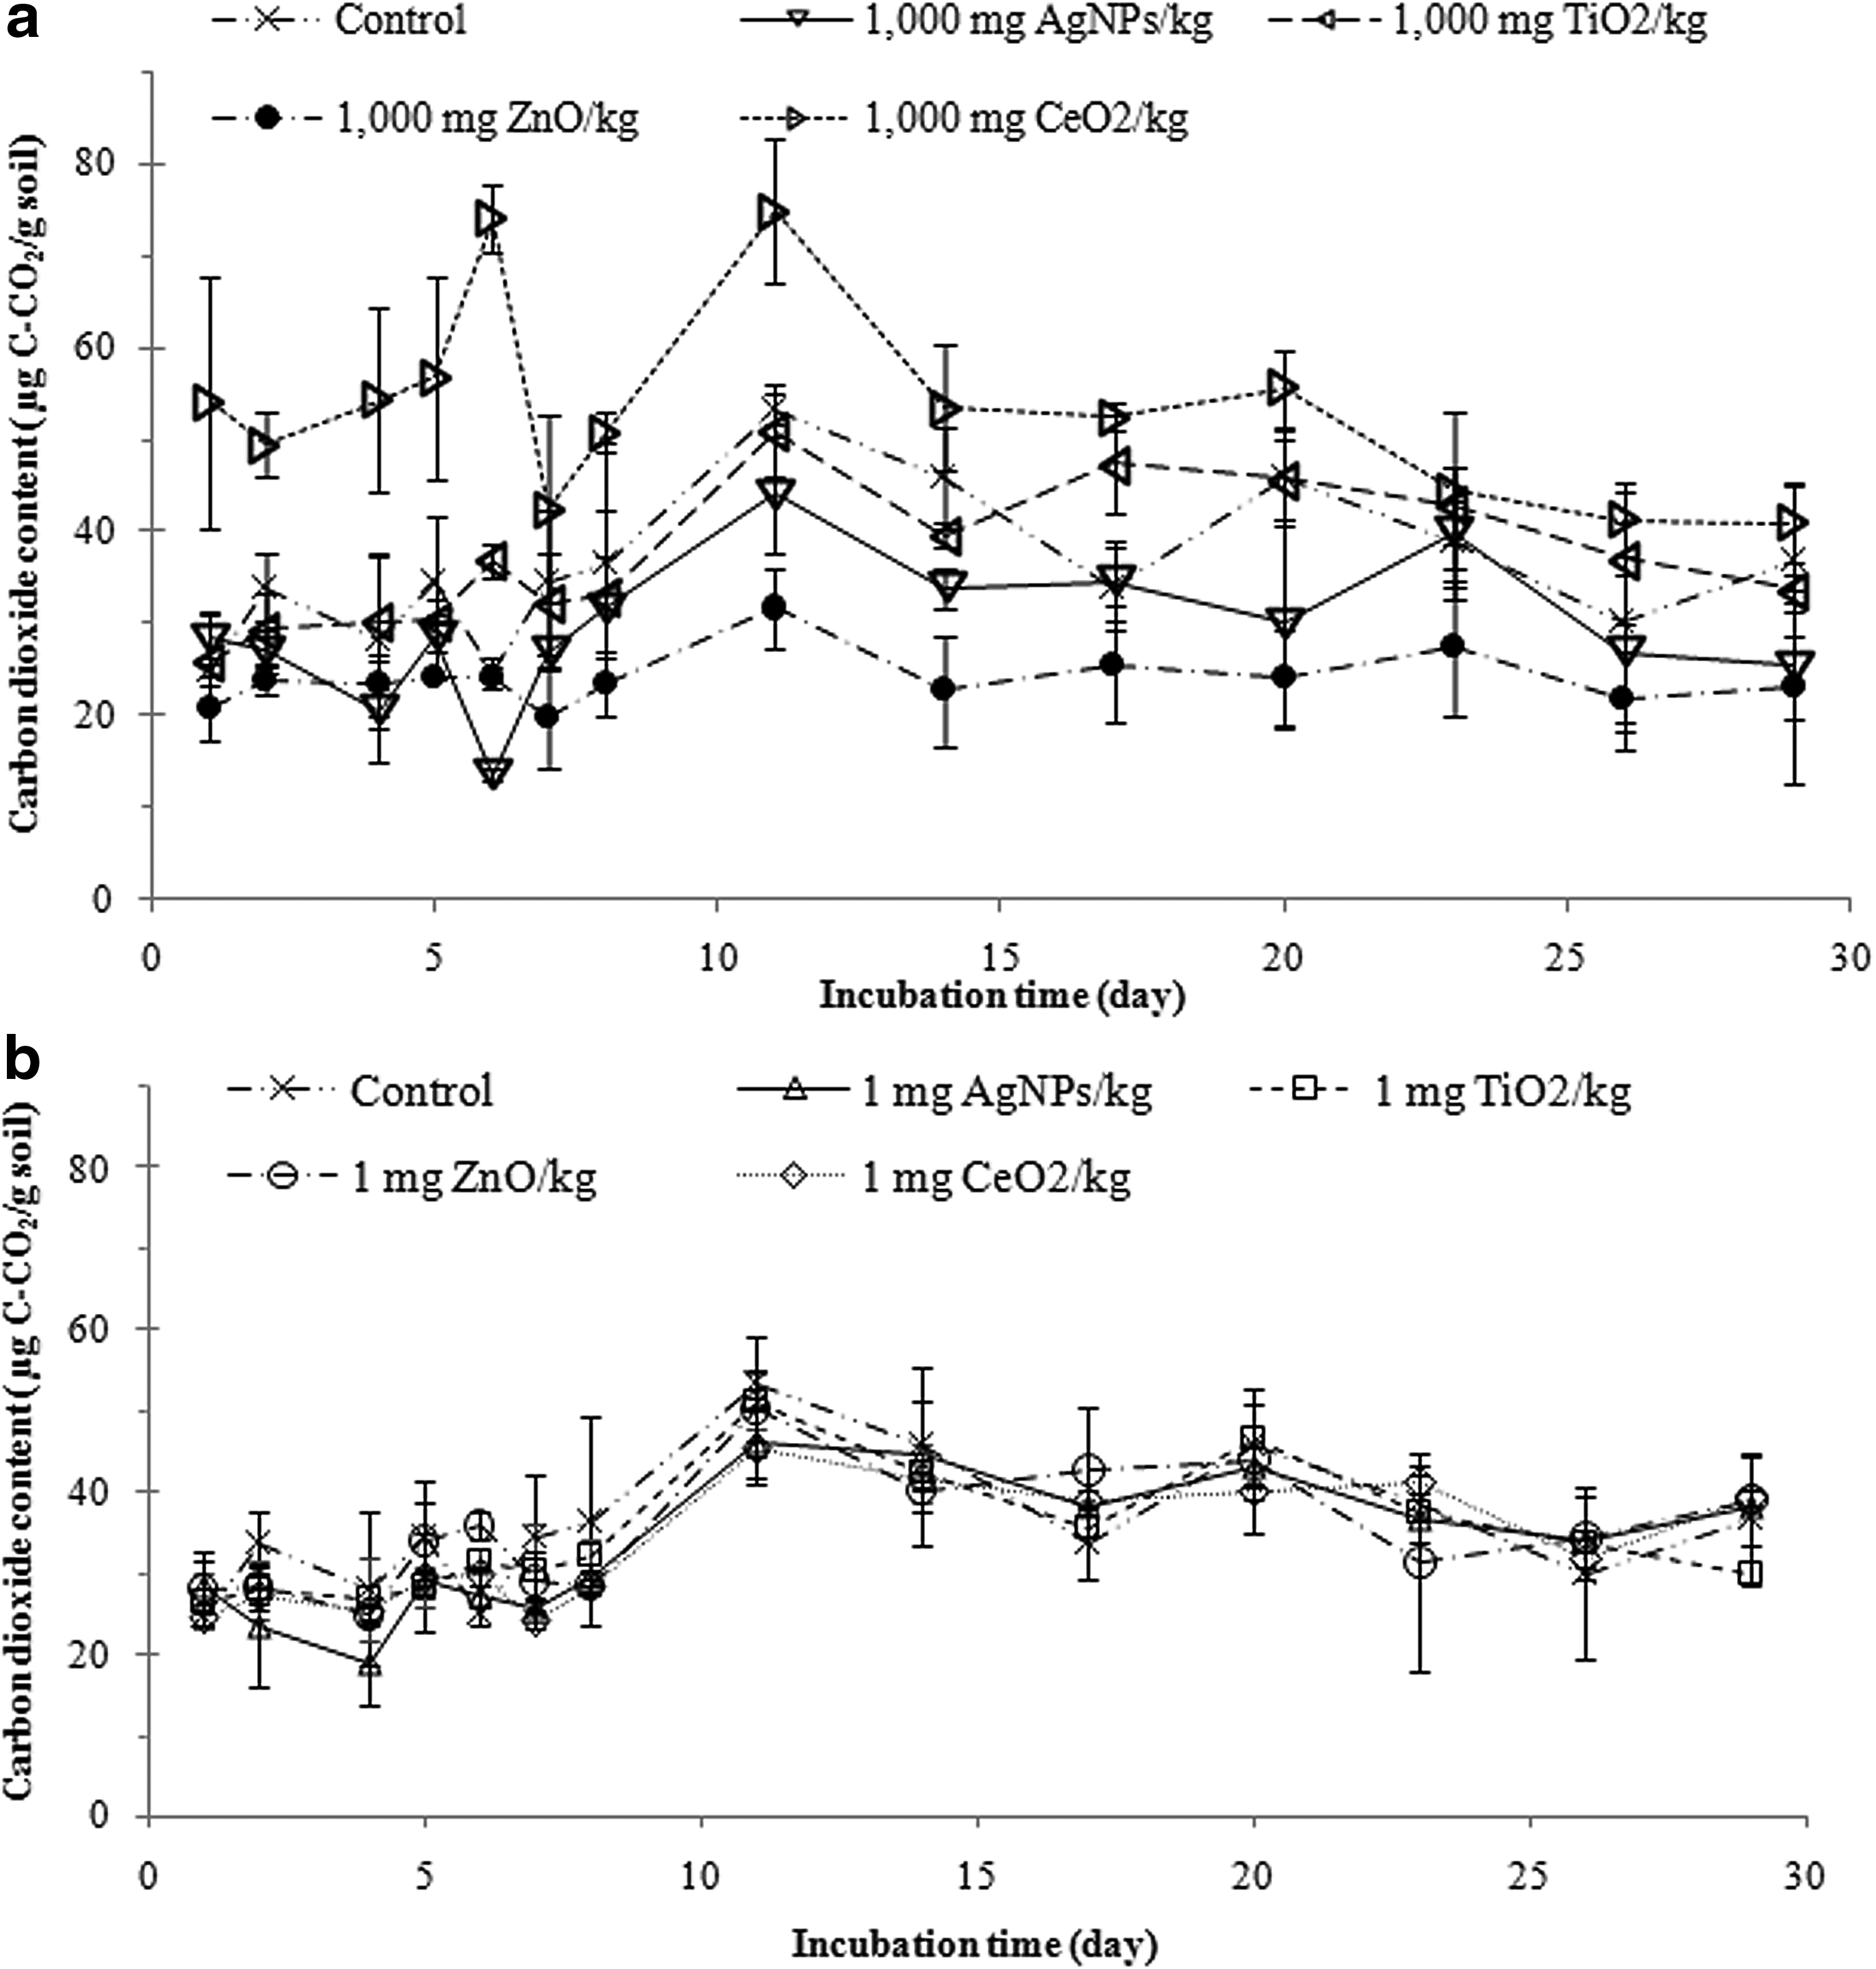
Carbon dioxide content (μg C-CO2/g soil) in soils containing 1 or 1,000 mg/kg of different types of engineered nanomaterials (ENMs) (nano-Ag, TiO2, ZnO, and CeO2) during basal respiration test.
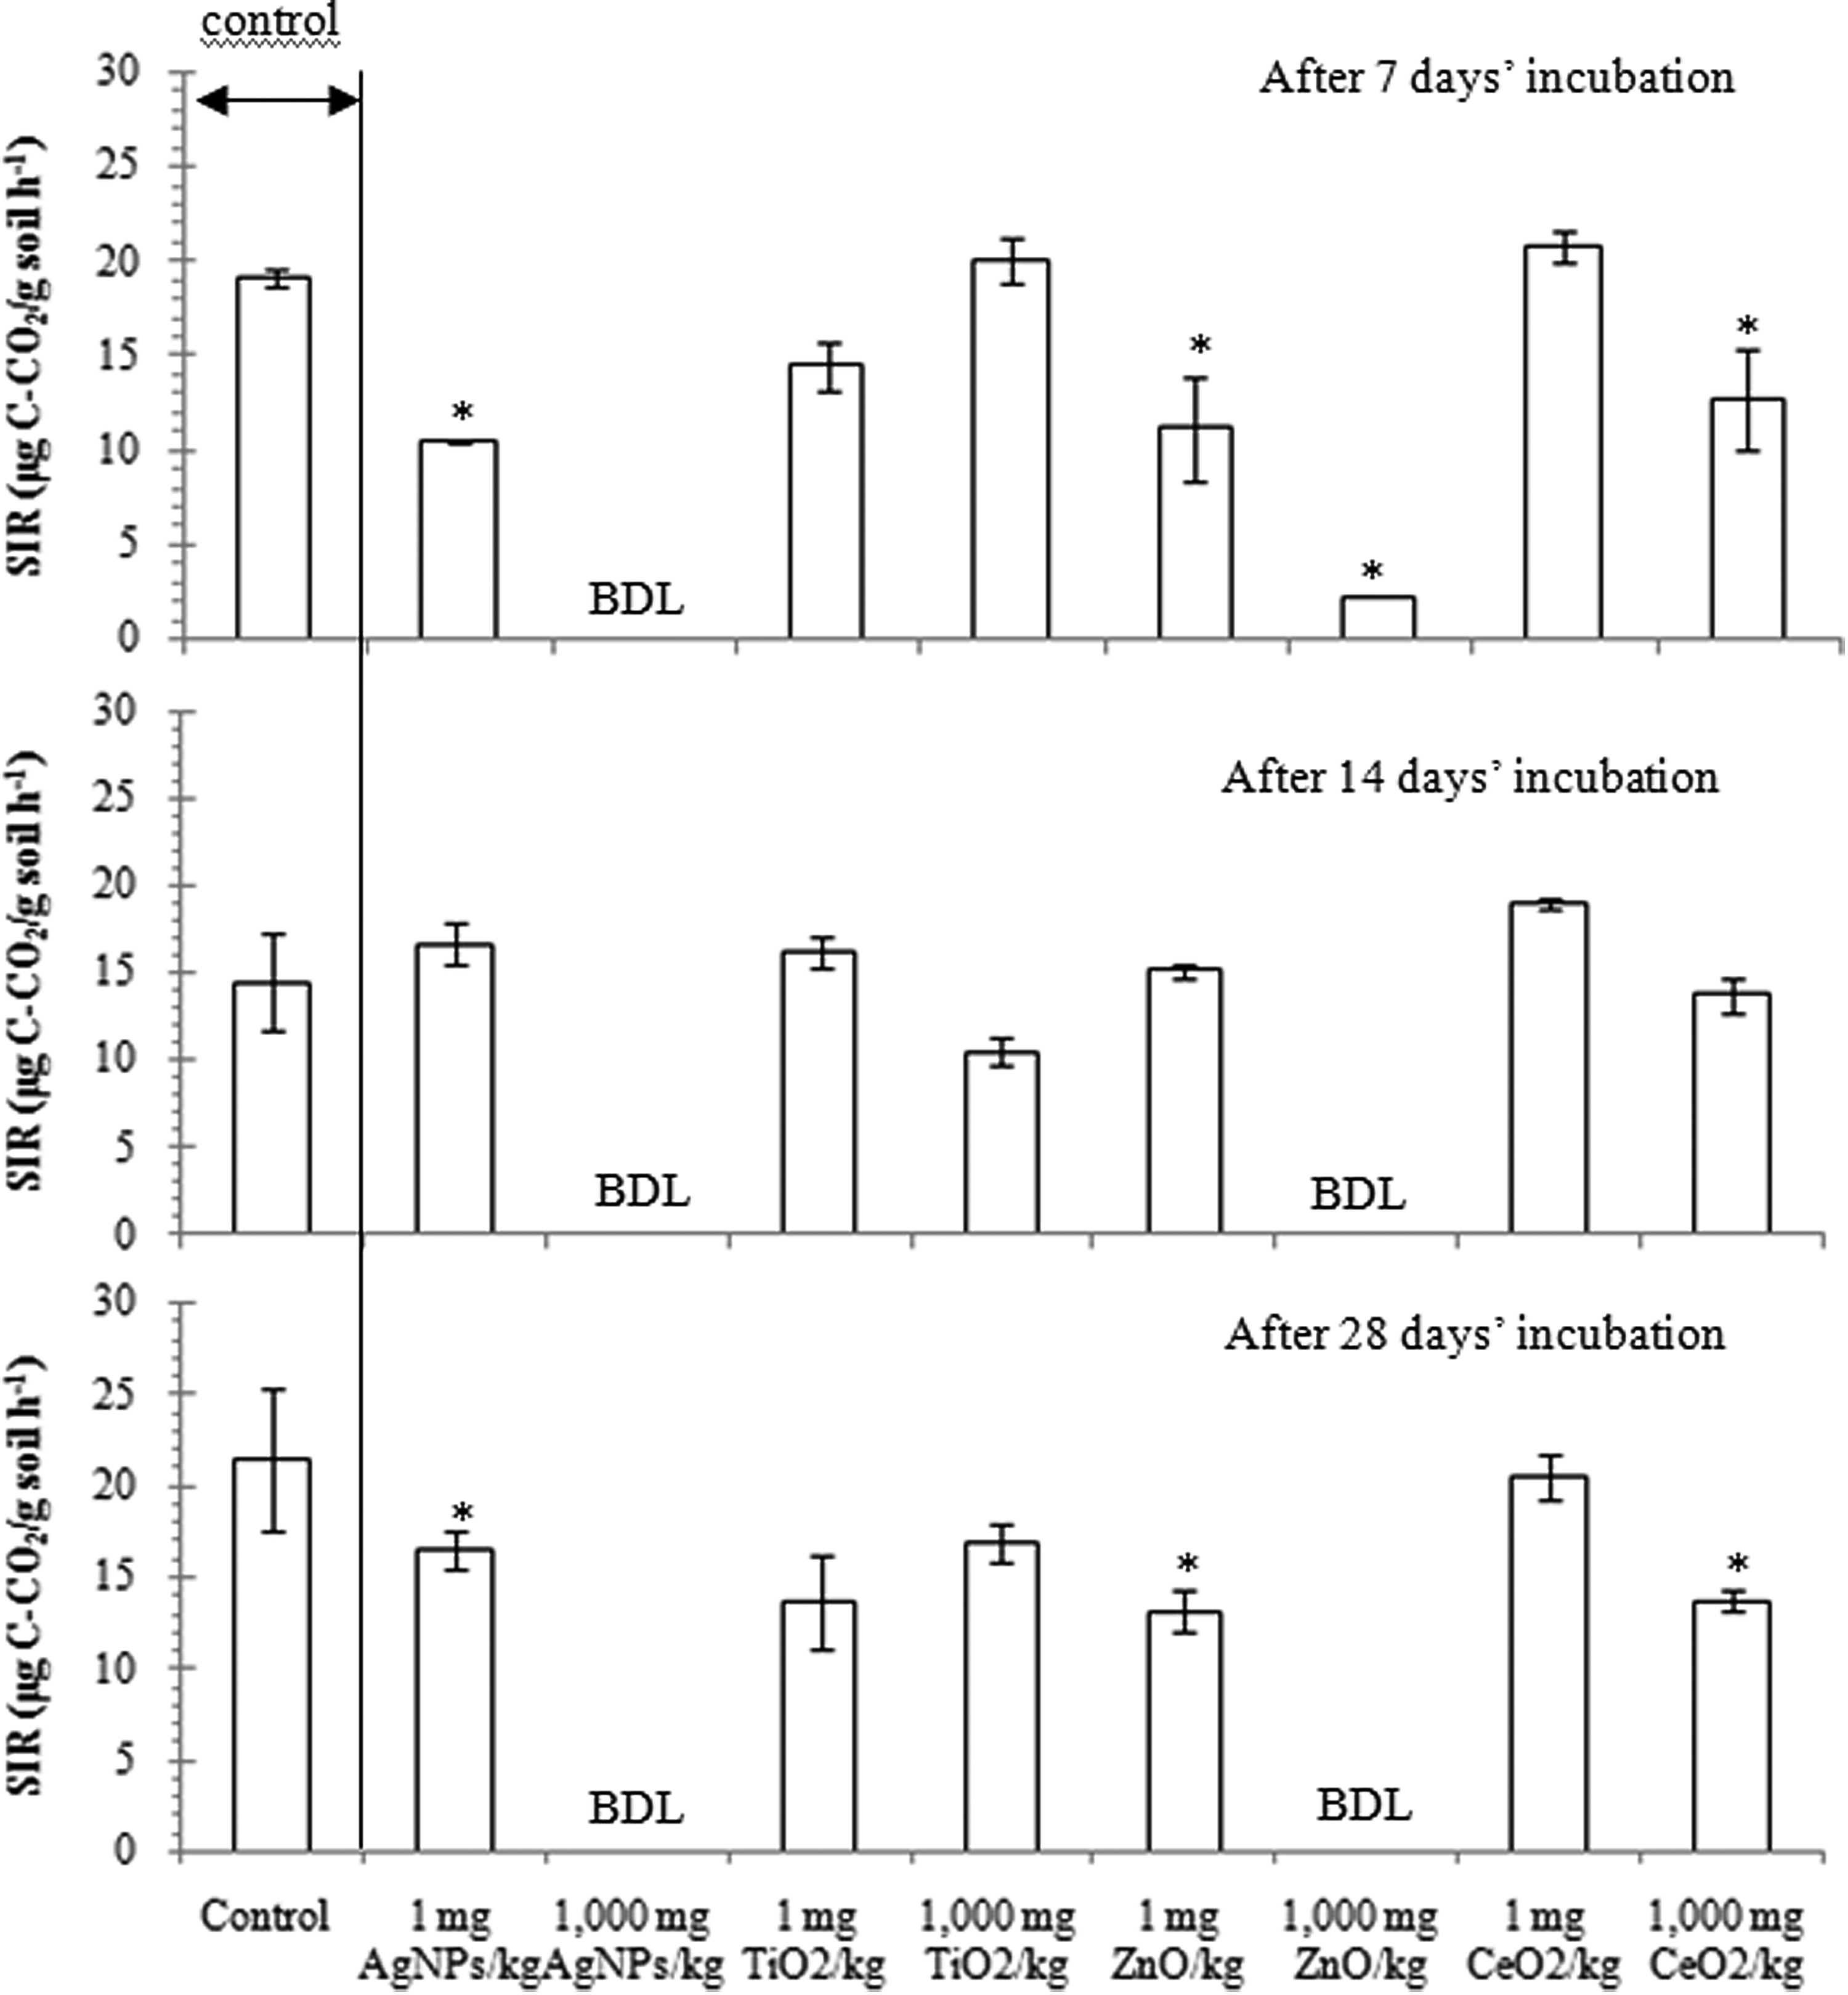
Test of substrate-induced respiration (SIR) on soils with ENMs after different incubation time. Error bars indicate standard deviation of triplicate experiments. BDL stands for below detection limit. * indicates the significant difference when compared with the control (α=0.05).
Results
Effects of ENMs on basal respiration in soils
The (28-day) basal respiration of soil represents the activity of microorganisms without additional substrate, and results are depicted in Figure 1. Two-way ANOVA analysis showed that there was no significant effect of interaction from time×treatment (all the p-values in this analysis are listed in Supplementary Table S1). At a concentration of 1 mg ENMs/kg dry soil (simplified as mg/kg unless specified in this article), none of the ENMs significantly affected carbon dioxide generation during the 28-day incubation period. Similarly, nano-TiO2 at 1,000 mg/kg did not affect carbon dioxide generation. However, carbon mineralization in soil samples exposed to 1,000 mg/kg nano-Ag, ZnO, and CeO2 showed ENM-specific responses. Averaged across the entire 28-day period (averaged value of a series of 3-day accumulated-CO2), soil-respired carbon dioxide in soils treated with 1,000 mg/kg nano-ZnO and Ag was 29±7 and 24±3 μg C/g soil, respectively, which was significantly lower than in the control (36±8 μg C/g soil), thus indicating inhibitory effects. In contrast to other ENMs, the addition of 1,000 mg/kg nano-CeO2 significantly increased carbon dioxide production in the soil to 53±10.3 μg C/g soil.
Effects of ENMs on SIR in soils
Findings from the 24-h SIR tests evaluated the effects of ENMs on soil with abundant substrate, as presented in Figure 2. The soils exposed to 1,000 mg/kg nano-Ag and ZnO experienced much lower or no microbial respiration in all three batch tests, indicating significant inhibition on the respiration of microorganisms in soils. Nano-Ag and ZnO at 1 mg/kg yielded lower SIR rates than the control on day 7 and 28, and SIR rates on day 14 were similar, showing that both nano-Ag and ZnO at 1 mg/kg could be either inhibitory or inert to microbes in soils. Nano-CeO2 at 1 mg/kg had SIR rates similar to the control for all three tests, representing inert effects in SIR tests. After 7 and 28 days' incubation, soils with 1,000 mg/kg of nano-CeO2 had significantly lower SIR than the control (p=0.02, p=0.03 for days 7 and 28, respectively); after 14 days, soil with 1,000 mg/kg of nano-CeO2 and the control were not significantly different (p=0.69). Overall, the addition of 1,000 mg/kg of nano-CeO2 exhibits a potential to inhibit microorganisms in the presence of enriched substrates. Nano-TiO2 at 1 and 1,000 mg/kg did not affect the SIR rates, and, thus, it could be considered an inert material in the SIR test.
Presence of released ENMs in soils after long-term incubation
The sp-ICP-MS analysis revealed no detectable particles containing zinc in the filtered water extracts of both control and ENM-enriched samples. Similarly, no particles containing Ag were detected in filtrates from control soil and soil exposed to 1 mg/kg of nano-Ag. However, nanoparticles containing Ag ranging from 25 to 50 nm in size were identified in filtrate from soil exposed to 1,000 mg/kg of nano-Ag (Fig. 3). Nano- and micron-sized particles containing TiO2 were identified in filtrate from the control soil and the soil exposed to 1 or 1,000 mg/kg nano-TiO2 (Fig. 3). The size distribution profiles of these three treatments were similar, with more than 90% of particles being in the 70–100 nm range and the rest ranging from 100 to 200 nm. Particles associated with CeO2 ranged from 10 to 60 nm in the control soil and in the soils treated with 1 or 1,000 mg/kg nano-CeO2. In summary, soils exposed to ENMs, including nano-Ag, CeO2, and TiO2, have the potential to release ENMs to the environment via rainfall or groundwater. Noticeably, all the silver particles detected were above the minimum detectable size (i.e., 18 nm) for Ag. For nano-TiO2 and nano-CeO2, it was possible that particles existed below the size detection limit (i.e., cutoff size, 10 nm for nano-CeO2, and 70–80 nm for nano-TiO2, respectively).

Size distributions of nano- and micron-sized particles as TiO2-eqivalent (eq), CeO2-eq, and Ag-eq in filtrate of water extracted from control soil, soils with 1 or 1,000 mg/kg of nano-TiO2, nano-CeO2, or nano-Ag, respectively. Analysis was conducted by single particle (sp)-inductively coupled plasma (ICP)–mass spectrometry (MS). The sp-ICP-MS has different size detection limits with different types of nanoparticles.
Metal contents in the water extracted from soils
Figure 4a shows the dose-dependence profiles of the water extracts. The mass of Zn extracted in water from the control soil and the soils exposed to 1 and 1,000 mg/kg nano-ZnO were 0.068, 0.18, and 0.31 mg Zn/kg soil, respectively. The total mass of Ag was about 0.02 mg Ag/kg soil in water extracted from either the control soil or soils treated with 1 or 1,000 mg/kg of nano-Ag. All of the silver detected was ionic silver except for 10% in particle form in the 1,000 mg/kg nano-Ag treatment. The soluble Ti concentrations in water extracted from control soil and soils with 1 and 1,000 mg/kg nano-TiO2 were around 0.03 mg Ti/kg soil, whereas the particle forms of Ti abundances were 0.009, 0.002, and 0.002 mg Ti/kg soil, respectively. Concentrations of Ce-containing particles in the control soil and soil exposed to 1 and 1,000 mg/kg nano-CeO2 were 0.0002, 0.00006, and 0.003 mg Ce/kg soil, respectively; no soluble cerium was detected. Neither the soluble nor the particle form of cerium was detected in water extracted from soils with 1 mg/kg nano-CeO2. Results demonstrated that most of nano-TiO2 or CeO2 were not dissolved by the long-term incubation biochemical processes. In contrast, the data suggest that nano-Ag and ZnO could be dissolved during long-term incubation.

Metal contents of particles and soluble phase in the filtrate (0.45-μm filter) of water extracted from soils treated with ENMs. The extracted total mass was normalized to the weight of soil in a unit of mg metal/kg dry soil.
Morphological changes in ENMs in soils during the 28-day incubation period
Figure 5 shows SEM images and EDX spectra of ENMs mixed with biosolids before their introduction into soils. These images also show the potential size change of ENMs after mixing with biosolids for 2 h. The EDX spectrum of the control biosolid examines the presence of carbon, nitrogen, phosphorous, oxygen, sodium, magnesium, and sulfur, which are the typical elements in cultured sludge. Nano-CeO2, TiO2, and ZnO aggregated together. The SEM analysis showed that nano-CeO2, TiO2, and ZnO ENMs exhibited particle sizes of 28±5, 34±4, and 28±9 nm, respectively, which corresponded well to their pristine sizes. A 53 nm silver particle was also observed during the SEM analysis, which was indicative of aggregation, considering the original silver nanoparticle size was 24 nm. The EDX analysis also showed the coexistence of sulfur (S) and Ag, which suggests S-Ag bonding.

Scanning electron microscopy (SEM) images (on the left) and corresponding energy-dispersive X-ray spectroscopy (EDX, on the right) on mixture of ENMs and biosolids, before entering into soil (i.e., biosolids plus ENMs).
Figure 6 reveals soil aggregates containing elements that comprise the examined ENMs. Zn and Ag were found in large particle complexes with sizes ranging between 0.8 and 1 μm. The presence of salt-like structures comprising calcium, iron, and aluminum, along with Ag and Zn, was indicative of nano-Ag and ZnO dissolution and consequent co-precipitation of Ag+ and Zn2+. Although the SEM analysis did not show CeO2 and TiO2 particles in nano range, their alteration was not expected because of their low solubility in near-neutral conditions (Yang et al., 2013).
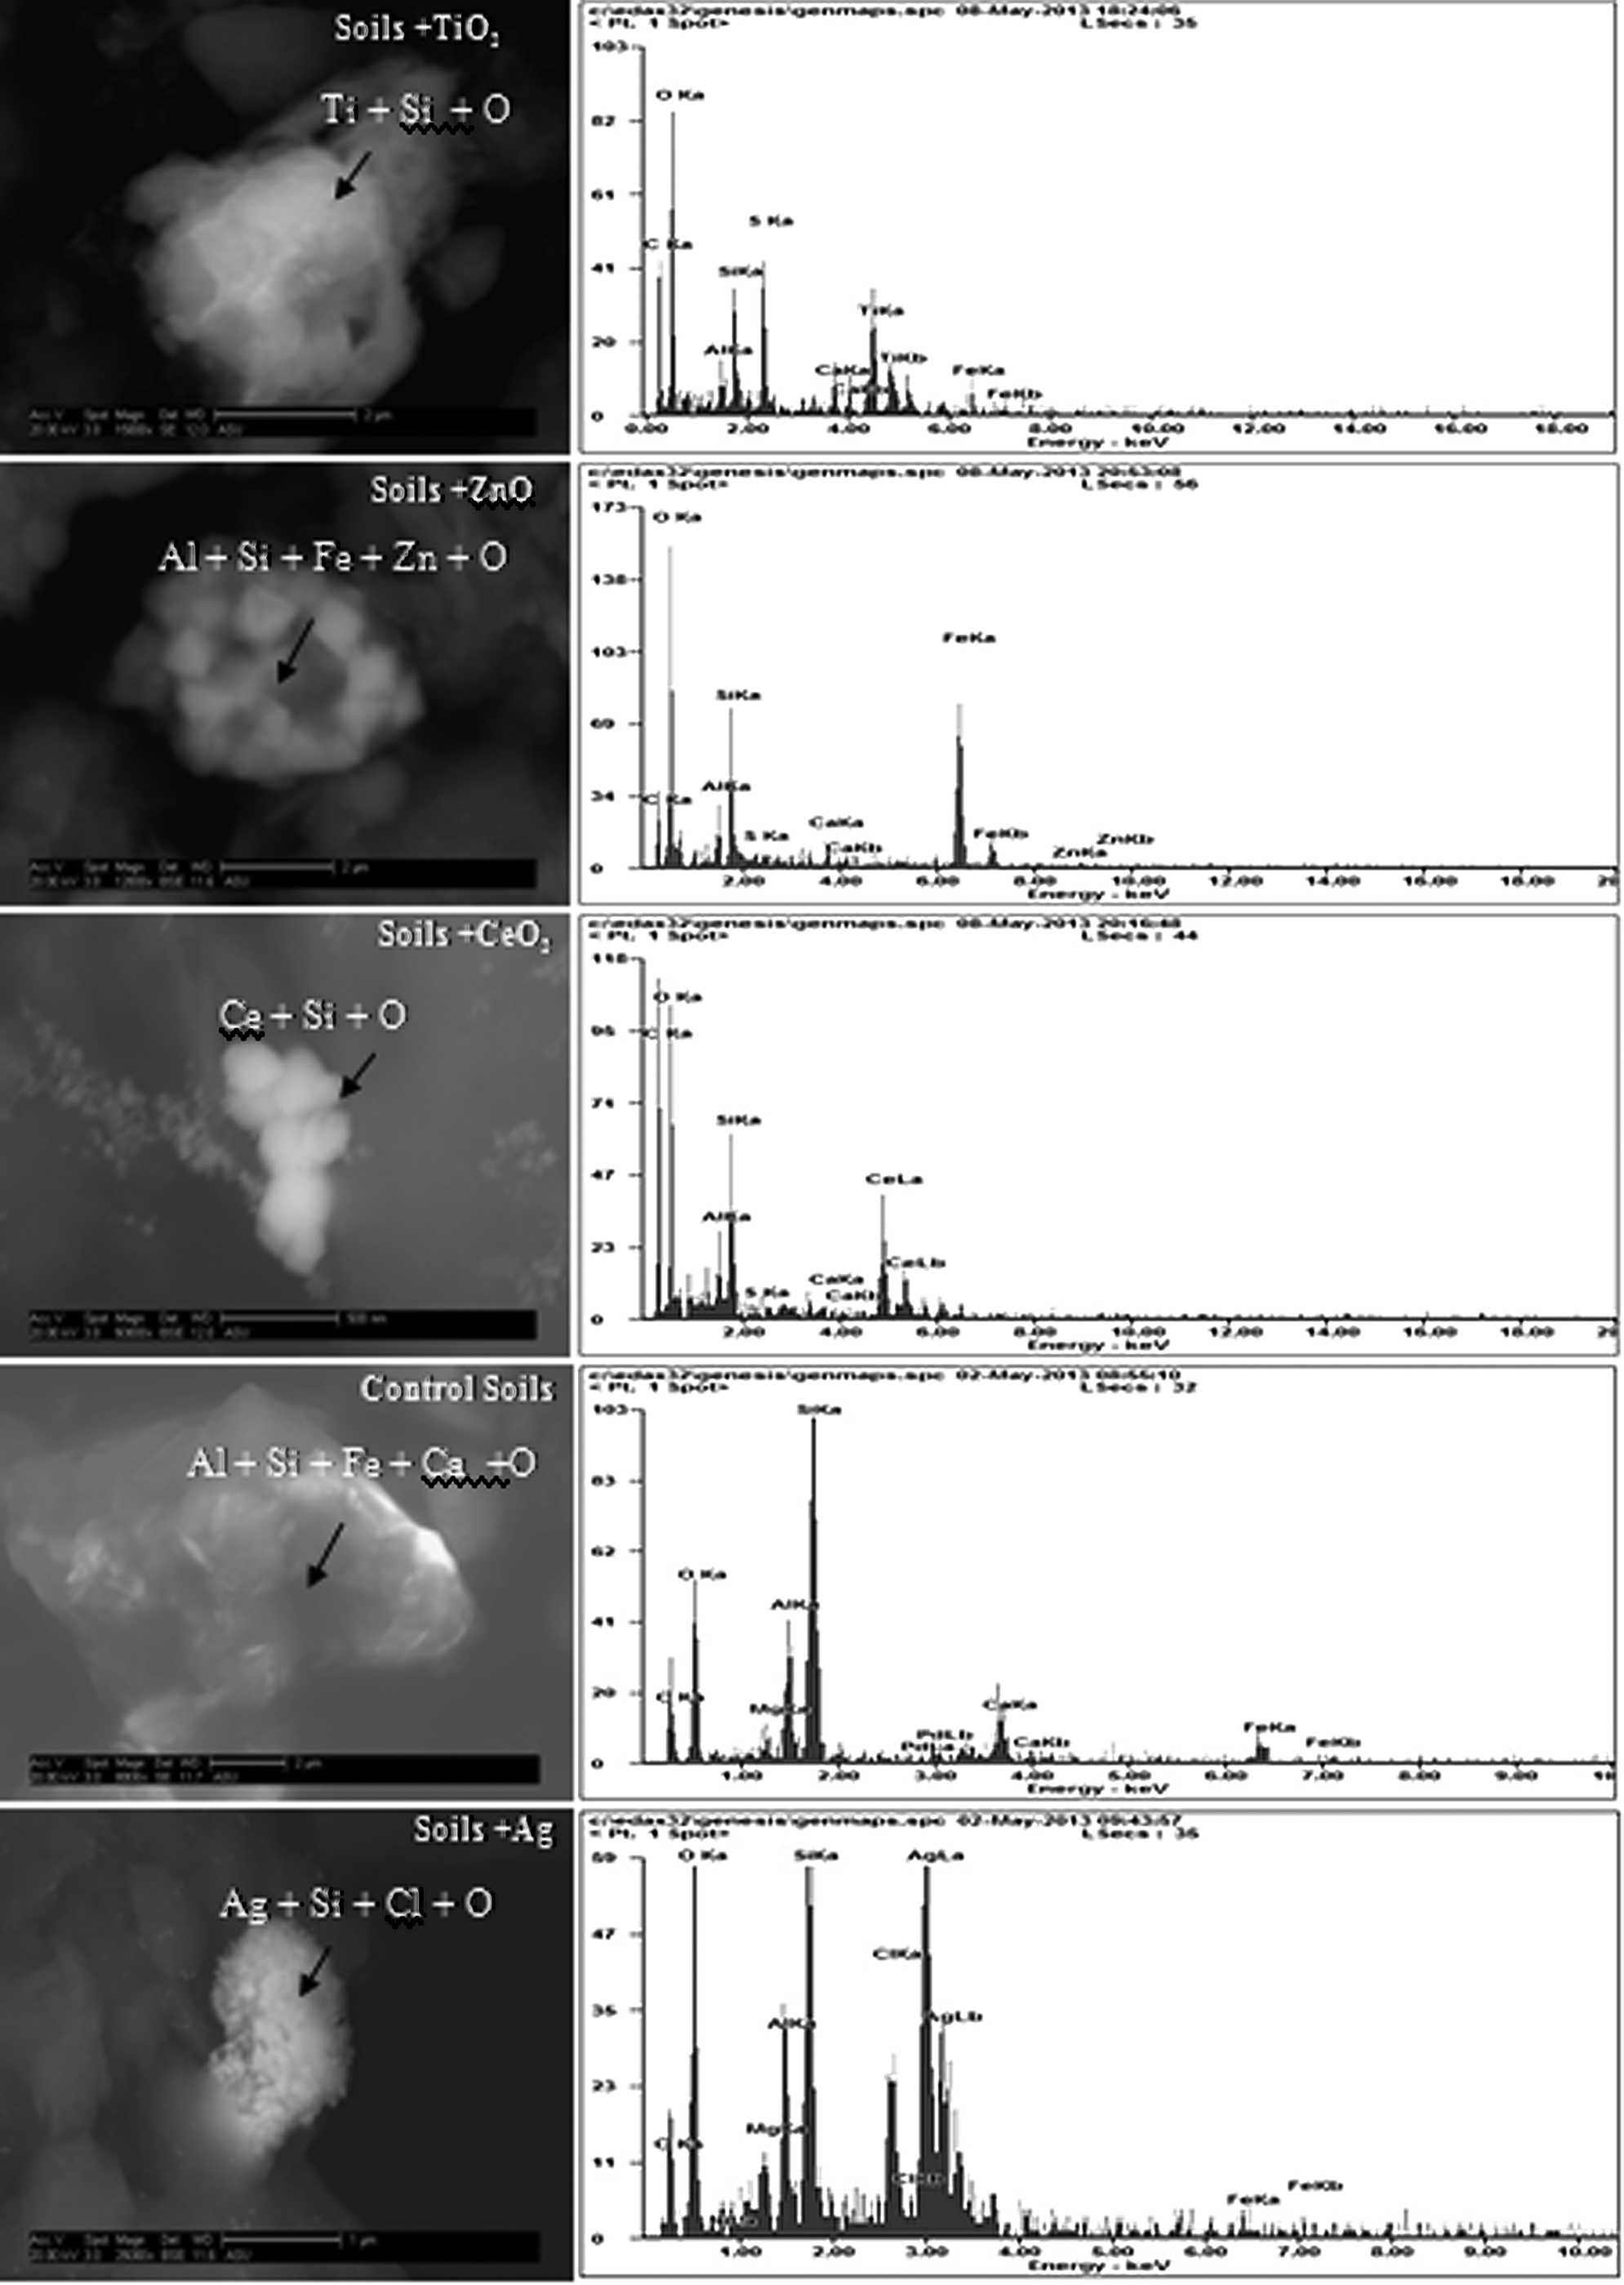
SEM images (on the left) and corresponding EDX (on the right) on soil samples containing ENMs after 28-day incubation (i.e., soil plus ENMs).
Discussion
Dissolution and or oxidation of ENMs in soils
Nano-TiO2 and CeO2 are almost insoluble in near-neutral conditions (Brunner et al., 2006; Xia et al., 2008). Dissolution of nano-CeO2 in solutions only occurs when pH value equals or <4 (Cornelis et al., 2011). Therefore, in both basal respiration and SIR tests, the dissolution of nano-TiO2 and CeO2 was not anticipated. The cerium detected in extracted water was mainly in the particle form (Fig. 4d). Similar concentrations of dissolved titanium (Fig. 4c) were found in the control soil and soils with 1 and 1,000 mg/kg nano-TiO2, which indicates that the soluble titanium arose from the background soils rather than the added nano-TiO2.
Under neutral pH or moderately alkaline conditions, nano-ZnO can dissolve in water and release free Zn ion (Zn2+) and zinc hydroxide Zn(OH+) (Auffan et al., 2009). Previous research has also shown that long-term stockpiling of anaerobically digested sludge with nano-ZnO eventually shifts toward a zinc association with iron oxy/hydroxides (Lombi et al., 2012). The dissolution of nano-ZnO in nanopure water was observed as well (Reed et al., 2012). In our study, the 2-h mixing with sludge probably initiated the dissolution of ZnO. In addition, the weak acidic condition of the soils tested (pH=6.1) favored the dissolution of nano-ZnO (Heggelund et al., 2014). Since the soils had higher water content in the SIR test (62.5%) than in the basal respiration test (25%), more zinc ions were estimated to be released in the SIR test than in the basal respiration test, thereby showing complete inhibition on SIR (Figs. 1 and 2). The high solubility of ZnO was likely the reason that only soluble zinc was detected in water extracted from the control soil and the soils with 1 and 1,000 mg/kg nano-ZnO (Fig. 4).
Under aerobic conditions, oxygen can oxidize nano-Ag, leading to the release of silver ions (Liu and Hurt, 2010; Liu et al., 2010). Similar to nano-ZnO, the higher water content of the SIR test than the basal respiration test led to its higher Ag ion content. Incubation for 28 days could facilitate the transformation from elementary Ag to Ag ions. Thus, in water extracted from soils exposed to 1,000 mg/kg nano-Ag, 10% of the silver was in particle form; whereas only ionic silver was detected in the other samples.
The size and surface charge of ENMs contribute to the dissolution and transformation of ENMs in soil (Darlington et al., 2009). Other factors such as coating affect the deposition of nano-ZnO and their final exchangeable fraction in soils (Darlington et al., 2009). Future work should be conducted to explore the effects of those factors. Generally, the 28-day study is a standard method for soil test recommended by OECD (2000), which provides the overall effect of metallic nanoparticles on carbon conversion in soil regardless of those factors.
The inhibition on microorganisms by ENMs in soils under dark conditions
ROS generation, metal ion release, and direct uptake of ENMs are the driving forces for the inhibitory effect of ENMs on microorganisms (Choi and Hu, 2008; Li et al., 2008; Yang et al., 2013). ROS can induce oxidative stress on cell membranes, destroy cell components, and even lead to cell death (Choi and Hu, 2008; Applerot et al., 2009). Since illumination is required for ROS generation by nano-TiO2 and ZnO (Xia et al., 2008), soil tests under dark conditions can get rid of the effects of light-induced ROS generation. The toxicity of nano-TiO2 was highly limited without light. In tests under dark conditions, nano-TiO2 at 1 or 1,000 mg/kg did not show significant inhibitory effects on aerobic carbon conversion in basal respiration or SIR tests. Under aerobic conditions, oxygen can diffuse into soil and the oxygen can be reduced by nano-Ag or potentially reduced Ce (III) on the CeO2 surface, which would lead to the generation of ROS (Xia et al., 2008; Liu and Hurt, 2010). The potential direct contact of nanomaterial to the bacteria surface could lead to the negative effects of ROS on cell membrane enzymes (Hu et al., 2010).
Dissolution of silver and zinc ions from nano-Ag and ZnO is considered the primary mechanism for their ecotoxicity in soil (Vos et al., 2009; Liu and Hurt, 2010; Neal et al., 2011). Zn ions are highly toxic to microorganisms and plant seeds (Franklin et al., 2007; Lin and Xing, 2007). As discussed earlier, nano-Ag and ZnO can be gradually oxidized/dissolved to release silver or zinc ions (Liu and Hurt, 2010; Yang et al., 2013). The presence of anions such as Cl− and S2− reduces the inhibitory effects of Ag+ and Zn2+, which can form complexes or precipitates with low solubility (e.g., the stability constant K to form AgS2=1050.1, AgCl(s)=109.7) (Stumm and Morgan, 1996; Choi et al., 2009). This variation in the interaction between zinc/silver ions and anions in soils may lead to the different responses of respiration rates of soils toward1 mg/kg nano-Ag and ZnO (Fig. 2). At the extremely high concentration used (1,000 mg/kg), the Ag+ and Zn2+ released could exceed the buffer ability of anions in the soil, and thus the aerobic respiration rates of microorganisms in soils were decreased or ceased, as shown in Figures 1 and 2. The more significant inhibition of microorganisms in soil exposed to 1,000 mg/kg nano-Ag and ZnO in SIR tests than in basal respiration tests may be due to the greater dissolution of metallic ions discussed earlier.
The basal respiration test results indicated beneficial effects from CeO2 (Fig. 1), which may be due to the presence of Ce (III) on the surface of nano-CeO2 particles (Kuchibhatla et al., 2012). Nano-CeO2 suppresses the generation of ROS in cells during aerobic respiration (Xia et al., 2008). For example, at moderate concentration, the addition of nano-CeO2 reduced H2O2 generation in both the shoots and roots of rice (Rico et al., 2013). In the presence of enriched substrates, however, 1,000 mg/kg CeO2 was inert (Fig. 2b) or reduced SIR rates slightly (Fig. 2a, c). The exact mechanism is not yet clear, but these minimum inhibitory effects may result from a chemical state change due to aging or other environmental factors (Kuchibhatla et al., 2012). When a 5-g soil sample from the basal respiration test was used for the SIR test, the Ce (III) on the surface of nano-CeO2 may have already been oxidized after 7 (or 14 or 28) days' incubation and thus have lost its ability as an antioxidant. More research is needed to determine the relationship between bioactivity and the surface oxidation state of nano-CeO2 particles.
Conclusions
Land application of biosolids inevitably leads to accumulation of ENMs in soils. To simulate this invasion of ENMs into soils, ecotoxicity tests such as those described here should be carried out. Our results indicate that only at very high loading rates (i.e., 1,000 mg/kg), metal ENMs affect aerobic biological carbon conversion with or without additional substrates. The water extraction tests demonstrated that the soils retain most metals. However, Ag-, Ti-, and Ce-containing nanoparticles can be released to the environment. Soil properties contribute to the interaction between ENMs and microorganisms. To reveal the dominant mechanisms in this interaction, more research is needed to address the chemical change and transport of ENMs in soils with or without additional flow.
Footnotes
Acknowledgments
Funding was provided by the Water Environment Research Foundation (RD831713) and the National Science Foundation (CBET 0847710). Any opinions, findings, and conclusions or recommendations expressed in this article are those of the author(s) and do not necessarily reflect the views of the WERF or NSF.
Author Disclosure Statement
No competing financial interests exist.
References
Supplementary Material
Please find the following supplemental material available below.
For Open Access articles published under a Creative Commons License, all supplemental material carries the same license as the article it is associated with.
For non-Open Access articles published, all supplemental material carries a non-exclusive license, and permission requests for re-use of supplemental material or any part of supplemental material shall be sent directly to the copyright owner as specified in the copyright notice associated with the article.