




Abstract
Abstract
Certain methods for reusing treated municipal wastewater, such as soil-aquifer treatment (SAT), are characterized by alternating cycles of aerobic and anoxic conditions. It is not yet known how these alternating redox conditions affect biodegradation of potentially harmful endocrine-disrupting compounds (EDCs) from treated effluents. To address this question, batch mesocosms were constructed and redox conditions in mesocosms were controlled by switching the atmosphere between air (to induce aerobic conditions) and nitrogen (to induce anoxic or anaerobic conditions). The length of anoxic cycles was varied to determine how this affects biodegradation of two target EDCs, bisphenol-A (BPA) and 17β-estradiol (E2). Important findings include: (1) BPA was biodegraded only during aerobic cycles, but E2 was biodegraded during both aerobic and anoxic cycles; (2) when redox conditions were switched from anoxic to aerobic, biodegradation of target EDCs commenced after a lag period during which no biodegradation was observed; and (3) lag time for biodegradation in the aerobic cycle was longer when anoxic cycles were longer in duration. As expected, more rapid biodegradation of both BPA and E2 was observed under aerobic conditions than under anoxic conditions, though the effect was not statistically significant for E2. Results suggested that, in actual SAT systems, length of flooding and drainage cycles may have an important effect on the degree of biodegradation achieved and, hence, on the ability of the system to provide water of acceptable quality.
Introduction
W
Potential for sustained biodegradation during SAT is interesting, because SAT is typically operated via intermittent application of treated wastewater to a surface impoundment or infiltration basin. That is, SAT is operated by alternating cycles of flooding, during which treated wastewater is applied to the basin, and drainage, during which the applied wastewater infiltrates through the subsurface and the surface impoundment drains. This mode of operation can lead to cyclic changes in saturated and unsaturated conditions in the shallow subsurface (Greskowiak et al., 2005), and, concomitantly, to cyclic changes in the oxidation–reduction (redox) potential (Fox et al., 2001, 2005, 2006; Eshel and Banin, 2002; Montgomery-Brown et al., 2003). This is significant, because many EDCs have been observed to biodegrade under aerobic conditions but not under anaerobic conditions (Ying et al., 2003, 2008; Ying and Kookana, 2005). Hence, one might expect that biodegradation of trace organic contaminants of concern would also occur intermittently. Indeed, although some laboratory studies have observed that target contaminants are attenuated regardless of redox conditions (Mansell and Drewes, 2004), it has been observed in at least one field study of artificial recharge that biodegradation of target contaminants appears linked to temporally varying redox conditions (Greskowiak et al., 2006).
Therefore, the objective of this study is to quantify how the biodegradation of two target EDCs varies under temporally varying redox conditions; that is, under alternating aerobic and anoxic conditions. In particular, we will determine whether the duration of the anoxic cycle has any measurable effect on biodegradation during the aerobic cycle. We envision these questions as most directly relevant to SAT for the reasons already discussed, but they may also have implications for other environmental systems such as intermittent riverbank filtration, or perhaps for wastewater treatment processes that cycle between aerobic and anoxic/anaerobic conditions (Li et al., 2011). Some researchers have previously examined removal of estrogens during anoxic/aerobic wastewater treatment (Dytczak et al., 2008; Li et al., 2011) but did not monitor repeated cycles of aerobic and anaerobic conditions. To the best of our knowledge, this represents the first study of biodegradation of EDCs under controlled alternating redox conditions.
In this study, we focus on two particular EDCs, bisphenol-A (BPA) and 17β-estradiol (E2), because these are commonly found in treated wastewater effluents, and often at environmentally relevant levels (Desbrow et al., 1998; Ternes et al., 1999; Körner et al., 2000; Huang and Sedlak, 2001; Kuch and Ballschmiter, 2001; Kolpin et al., 2002; Lagana et al., 2004; Nakada et al., 2006; Kim et al., 2007). Physical and chemical properties of BPA and E2 are given by Yoon et al. (2003).
Experimental Protocols
Chemicals
SYTOX® Green nucleic acid stain was purchased from Molecular Probes. Sodium azide (NaN3), sodium nitrate (NaNO3), methanol (HPLC grade), BPA (>99%), E2 (>99%), 4-n-nonylphenol (NP, >99.9%), sodium chloride (NaCl, >99.5%), and the derivatizing agent MSTFA with 1% trimethylchlorosilane (TMCS) were purchased from Aldrich. Stock solutions of BPA in methanol (100 mg/L) and E2 in methanol (100 mg/L) were prepared to facilitate dissolution of the target EDCs in aqueous solution.
Soil and wastewater
Tertiary-treated effluent (final effluent, collected immediately before discharge into the receiving water) was obtained from the Howard F. Curren Advanced Wastewater Treatment Plant in Tampa, FL. This facility treats municipal wastewater and has a design treatment capacity of 96 million gallons per day (250 m3/min); the final effluent is either discharged to Hillsborough Bay or used as reclaimed water for cooling and irrigation. The plant employs activated sludge for removal of dissolved organic carbon (DOC), separate nitrification and denitrification processes for biological nitrogen removal, and chlorination/dechlorination before discharge. According to the plant's permit, the final effluent may contain no more than 5 mg/L of suspended solids, 5 mg/L of carbonaceous biochemical oxygen demand (BOD5), and 3 mg/L of nitrogen (as N).
Soil was obtained from a constructed wetland treatment system in Lakeland, FL, which is used to polish the discharged effluent from two municipal wastewater treatment plants (U.S. EPA, 1993). Soil samples were collected from the top 10, 50, and 100 cm of the pond bed and placed in glass jars. Collected soil was mixed (homogenized) by hand in the laboratory before use.
Batch mesocosm reactors
Mesocosms were constructed in 4-L reactors by adding 3 L of effluent wastewater and 500 g soil to each reactor. A schematic diagram of the mesocosm reactors and a photograph of three of the reactors are shown in Fig. 1. Mesocosms were wrapped in aluminum foil and operated at room temperature (23°C±1°C).

Schematic diagram
BPA and E2 were spiked into the mesocosms at an initial concentration of 1000 μg/L. This concentration is higher than would likely be observed in most effluent wastewater; we chose relatively high initial concentrations of target EDC concentration to be sure that changes in EDC concentrations would be clearly visible during experiments, even for >99% removal of target EDCs. BPA and/or E2 were re-spiked into mesocosms when their concentrations dropped below 100 μg/L.
To induce either aerobic or anoxic conditions, the mesocosms were connected to a cylinder of either air (21% O2) or nitrogen (N2). The gas cylinders were attached via fluoropolymer tubing to a valve in the mesocosm cap (Fig. 1). From the valve in the cap, the gas was injected via a needle into the aqueous phase of the mesocosm (Fig. 1). At desired time intervals, the gas was manually switched between air (to induce aerobic conditions) and N2 (to induce anoxic conditions) (Reddy and Patrick, 1975). The reactor caps had an open port to enable the release of injected gas.
Mesocosms were amended with nitrate (
Reactor conditions tested
Three sets of reactor conditions were considered in this study. Each set of conditions was tested in triplicate, so a total of nine mesocosm reactors were tested. Three reactors, designated C1–C3, were control reactors in which NaN3 was used to suppress biological activity; these reactors were designed to quantify removal of target EDCs by sorption onto the soil. Three reactors, designated NS1–NS3, cycled between 3-day aerobic cycles and 2-day (“short”) anoxic cycles. Three reactors, designated NL1–NL3, cycled between 3-day aerobic cycles and 4-day (“long”) anoxic cycles. Table 1 summarizes the conditions tested. Control reactors were maintained under aerobic conditions for 20 days.
Sampling
On the first day of any new cycle (i.e., after a switch from aerobic to anoxic conditions, or vice versa), six water samples were collected via a sampling syringe connected through the reactor cap (Fig. 1). Samples were collected at 1, 3, 6, 10, 16, and 24 h after the start of the cycle. After that, samples were collected every 8 h until the end of the cycle. The volume of each sample was 10 mL. The sampled volume was not replaced, so the volume of the aqueous phase decreased over time during the experiments. Immediately after collection, each sample was analyzed for oxidation–reduction potential (ORP, or “redox potential”), as described later. Then, 1 mL was set aside for flow cytometry to measure microbial population density. The remaining 9 mL were diluted and analyzed for the concentration of BPA, E2,
At the conclusion of the experiment, the soil in six of the nine mesocosms was collected, and sorbed concentrations of BPA and E2 were determined by extraction from the soil with methanol. Quantification of the sorbed concentrations enabled an overall mass balance and determination of the fractional removal of BPA and E2 in each reactor.
Analysis
BPA and E2 in aqueous samples (diluted from the original 10-mL samples) were analyzed by gas chromatography with mass spectrometry (GC/MS). Target analytes were extracted from the aqueous phase via solid-phase microextraction (SPME). Before SPME, NP was spiked into each aqueous sample as an internal standard. BPA, E2, and NP were derivatized (silylated) on-fiber by a reaction with MSTFA before an injection into the GC. The GC/MS was a Perkin-Elmer Clarus 580 GC that was directly connected to a Clarus 560D ion-trap MS. An HP-5MS capillary column (30 m×0.25 mm i.d., 0.25 μm film, 5% phenyl-dimethylsiloxane phase; Agilent) was used for chromatography. Helium (99.9995% purity) was used as carrier gas at a constant flow rate of 1.0 mL/min. The injection port temperature was 280°C with splitless mode. The GC oven temperature program was as follows: hold for 1 min at 80°C, increase at 15°C/min to 240°C, hold for 1 min, increase at 10°C/min to 280°C, and hold for 5 min. BPA, E2, and NP were quantified by the area of the peak corresponding to a particular fragment on the MS. These fragments are termed the diagnostic ions for each compound. The m/z ratios for the diagnostic ions are 357 for BPA, 416 for E2, and 179 for NP. These m/z ratios correspond to major peaks in the mass spectra of the derivatized (silylated) compounds.
Concentrations of BPA and E2 in the mesocosm soil were also determined via extraction with methanol. Concentrations of the target analytes in the methanol were determined as follows (Kim et al., 2014). Methanol was evaporated in a Rotavapor R-210 rotary evaporator (Buchi). The dry residues were derivatized either by N,O-bis(trimethylsilyl)-trifluoroacetamide (BSTFA) with 1% TMCS or by N-methyl-N-(trimethylsilyl)-trifluoroacetamide (MSTFA) with 1% TMCS. In either case, 100 μL of derivatization reagent was added to the reaction vial. Then, the vial was closed and placed in an oven at 65°C for 25 min. Once the derivatization was completed, 1 μL of the reaction mixture was injected into the GC/MS within 30 min, and chromatography was performed as described in the preceding paragraph.
Concentrations of
Micro-organism population density in aqueous samples was estimated by flow cytometry (Gunssekera et al., 2000; Chen et al., 2001). First, 1 mL of aqueous sample was combined with 1 mL of 4% paraformaldehyde and mixed for 5 min. Then, the mixture was centrifuged and the supernatant was discarded. The remaining precipitate was stained and resuspended with 300 μL of 5 μM SYTOX Green nucleic acid stain. Next, 200 μL of the stained sample was placed in a well of a 96-well tray. When the tray was full with 48 samples and 48 blanks, microbes were counted by a BD FACSCanto II high-throughput flow cytometer (BD Biosciences).
Concentration of dissolved oxygen (DO) in the aqueous phase of each mesocosm reactor was measured by a YSI DO200 probe. One probe was dedicated to each mesocosm reactor, as shown in Fig. 1. Readings of DO concentration were taken each time a sample was collected from the reactor. ORP of each collected sample was measured by a YSI pH100 meter equipped with a YSI 115-1 ORP probe attachment. The ORP probe uses an inert platinum sensing electrode and a silver/silver chloride reference electrode.
Concentrations of organic carbon in the nine reactors were analyzed at the beginning and at the end of the experiments. DOC in the aqueous phase was analyzed using a TOC-VCSH analyzer (Shimadzu). Total organic carbon (TOC) content of the soil was analyzed by oven-drying a sample of the soil, measuring the mass of the sample, burning off the organic carbon in a muffle furnace at 550°C, remeasuring the mass of the sample, and calculating the mass of organic carbon by difference.
Results
Control tests
In the control reactors, biodegradation is suppressed by NaN3, so sorption is the main removal mechanism of BPA and E2. Aqueous concentrations of BPA and E2 rapidly decreased over the first day, but by 72 h the concentrations had essentially reached equilibrium (Fig. 2). Mesocosms were spiked at initial concentrations of 1000 μg/L, but some rapid sorption occurred within the first hour such that it appears that the initial concentrations were below 500 μg/L. The equilibrium aqueous concentrations of BPA and E2 were 110 and 210 μg/L, respectively (arithmetic average from reactors C1 and C2; samples from C3 were not analyzed). At the end of the experiment, sorbed EDCs were extracted with methanol from the soil in reactors C1 and C2. Extracted concentrations were quantified via GC/MS as previously described. Overall recovery of BPA in the control mesocosms (aqueous plus sorbed mass) was 97%, and that of E2 was 98%. The high recoveries (close to 100%) verify that observed decreases in aqueous concentrations in the control mesocosms are due predominantly to sorption, and that other loss mechanisms are not important.

Concentrations of bisphenol-A (BPA) and 17β-estradiol (E2) in control reactors amended with sodium azide to suppress biological activity. Data points represent the arithmetic mean concentrations from two reactors; error bars indicate maximum and minimum concentrations in the two reactors.
DO and ORP
In all NL and NS reactors, the measured concentration of DO in aqueous samples was 7.5–7.9 mg/L during aerobic cycles and 0.3–0.5 mg/L during anoxic cycles. Concentrations changed rapidly when the gas supply was switched. Likewise, the ORP of the water in the reactor responded rapidly to changes in the aeration status of the reactors, decreasing rapidly after air was switched to N2 gas, and rising rapidly when N2 was switched to air. ORP results are shown in Fig. 3. In all NS and NL reactors, the ORP under aerobic conditions was approximately +240 mV, and under anoxic conditions, it was approximately −100 mV. DO measurements are consistent with the ORP measurements and are, therefore, not shown here. Both sets of measurements verify that, as intended, the conditions in the reactors alternated between aerobic and anoxic when the gas supply was switched, and that transition from one state to the other was rapid (<8 h).
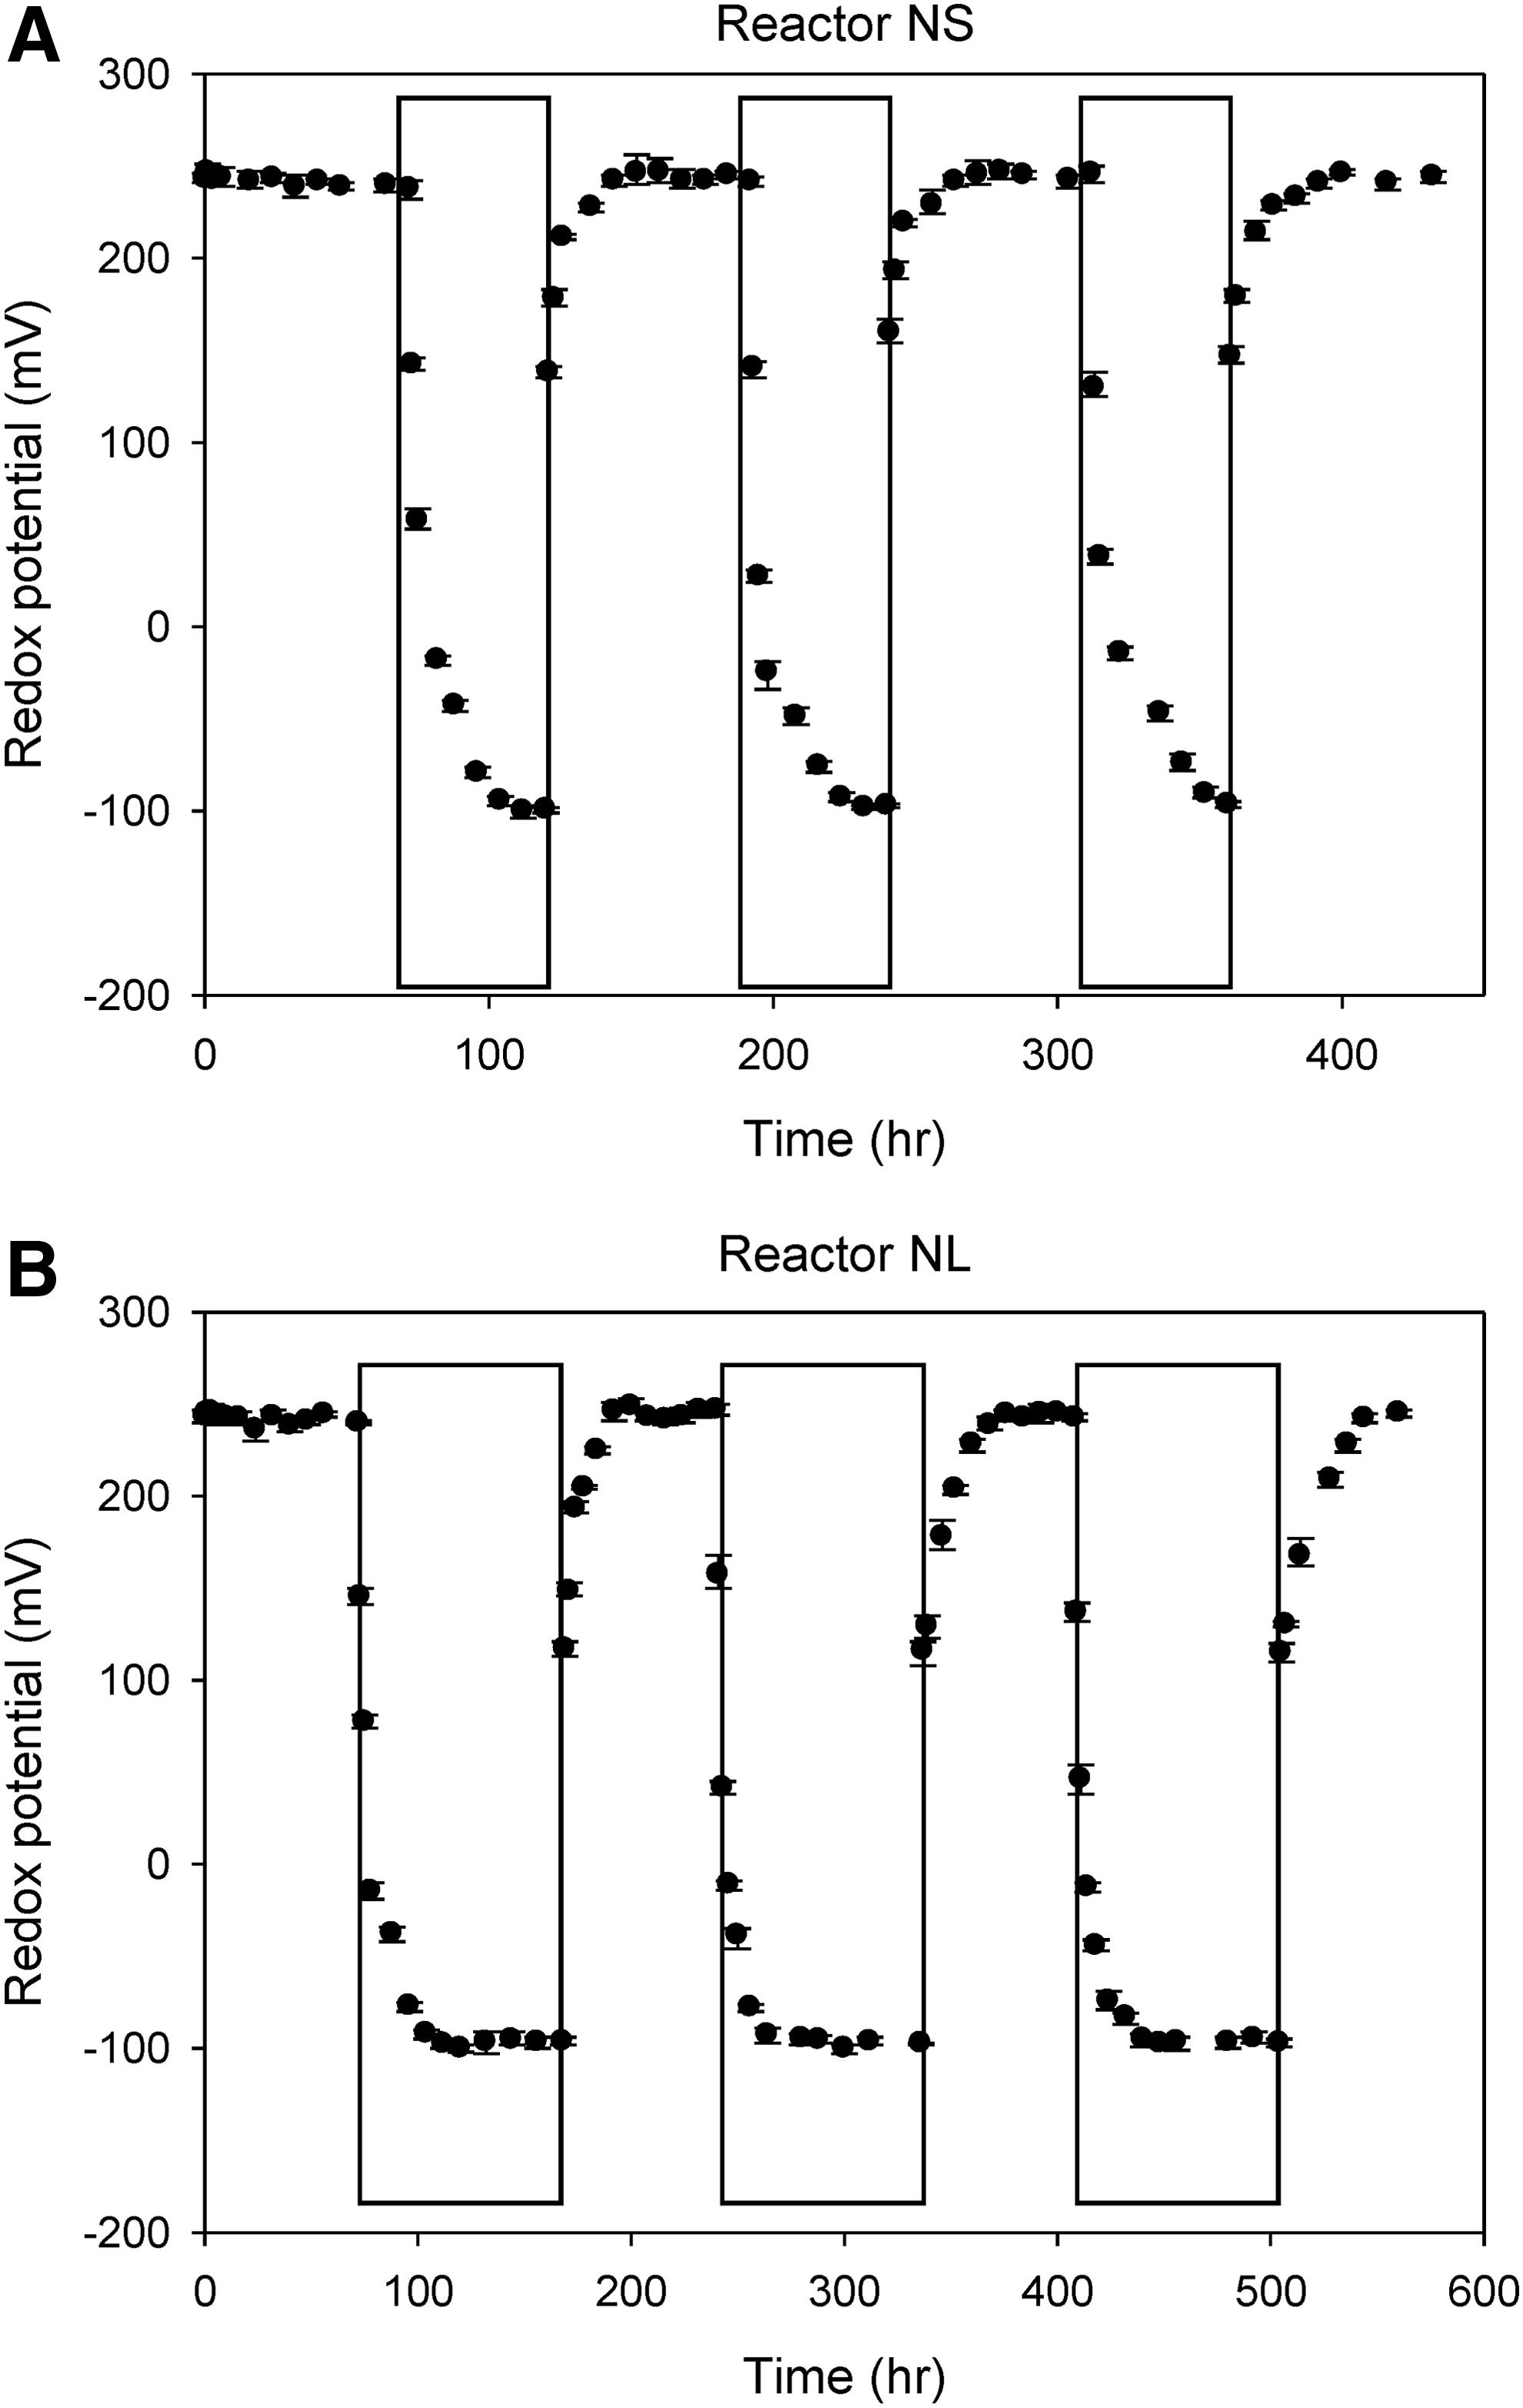
Oxidation–reduction potential (ORP) in reactors with 2-day
TOC and DOC
DOC of the water in the reactors and TOC of the soil in the reactors were analyzed at the start and at the end of the experiments. Results are shown in Table 2. In control reactors, where biological activity was suppressed by NaN3, there was little change in either the DOC or the TOC over the 20-day period of operation (∼6% loss of DOC, <1% loss of TOC). However, in biologically active reactors, both DOC and TOC decreased between the start and the end of the experiments, suggesting that bacteria were metabolizing the organic carbon. Interestingly, the decrease in DOC and TOC was slightly greater in the NS reactors (2-day anoxic cycles; ∼26% decrease in DOC and ∼16% decrease in TOC) than in the NL reactors (4-day anoxic cycles; ∼25% decrease in DOC and ∼11% decrease in TOC). This is likely caused by the longer anoxic cycles resulting in greater suppression of the aerobic bacteria. If disappearance of DOC and TOC is due to utilization by aerobic bacteria, then suppressing the aerobic bacteria also suppresses the utilization of organic carbon.
DOC, dissolved organic carbon; TOC, total organic carbon.
Concentrations of NO3− and NO2−
In the interest of space, concentration data for the
As noted, the
Quantification of biomass
Bacterial concentrations were quantified by flow cytometry, which measures the fluorescence from stained cells (Gunssekera et al., 2000; Chen et al., 2001). In the interest of space, bacterial concentrations are not presented here, but they are presented graphically by Kim (2011). Here, we summarize three main results from quantification of biomass. First, in the control reactors, the number of bacteria was below the detection limit, suggesting that the NaN3 was effective at suppressing biological growth. Second, in both NS and NL reactors, whenever the redox conditions were switched, there was a temporary drop in the bacterial population, then a lag time, and then a recovery of the population. Third, the observed lag time was longer in NL in reactors than in NS reactors; that is, when the anoxic cycles were longer, it took more time for aerobic bacteria to recover after the anoxic cycle.
Concentration of BPA and E2
Measured concentrations of BPA and E2 are shown in Fig. 4 for the NS reactors (Fig. 4A) and the NL reactors (Fig. 4B). For short anoxic cycles, samples from reactors NS2 and NS3 were analyzed; for long anoxic cycles, samples from reactors NL2 and NL3 were analyzed. Samples from reactors NS1 and NL1 were not analyzed because results from the first two reactors exhibited low variability and were therefore deemed acceptable. BPA and E2 were re-spiked into the reactors at the beginning of the third anoxic cycle in the NS reactors, and at the beginning of second and third aerobic cycles in the NL reactors.
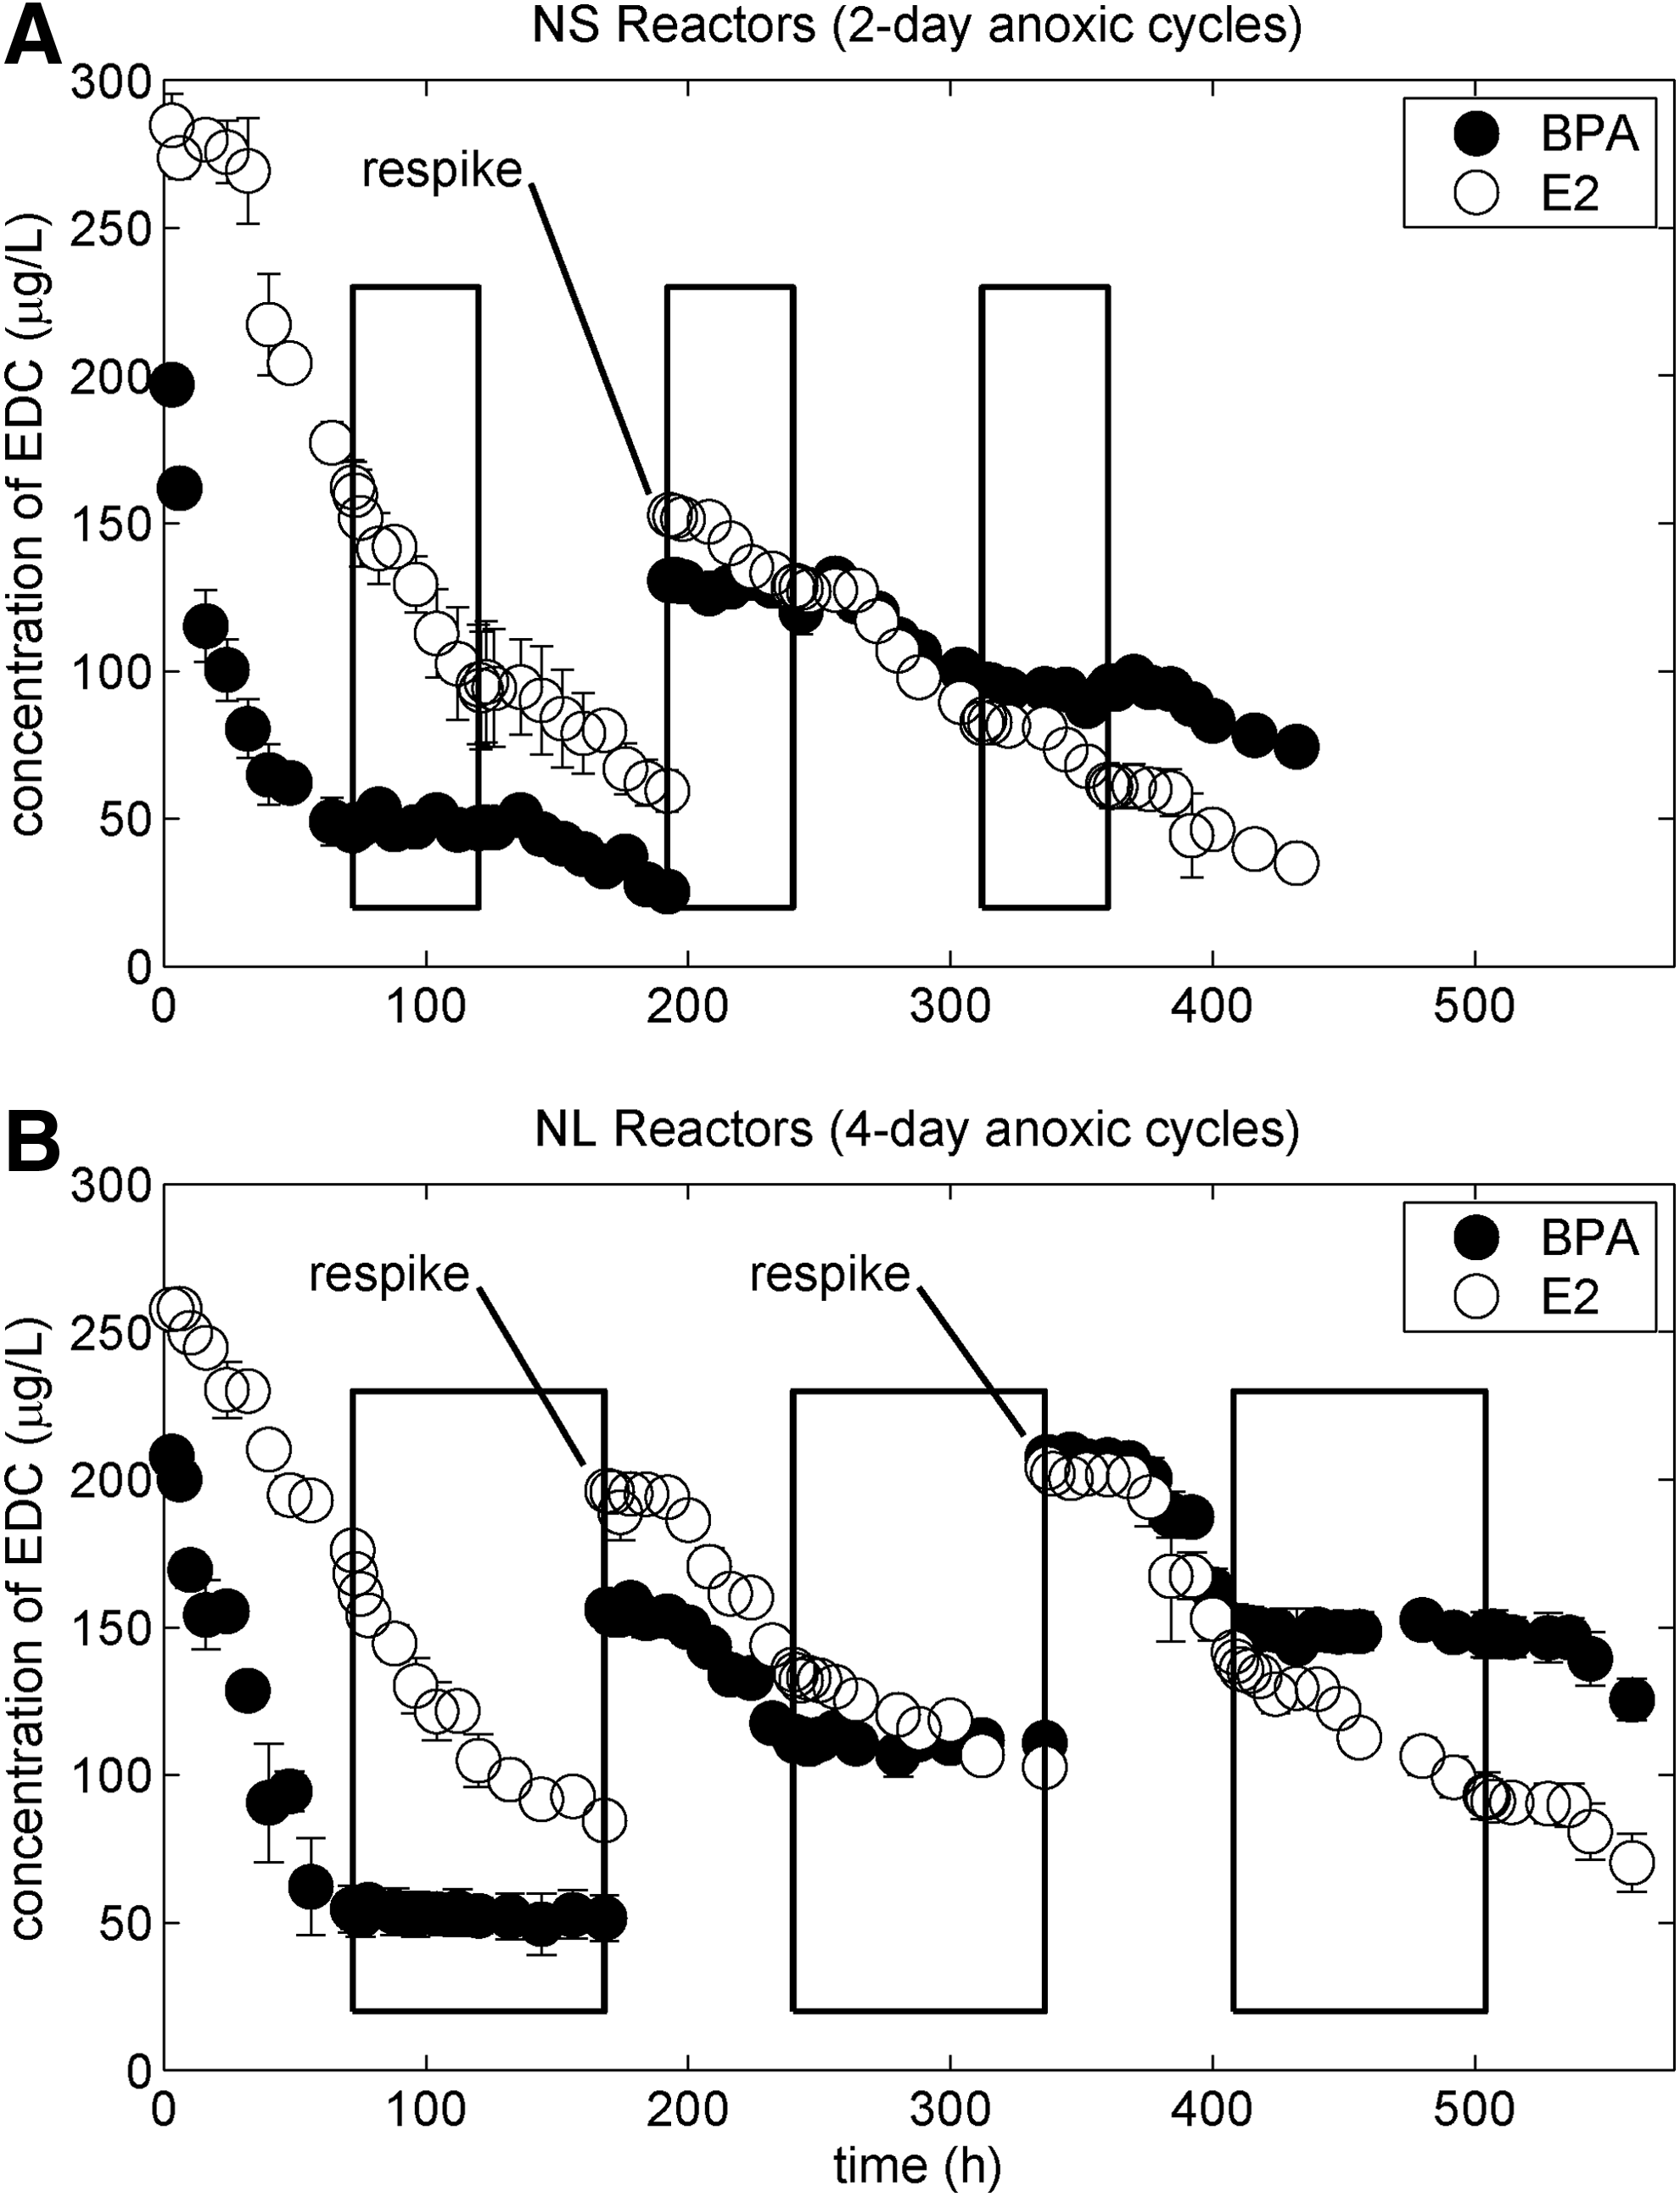
Concentrations of endocrine-disrupting compounds (EDCs) as a function of time in reactors with 2-day
Several important findings can be seen from Fig. 4, including the following. First, in the NS and NL reactors, both sorption and biodegradation occurred. Control reactors C1 and C2 showed that when only sorption occurred, the equilibrium concentrations were 110 μg/L for BPA and 210 μg/L for E2. However, in the biologically active reactors, concentrations decreased in the first 72 h to ∼50 μg/L for BPA and ∼170 μg/L for E2. The difference between control reactors and biologically active reactors is attributed to biodegradation of the target contaminants.
Second, it is possible to estimate rate coefficients that quantify the rate of disappearance of BPA and E2 in the mesocosms. Table 3 shows apparent rate coefficients
BPA, bisphenol-A; E2, 17β-estradiol.
Third, we observed some formation of estrone (E1) during the experiments, presumably from the conversion of E2 to E1 (Weber et al., 2005; Yu et al., 2007). In NS reactors, we observed the formation of ∼30–40 μg/L E1, and in NL reactors, ∼40–50 μg/L (results not shown). The observed concentrations of E1 correspond to ∼10% of the E2 mass that was biodegraded. Therefore, we conclude that E1 is not the principal product of E2 degradation.
Fourth, the biodegradation of both BPA and E2 exhibited a lag phase when conditions were switched from anoxic to aerobic. At the beginning of an aerobic cycle, the concentration of BPA and E2 did not change at first; then, after some lag time, biodegradation began again. This phenomenon is known as a diauxic lag (Liu et al., 1998a, 1998b), that is, a period of little or no growth when the bacteria switch their electron acceptor from
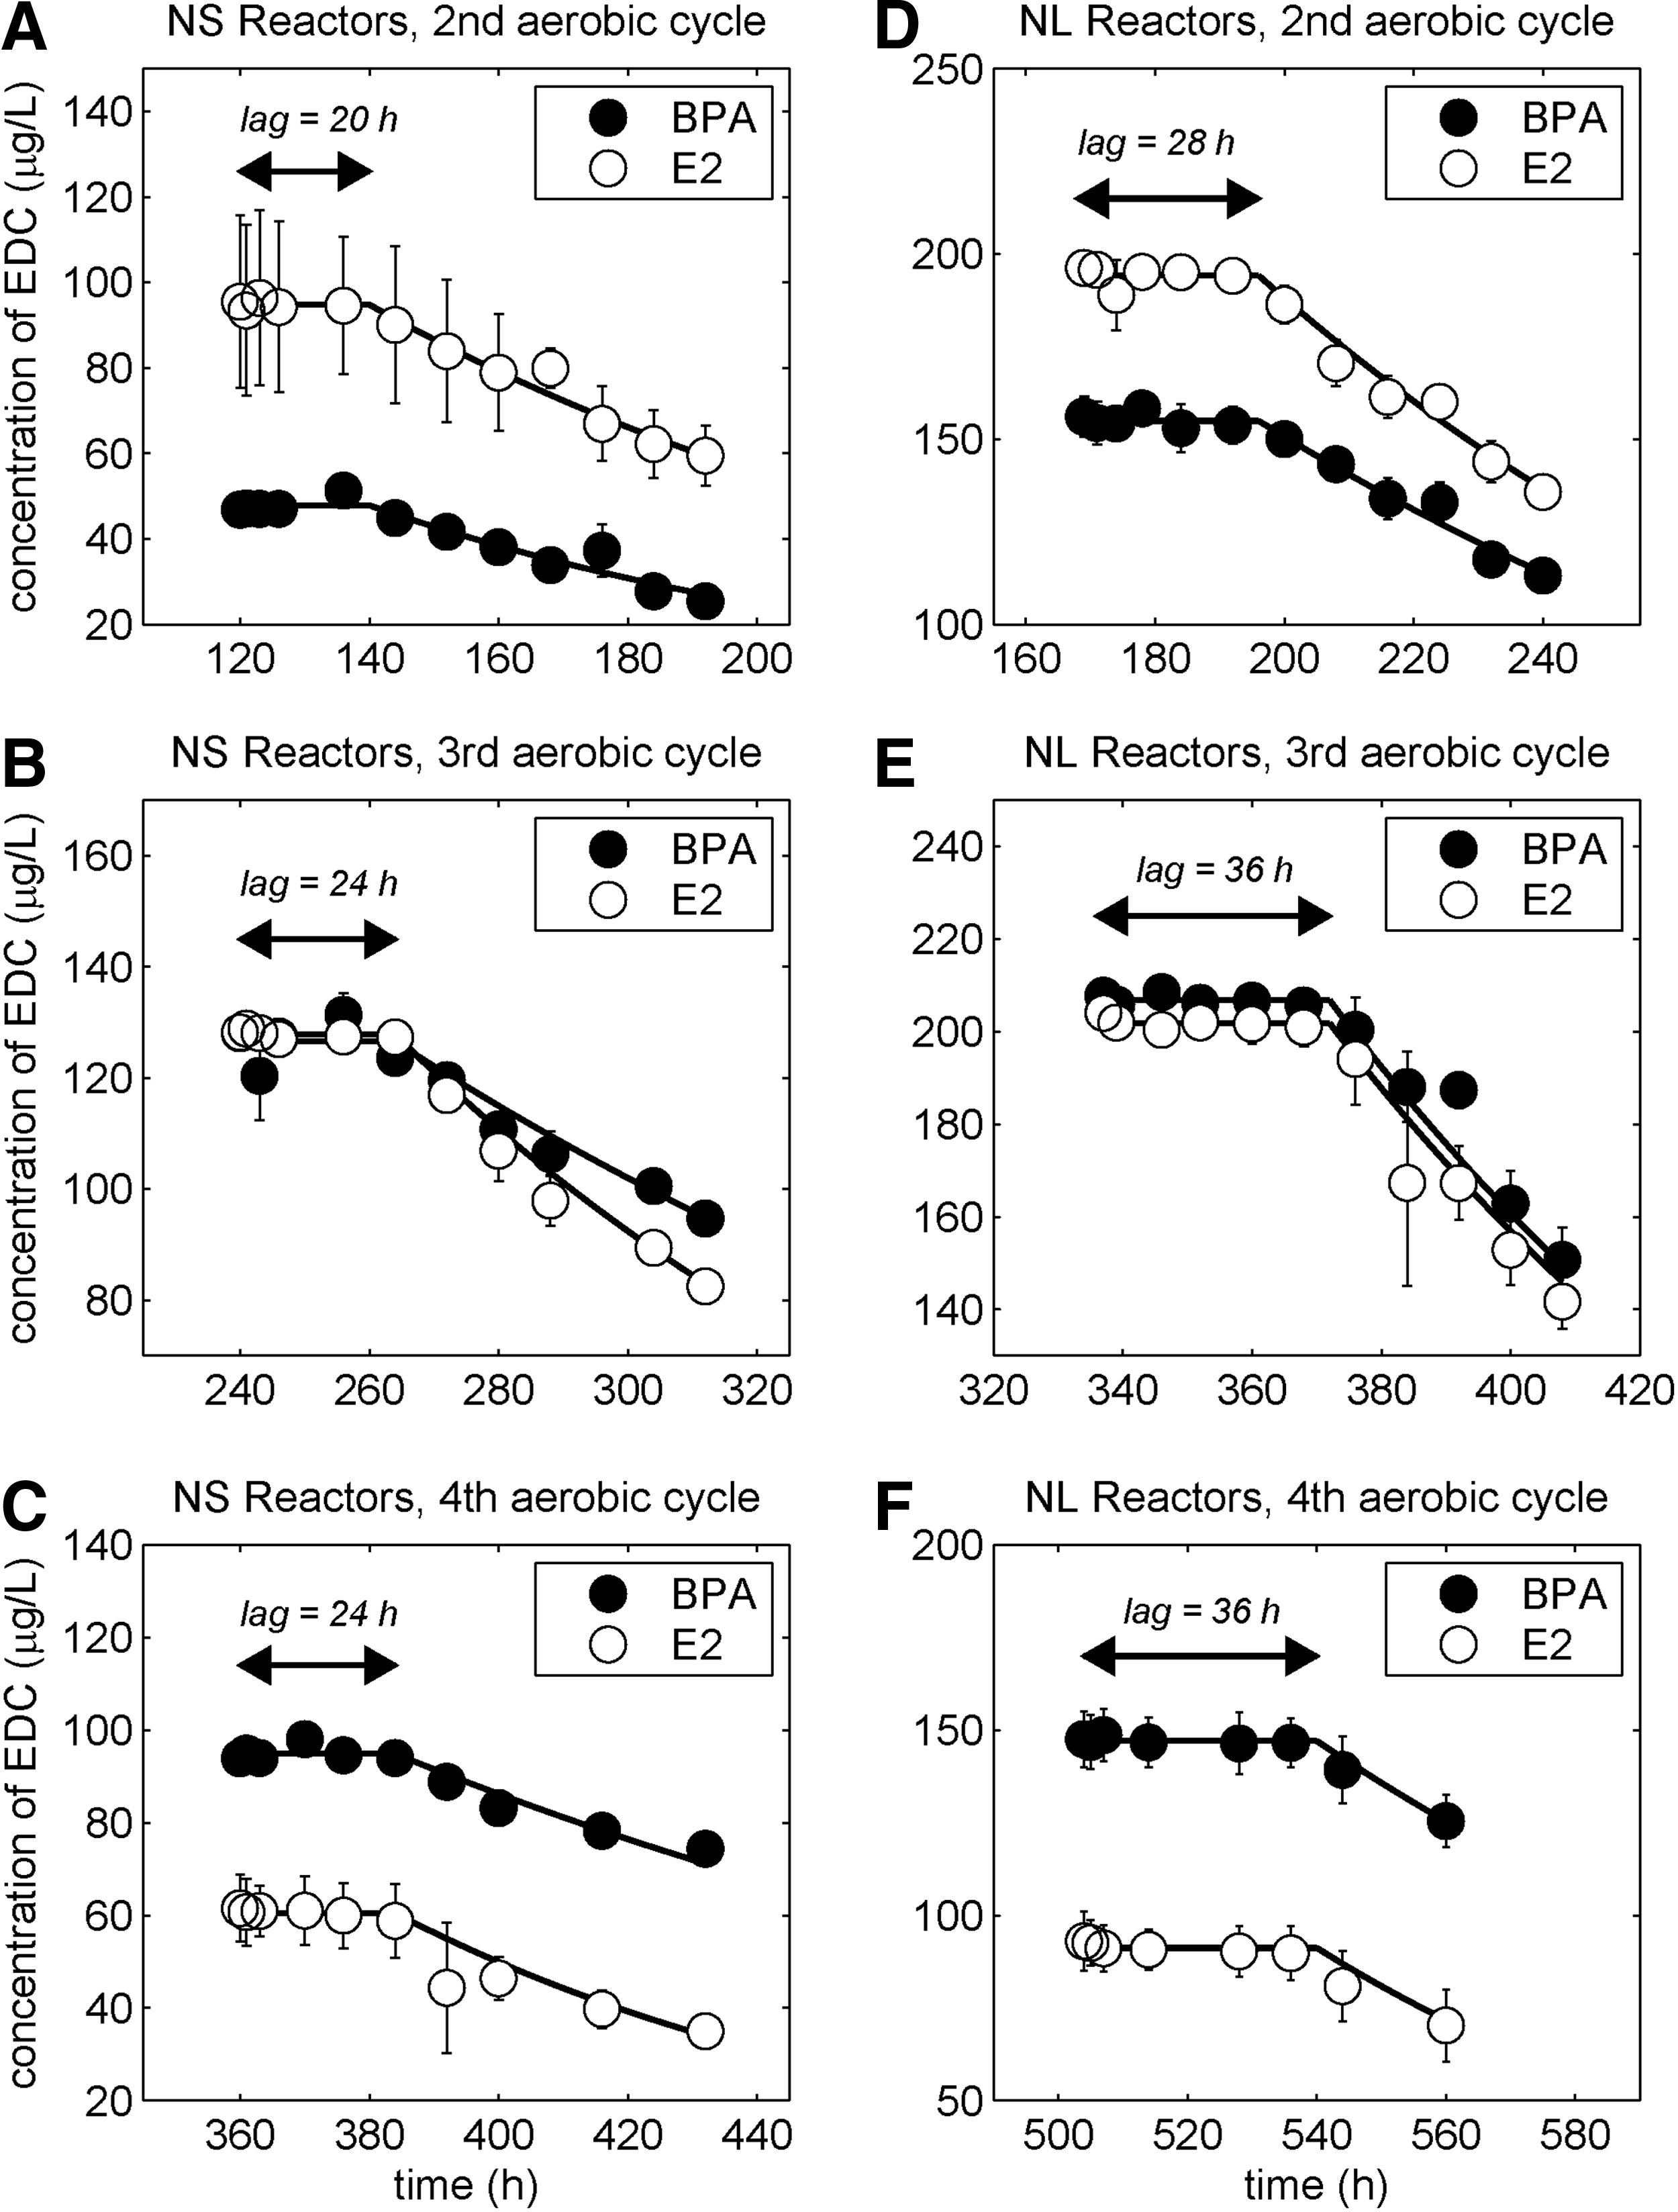
Concentrations of EDCs as a function of time in reactors with 2-day anoxic cycles
Finally, and perhaps most interestingly, the diauxic lag is longer when the anoxic cycles are longer. We defined the lag time as the period in which the observed EDC concentration decreased by ≤5%; this definition enables quantification of the length of each lag period. From Fig. 5, it is seen that the lag time was 20–24 h when anoxic cycles were short (2 days), but the lag time was 28–36 h when anoxic cycles were long (4 days). That is, after a longer anoxic period, it takes the aerobic bacteria longer to “recover.”
Mass balance of EDCs
The total mass of BPA and E2 spiked into each NS reactor was ∼3300 μg (3000 μg initially added plus one re-spike). The mass spiked into each NL reactor was ∼3600 μg (3000 μg initially added plus two re-spikes). At the end of the experiments, soil was collected from reactors NS2, NS3, NL2, and NL3, and BPA and E2 were recovered via extraction with methanol. Adding together the sorbed mass, the mass remaining in the aqueous phase at the end of the experiment, and the mass removed from the reactors by sample collection, we were able to determine an overall mass balance for the BPA and E2. In NS reactors, we recovered 70% of BPA and 61% of E2 (average of NS2 and NS3 reactors). In NL reactors, we recovered 73% of BPA and 63% of E2 (average of NL2 and NL3 reactors). As previously noted, losses in control reactors were negligible (<4%), indicating that any losses in the NS and NL reactors were due to biodegradation only. Therefore, we conclude that about 25–30% of BPA and about 35–40% of E2 was biodegraded in the biologically active mesocosms. (Note that the reported E2 recoveries include any observed E1; that is, conversion of E2 to E1 is not considered “biodegradation.”)
From these results, we draw two conclusions. First, biodegradation was an important loss mechanism in the biologically active reactors. Second, the overall extent of biodegradation was very similar in NS and NL reactors, even though the NL reactors were operated for 24 days and the NS reactors were operated for only 18 days. The extra 6 days of operation did not significantly increase the extent of biodegradation, because BPA does not biodegrade under anoxic conditions, and because the longer anoxic cycles impair the biodegradation during the aerobic cycles.
Discussion
Implications for water reuse
To the best of our knowledge, this study represents the first time that biodegradation of EDCs has been examined under controlled alternating aerobic/anoxic conditions. We believe that the results of this study will be most directly applicable to SAT, but there may also be implications for other environmental systems, such as intermittent riverbank filtration, or perhaps aerobic/anoxic (or aerobic/anaerobic) wastewater treatment. It should be noted that the factors controlling redox conditions in SAT systems include not only the wetting and drying cycles applied at ground surface, but also soil characteristics and effluent pretreatment (which controls total oxygen demand of the ponded wastewater) (Fox et al., 2001, 2006). In addition, at some sites, redox conditions may be controlled largely by temperature, in which case redox conditions are likely to vary over the time scale of months or seasons, but not days (Greskowiak et al., 2006). Therefore, it should be emphasized that not all SAT systems are expected to exhibit short-term alternating aerobic/anoxic conditions such as those considered here, although some sites likely will (Eshel and Banin, 2002). To the extent that redox conditions do vary cyclically, this study has at least two important implications for SAT.
First, when considering the ability of SAT to biodegrade a contaminant of interest, it may not be sufficient to consider the travel time of water through the system. This finding is significant, because travel time criteria are often used as guidelines or regulations for SAT operation (Fox et al., 2001, 2006; Sharma et al., 2008; Fox and Makam, 2009). The results of this study suggest that travel time, by itself, is not sufficient as a criterion or an indicator, because a longer treatment period does not necessarily result in a greater extent of biodegradation. For a chemical such as BPA, which has not been observed to biodegrade under anoxic conditions, the relevant time period is not the overall treatment time, but rather the time spent under aerobic conditions. Even for E2, which can biodegrade under denitrifying conditions, we observed that a longer treatment time (24 days in NL reactors) did not result in significantly more biodegradation than a shorter treatment time (18 days in NS reactors). Therefore, results of this study suggest that consideration of travel (treatment) time without consideration of the associated redox conditions may not adequately indicate the ability of SAT to biodegrade certain trace organic contaminants.
Second, if the cyclical operation of SAT systems results in cyclical redox conditions in the shallow subsurface, then several short cycles are likely to be better than fewer long cycles in terms of removing trace organic contaminants. In this study, longer anoxic cycles were observed to result in longer lag time for biodegradation during the aerobic cycles; therefore, flooding or infiltration cycles (which may induce anaerobic or anoxic conditions) should be kept short. However, limiting the length of infiltration cycles obviously limits the volume of water that can be processed by an SAT system. Hence, there may be some trade-off between the volume of water produced and the removal of trace organic contaminants from that water.
Limitations and future work
Experimental work reported here has four main limitations of which we are aware. First, the mesocosm reactors used in this study were spiked with an unrealistically high concentration of
Second, the experiments reported here were conducted in batch systems, and most water reuse technologies (e.g., SAT or riverbank filtration) include transport, that is, flow of the water, with associated advection and dispersion of the chemicals of interest. Therefore, the experiments conducted here are not true analogs or models for water reuse. We contend that batch mesocosm experiments are an appropriate method with which to begin, in an effort to isolate the effects of alternating redox conditions before adding the additional confounding factors introduced by transport. Future experimental work should move from batch mesocosms to column experiments that more closely mimic real water reuse. Columns could be loaded with water intermittently, and redox conditions along the column could be monitored along with the concentrations of target analytes. We hypothesize that similar chemical behavior would be manifested in such column experiments; for example, biodegradation of EDCs would occur preferentially in aerobic zones, and that at a fixed location in space, longer anoxic cycles would lead to slower biodegradation during the aerobic cycles.
Third, we have not identified the biological mechanism by which BPA and E2 were degraded during this study. Previous work has suggested that biodegradation of EDCs may be a cometabolic process, in which biodegradable “bulk” organic carbon serves as an important primary substrate (Rauch-Williams et al., 2010). If this is the case, then the character or quality of the DOC in the system may play an important role in the biodegradation of EDCs. Although we have quantified DOC removal in the mesocosm experiments (Table 2), we have not characterized the quality of this DOC, nor have we determined the biological pathway by which BPA and E2 are biodegraded. Therefore, it is possible that the results observed in this study may not apply to all soil-water systems. Future work should aim both at more completely characterizing the DOC present in the reactors and at identifying the pathway of biodegradation for the target EDCs.
Fourth, the soil used in the mesocosm experiments was collected from a constructed wetland system, and has nearly 2% organic matter by mass (Table 2). Soils in real SAT systems are typically low-organic-carbon soils (Fox et al., 2005). As noted in the preceding paragraph, the character of the organic carbon in the system may be important, so a high-organic-carbon soil may yield different behavior from a low-organic-carbon soil (cf. Fox et al., 2005). There may also be other important differences between the mesocosm soil used here and soils from real SAT systems. Therefore, the column experiments proposed earlier should be constructed with real SAT soil to provide the most representative results.
Despite these limitations, we believe that this article represents an important first step in the elucidation of the effects of alternating redox conditions on the fate of EDCs in aqueous systems. Some researchers have examined the removal of estrogens during anaerobic/aerobic wastewater treatment (Dytczak et al., 2008; Li et al., 2011) but did not monitor repeated cycles of aerobic and anaerobic conditions.
Summary
Some environmental systems, including some water reuse technologies such as SAT, are characterized by alternating redox conditions. To the best of our knowledge, the biodegradation of EDCs under alternating redox conditions has not previously been elucidated. The objective of this study was to quantify how the biodegradation of two target EDCs, BPA and E2, varies under temporally varying redox conditions, that is, under alternating aerobic and anoxic conditions.
We monitored repeated cycles of aerobic and anoxic conditions in mesocosm reactors containing water and soil. BPA was biodegraded only during aerobic cycles, but E2 was biodegraded during both aerobic and anoxic cycles. When redox conditions were switched from anoxic to aerobic, biodegradation of the target EDCs commenced after a lag period during which no biodegradation was observed; the lag time for biodegradation in the aerobic cycle was longer when the anoxic cycles were longer in duration. Consistent with previous research (e.g., Kang and Kondo, 2002; Ying et al., 2003, 2008; Ying and Kookana, 2005), more rapid biodegradation of both BPA and E2 was observed under aerobic conditions than under anoxic conditions, though the difference was not statistically significant for E2.
The results of this study suggest that consideration of treatment time without consideration of the associated redox conditions may not adequately indicate the ability of a proposed technology (e.g., SAT) to biodegrade certain trace organic contaminants. In addition, with regard to SAT in particular, the length of flooding and drainage cycles may have an important effect on the degree of biodegradation achieved and, hence, on the ability of the system to provide water of an acceptable quality. Several short cycles of flooding and drying are likely to be better than fewer long cycles in terms of removing trace organic contaminants. There may also be a trade-off between the volume of water produced and the removal of trace organic contaminants from that water.
Footnotes
Acknowledgments
This material is based on work supported by the state of Florida through the Sustainable Healthy Communities initiative at the University of South Florida (USF). Any opinions, findings, conclusions, or recommendations are those of the authors and do not necessarily represent the views of USF or the state of Florida. The authors thank four anonymous reviewers who provided constructive criticism on an earlier version of this article.
Author Disclosure Statement
No competing financial interests exist.