
Abstract
Abstract
The relationship between the sky view factor (SVF) and the urban heat island (UHI) effect in Montreal is explored, by assessing the effect of SVF on air temperature (Ta) and mean radiant temperature (MRT). The amount of energy consumed by indoor heating and air conditioning is affected by Ta. The value of MRT is the sum of all short-wave and long-wave radiation fluxes absorbed by the human body that affects its energy balance and human thermal comfort. SVF in urban areas affects both Ta and MRT. We used a microscale urban climate model (ENVI-met) and simulated the effect of building geometry in four typical urban districts (each 300×300 m2 in size) in Montreal, on air and human weighted mean radiant temperature (MRThuman weighted) at 1.5-m height above the ground. Urban development consideration of a low SVF could mitigate the UHI effect, by decreasing urban temperatures and increasing outdoor thermal comfort. Most UHI studies are carried out for cities in hot and dry climates; however, UHI mitigation can also reduce energy consumption in colder cities, such as Montreal. Results of this analysis can be used in environmental urban planning standards.
Introduction
M
In our research, we performed a study of the city of Montreal in Canada. The purpose of the study was to extend the consideration of UHI mitigation to cold cities.
Three-dimensional (3D) geometrical configuration plays an important role in managing long-wave radiation heat loss. Outgoing long-wave radiation loss depends on the urban design, due to the fact that only a small part of the sky is seen from the ground surface caused by narrow streets and tall buildings creating deep canyons (Blankenstein and Kuttler, 2004). The sky view factor (SVF) can be a representative indicator for urban building density and layout. SVF is the ratio of the radiation received (or emitted) by a planar surface to the radiation emitted (or received) by the entire hemispheric environment (Watson and Johnson, 1987). Videlicet, SVF affects urban radiation exchange and urban microclimate. Meanwhile, numerous studies have studied the effect of SVF on UHI (Oke, 1988; Bottyan and Unger, 2003; Unger, 2004, 2009; Gulyás et al., 2006; Thorsson et al., 2007; Gal et al., 2009). Many studies are related to thermal comfort in urban environment (Mayer and Hoppe, 1987; Matzarakis, 2001; Lin and Matzarakis, 2008; Matzarakis and Nastos, 2011; Bröde et al., 2012). And also, the importance of research field of urban thermal comfort with using simulation was indicated in many studies (Bruse, 2007, 2009; Huttner et al., 2009). Most studies have focused on UHI intensity (the comparison between urban and rural areas) but not radiation transfer between various urban surface geometries inside urban areas.
In this research, we intend to discuss the impact of the SVF on urban microclimate, by the evaluation of air temperature (Ta), human weighted mean radiant temperature (MRThuman weighted), and wind speed (WS) in Montreal. Four typical urban areas in Montreal were compared to reveal how urban surface geometry affects SVF. The objectives of our study were (1) to demonstrate how urban layout and building facade affects urban microclimate and (2) to extend the utilization of the advanced urban environment simulator ENVI-met in urban environment studies. Such understanding is needed to develop innovative environmental planning standards for city development and redevelopment.
Selected Study Areas
Four typical urban areas in Montreal were selected for this study (Fig. 1). These areas differ in terms of function, building volume, and layout: two urban areas around Berri-UQAM station (area B) and Guy-Concordia station (area C), and two areas around Joliette station (area J) and Snowdon station (area S).
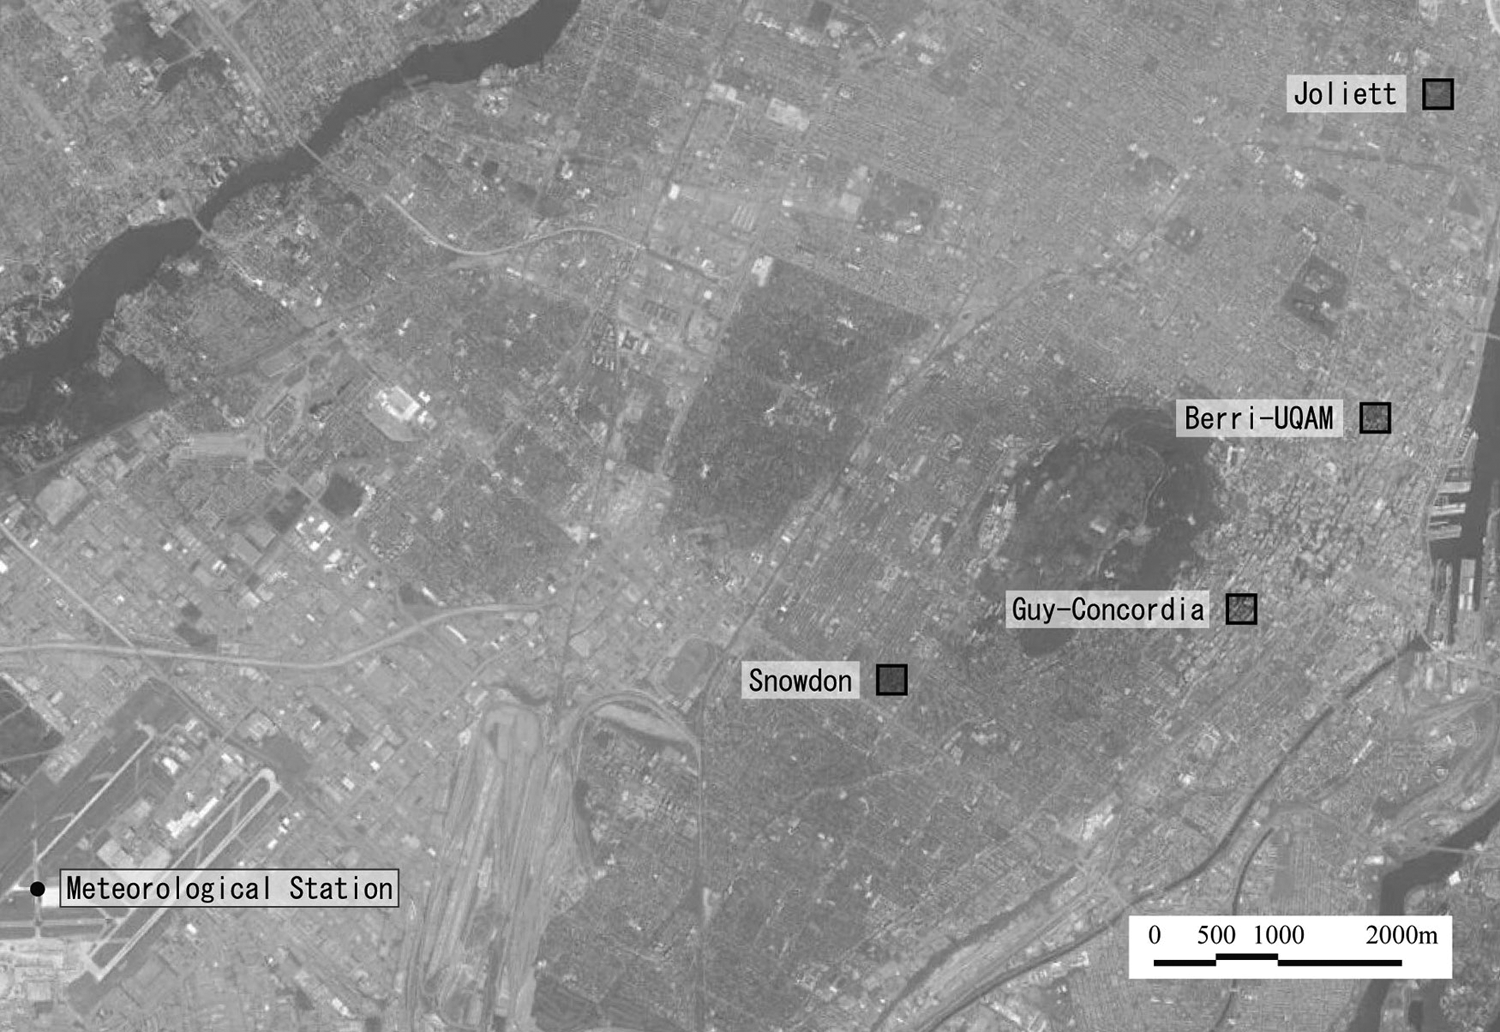
Four areas were defined close to four metro stations in Montreal city. Each selected area is 300×300 m2. Berri-UQAM station (area B), Guy-Concordia station (area C), Joliette station (area J), and Snowdon station (area S).
Three-hundred-meter distance is regarded to be the comfortable walking distance for pedestrian to access a local public transport station (O'Sullivan and Morrall, 1996; Banfield, 2003). Therefore, microclimate in 300×300 m2 grid around a station provides a critical contribution on thermal comfort in community scale. Each selected area was 300×300 m2. The urban conditions and building properties of the selected areas are shown in Fig. 2. Area C has the highest building density and area S has the highest vegetation.

Images of selected areas: (1) aerial satellite view pictures; (2) input file images for ENVI-met simulations, based on the aerial satellite view pictures; and (3) three-dimensional images of the building volumes. Dots and triangles indicate the observation receptors, and the triangles are the receptors that are used in Figure 8.
The Guy-Concordia (area C) is a high-density residential area, next to the city's main commercial area and a university. There are many high-rise residential buildings of more than 45 m. Most of the ground surface is asphalt road. The Berri-UQAM (area B) includes the city's largest library, an art gallery, shopping malls, offices, and low-rise residential buildings. There are large open spaces in the front of public buildings and around the church; consequently, there is more vegetation space than at Guy-Concordia (area C). Joliette (area J) is a district characterized by townhouses, most 6–9 m. Each house has a backyard with lawn tall trees. There are also trees in front of the houses along the streets. The Snowdon (area S) is mainly single-family detached houses. There are large spaces between each house, and each has a yard at the front and back. There are tall trees around all the houses. The amount of green space in Snowdon is the highest among the four selected areas. Details of land use, building height properties, and vegetation types in each area are introduced in Table 1.
Boldface values indicate the gross area proportion of land cover, vegetation cover, and asphalt.
Methodology
Urban environmental simulation
We used ENVI-met simulation model (a 3D computer model that analyzes microscale thermal interactions within urban environments) (Bruse, 2004, 2013) to simulate the environmental conditions in the four districts. ENVI-met is designed to simulate the surface–plant–air interactions in urban environments. It has a typical spatial resolution of 0.5–10 m, and a temporal resolution of 10 s. A simulation is typically carried out for at least 6 h (usually for 24–48 h). The optimal time to start a simulation is at night or sunrise, so that the simulation can follow the atmospheric processes. ENVI-met requires an area input file that defines the 3D geometry of the target area. This includes buildings, vegetation, soils, and receptors. A configuration file, which defines the initialization input, is also required. The data flow that is shown in Fig. 3 summaries the general interaction between input data files and output data (Bruse, 2013).

Data flow in ENVI-met V3.1 (www.envi-met.com/).
Outdoor air temperature is the most important indicator of the amount of energy consumed by indoor heating and air conditioning. Referring to the Equations (1), (6), and (7) that are shown in the Appendix, the MRT calculation in ENVI-met takes into account the radiation that was absorbed by a standing human body using projection factor ( fp). This presents the radiation absorbed by human skin that is affected by the height of sun. Therefore, at the mid-noon, when the sun is high above the head, the projection factor becomes minimum. The value of MRThuman weighted shows the sum of all short-wave and long-wave radiation fluxes absorbed by the human body that affect his energy balance. Indicator of MRThuman weighted is more accurate than using Ta to evaluate the thermal comfort (Peng et al., 2011). ENVI-met calculation of MRThuman weighted has been validated in previous studies (Bruse, 1999; Ali-Toudert and Mayer, 2006). The surrounding environment affects MRThuman weighted: building surfaces, ground surface, and the sky. For the MRThuman weighted calculations at street level, half of the long-wave radiation fluxes are assumed to originate from the upper hemisphere, and the other half from the ground and building surfaces (Appendix).
For these simulations, the geometry of urban street canyons in four areas was identified using satellite pictures and Google StreetView image from Google Map (2013); the information include building layout, building height, vegetation placement, and vegetation height. Area input files were built by ENVI-met; we input satellite pictures into the editing files, and defined the ground, vegetation, building facade, and building layout by cubic grids.
It is common to use geometric resolution of the order of 3 m in urban studies (Steinicke et al., 2009), and the pixel of several digital database of earth's surface (Herold et al., 2001; Taubenböck et al., 2009). Meanwhile, average floor height of urban building is common to be 3 m, while doing urban simulation (Huang et al., 2012; Chandurkar and Pajgade, 2013). In this study, the cubic grids with the size of 27 m3 (3×3×3 m3) are used to present the standard unit for urban environmental evaluation.
Soil characters are indicated by asphalt road, pavement, and loamy soil, observed via Google Maps in these four study areas, and modeled by the setting of natural soils and seal materials that is stored in ENVI-met database.
Simulations were run for 30 h each, starting from 6 h before sunrise, and discard the first 6 h of simulation results. We simulated each area in both summer and winter. For the sake of uniformity, observation receptors were evenly distributed along various street canyons (NE-SW Street, NW-SE Street, and Crossing Road) (Table 2). Table 3 shows the input parameters. Tables 4 and 5 show the soil and vegetation characteristics of the simulated study areas. The weather data was obtained from the “Weather Spark” database (Vector Magic, Inc., 2013). As shown in Fig. 1, it was measured at the YUL airport area in Montreal, about 5–10 km from these four study areas.
In ENVI-met, the basic structure of the receptor files is the same for the atmosphere, soil, and surface, but showing the status at selected points inside the model. Receptors are installed at the center of each road segment and the intersections at the center area of each model, and used the average amount of this kind of representative points to unify the number of receptors in all of the areas. Nine receptors for each district were defined for SVF calculation (Fig. 2). All the receptors were placed in the middle of streets. However, with the spatial limitation of the simulation model, a deviation will emerge around the edge of simulation model. This deviation will also affect the UHI simulation results with ENVI-met. Therefore, we made efforts to set all the receptors close to the center of each area in order to reduce the grid edge effect.
SVF calculation
SVF is the fraction of sky area when one looks up to the sky. An SVF of 1 is a completely open area, without any buildings or high objects obstructing the view. An SVF of 0 is a completely closed indoor environment. SVF is a quantitative standard to evaluate the spaciousness of open air, or at a point in a street, reflecting to environmental engineering and architectural psychology (Brown et al., 2001). To calculate the SVF at our receptors, we used ENVI-met model that could separate the SVF calculation with the effects of building and vegetation derives an accurate depiction of trees and other vegetation. The Equation (3) in the Appendix presents the calculation of SVF.
Correlation between simulation and measurement
ENVI-met simulations are affected by the boundaries of the studied areas. In our summary data analysis, we have mostly taken data from the interior part of the study domain, minimizing the boundary effects. Figure 4 shows the correlativity between simulation results at YUL airport area in Montreal, and measured results obtained from the Government of Canada (2013) website. The measured data was obtained from the governmental website, and the location of meteorological station is about 5–10 km from these four study areas. In the comparison, the data from 5 am on 22nd July to 5 am on 23rd July of 2012 is used for comparison. The elevation height of the measurement was 36 m. ENVI-met is found to represent well the trends of Ta and relative humidity, which shows the high R2 of 0.73 (Ta) and 0.63 (relative humidity). Numerically, simulated values of Ta are about 2–3°C underestimated in the daytime (10 am–3 pm), and about 4°C underestimated at night. Meanwhile, the relative humidity is overestimated for most of the simulation period. This discrepancy could be explained by inaccuracies in simulation input for surface materials, soil, and vegetation conditions. The unified and assumed numerical values of material properties for simulation could be the main cause of the deviation between simulation and measurement. ENVI-met simulation was set for cloud-free sky conditions. Without regarding to actual cloud cover in the model can lead to lower temperature compared with clouded sky conditions, because the energy distribution is shifted toward the diffuse component (Watson and Johnson, 1987). Meanwhile, the formulation for long-wave flux divergence does not take into account the effect of horizontal long-wave fluxes, or the effects of vegetation, only implicitly through air and surface temperatures. The maximal Ta underestimation is 4°C, observed at the evening (6 pm–8 pm), and the largest overestimation of relative humidity is about 20%, occurred at the evening (6 pm). These periods correspond to the time of sunset. The large differences could be explained by the large time steps used for updating the sun position and the radiative fluxes from the sky (set at 10 min). Without regarding the results at the evening (6 pm–8 pm), R2 of simulation and measurement data increases to 0.78 (Ta) and 0.70 (relative humidity).
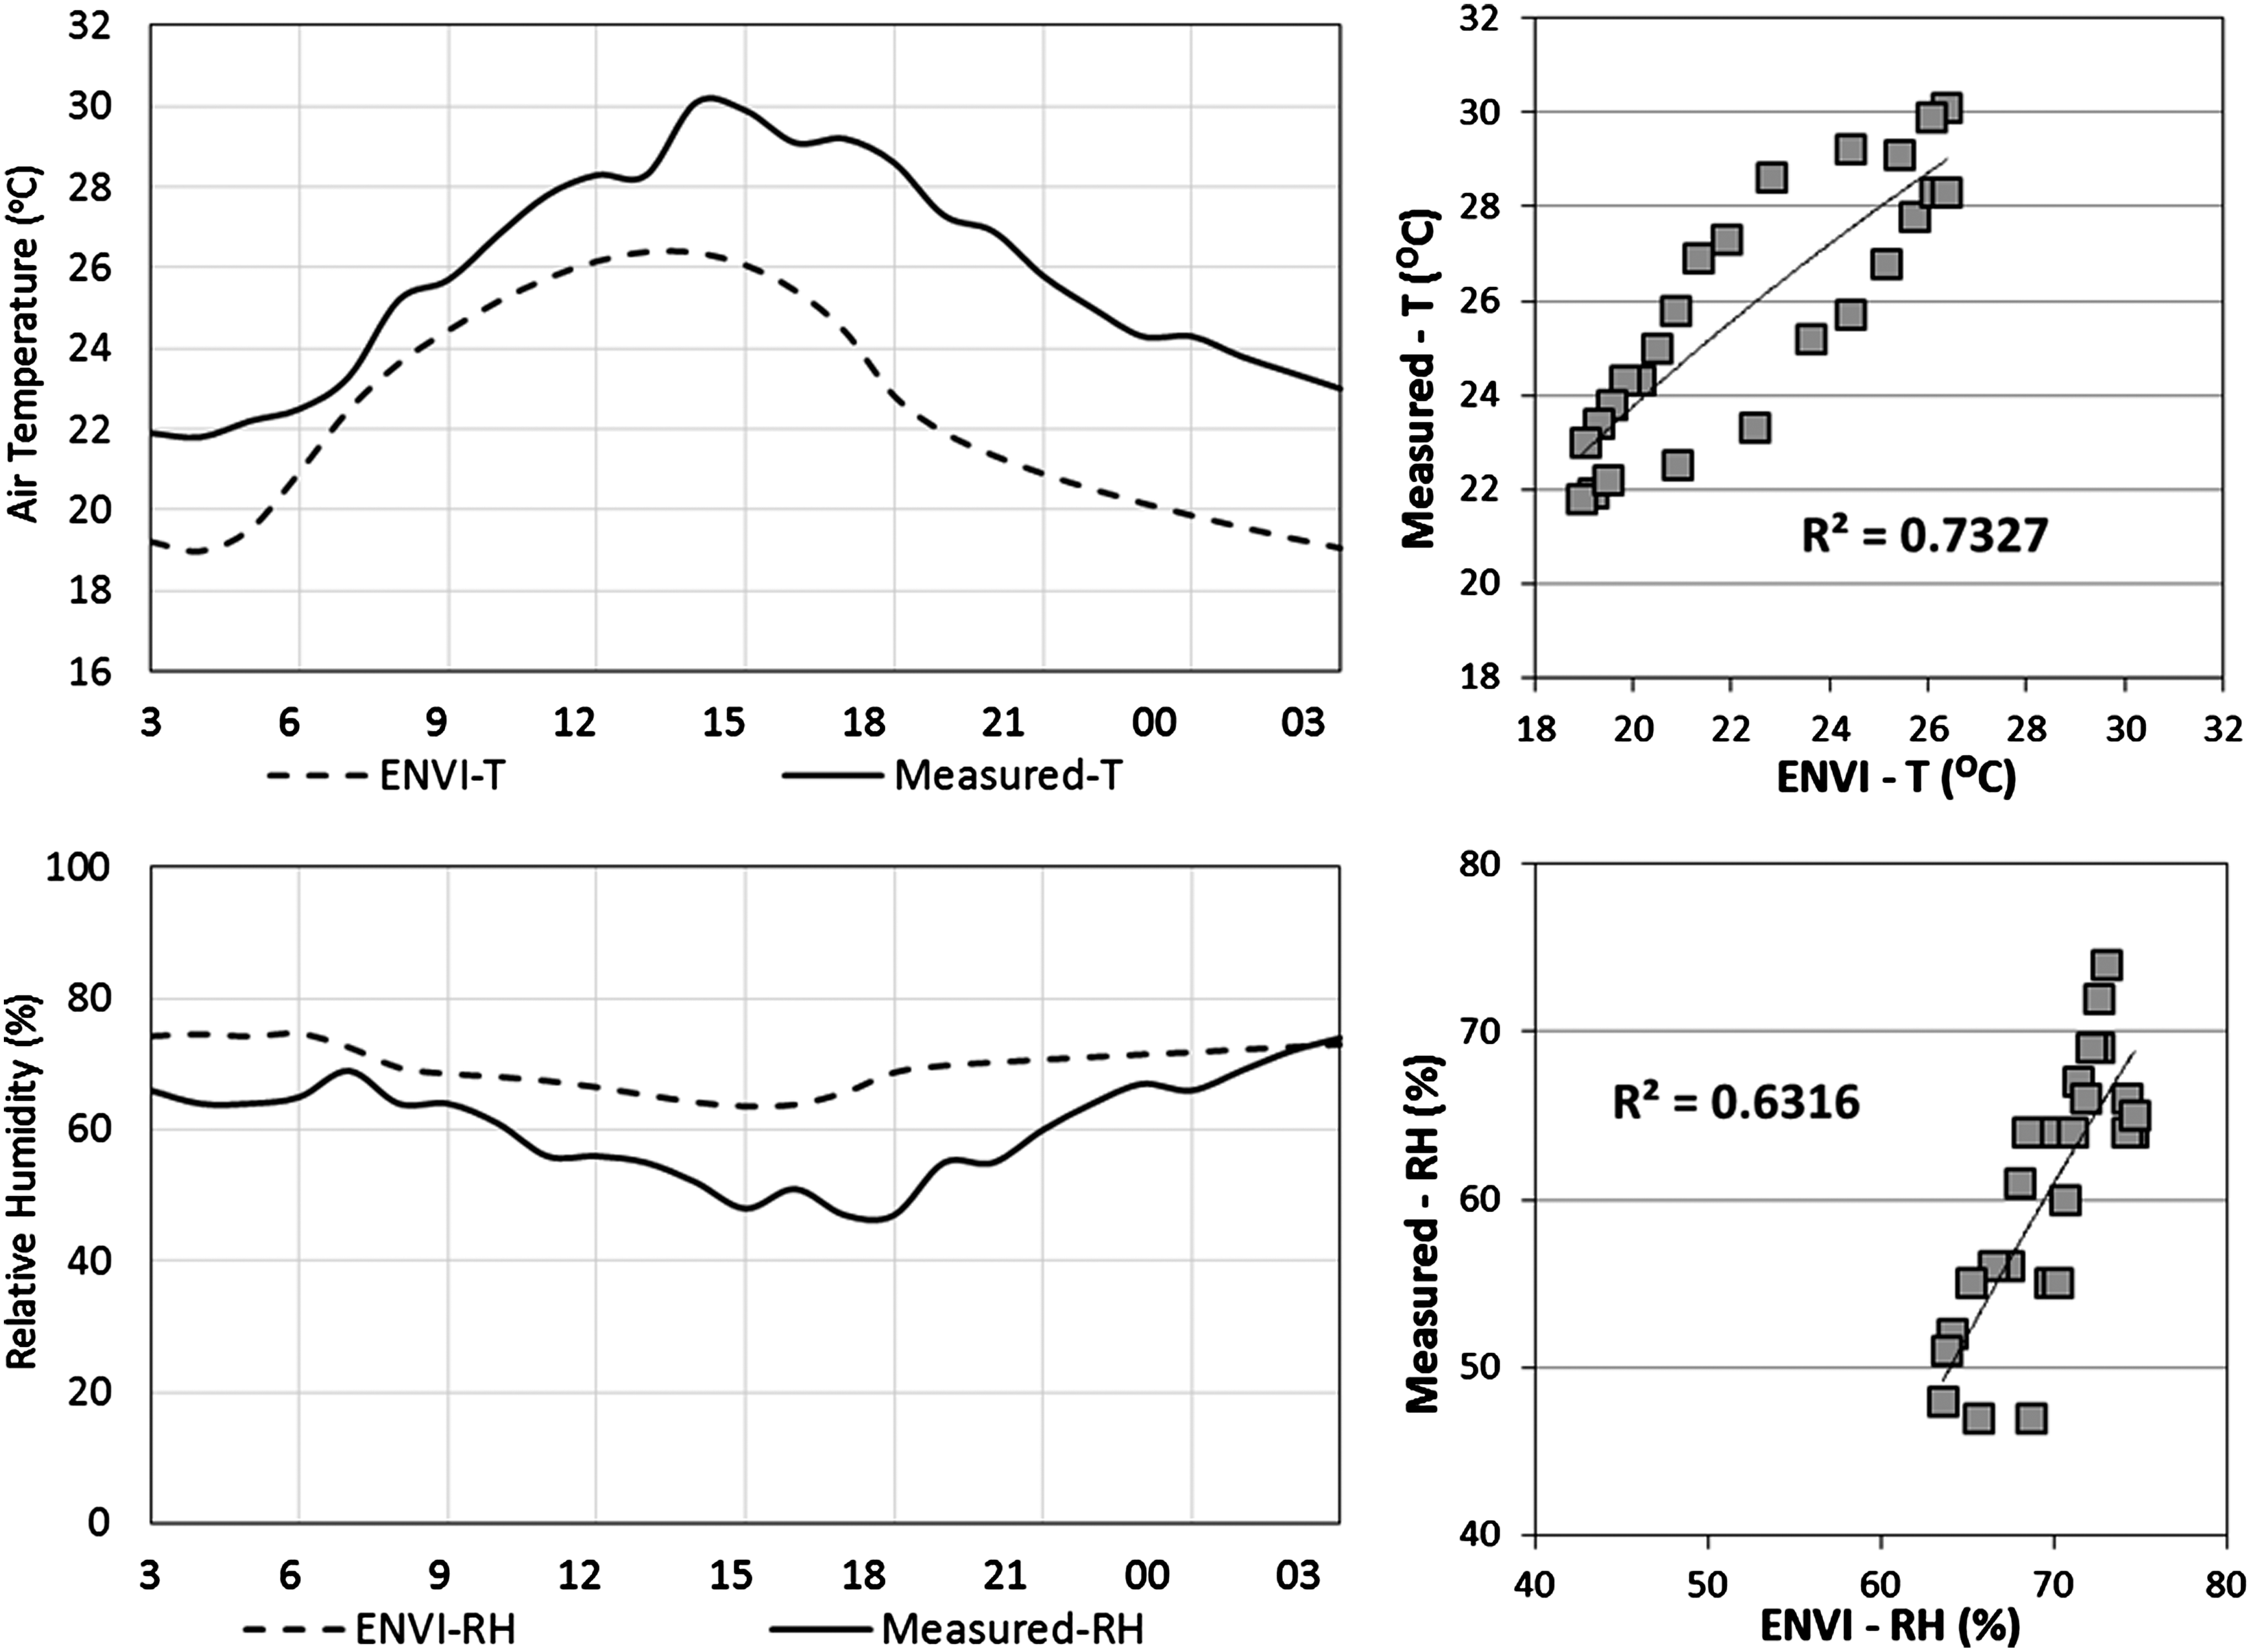
Correlativity between simulation results and measured results (location information: 45°28′00.000′′ N, 73°45′00.000′′ W; Montreal city).
Physiologically equivalent temperature
The physiological equivalent temperature (PET) is based on the Munich Energy-balance Model for Individuals (MEMI), which models the thermal conditions of the human body in a physiologically relevant way (Höppe, 1999; Matzarakis and Amelung, 2008). If air temperature, WS, vapor pressure, and the MRT are known, then it is possible to calculate a thermal comfort index. PET has the unit degree Celsius (°C) and can, therefore, be more easily interpreted by planners for design purposes (Ali-Toudert and Mayer, 2006). The model “RayMan” provides the assessment of PET (Matzarakis and Rutz, 2005). In this article, the PET is calculated using the output data from ENVI-met simulation to evaluate the thermal comfort for human.
Results
SVF comparison
Calculated SVF for both summer and winter is shown in Fig. 5. The lowest SVF is at area C, in winter, because of tall buildings and a high building density. In summer, the SVF of area S becomes to be the lowest. This is because area S has a high vegetation cover. Vegetation cover reduces ground night heat loss and diurnal heat absorption, because it obstructs the passage of long-wave radiation between the urban surface (surface of buildings and ground) and the sky. Meanwhile, the heat transfer between leaves and urban air contributes to Ta and MRThuman weighted in the summer.

SVF comparison of the observation receptor locations at ground level of the four selected areas. Area C has the minimum SVF both in summer and winter. SVF in area S is the highest in winter about 80%; trees reduce the SFV in area S to about 45% in summer. SVF, sky view factor.
In winter, area S has the highest SVF because of lack of vegetation. Area S has a high fraction of ground surfaces with a relatively low heat capacity reducing the heat storage during the day and releasing at night.
Urban environmental evaluation
Generally, UHI is higher at night, particularly during the winter. The UHI is strongest around 3–5 h after sunset (Oke, 1987; Unger, 2004). Hence, we assess the environmental properties of 4 h after sunset of a typical winter day (9 pm, 20th January) and a typical summer day (1 am, 23rd July, 2012) (Fig. 6).

Whisker plot comparison of Ta, MRThuman weighted, WS, and PET, from ENVI-met simulations, at 1.5 m above the ground, at 4 h after sunset on a typical day in summer (1 am, 23rd July) and winter (9 pm, 20th January), and the mid noon of the summer day (12 am, 22nd July). MRThuman weighted, human weighted mean radiant temperature; PET, physiological equivalent temperature; WS, wind speed.
Comparison of Fig. 5 with Fig. 6 shows that, in winter, Ta is inversely correlated with SVF at night. Without urban vegetation, the ground releases heat as long-wave radiation to the sky at night, resulting in a lower Ta. In summer, the site with the lowest Ta is area S, because of a higher vegetation density. The site with the highest Ta at night is area C, and the Ta during daytime of area C is lower than that of areas B and J. This could be explained by the shadow of high buildings in area C. The average difference of Ta between areas S and C is about 1.1°C in winter night, 1.2°C in summer night, and about 0.8°C at the noon of the summer day. The largest Ta difference at summer day is between areas B and S, up to 1.7°C. The Ta in area B is averagely 0.9°C higher than that in area C. It is demonstrated that higher SVF in winter leads to colder temperatures, potentially resulting in a heating penalty, while higher SVF in summer is beneficial at night. As the result of comparison between areas C and B, lower SVF leads to higher Ta in urban area at daytime of summer, because of the exposed high-heat-capacity pavement and lack of shadow. However, with comparing the results between areas C and S, big open space provides a potential to achieve bigger share of vegetation cover that benefits to urban cooling at daytime of summer significantly.
The MRThuman weighted (Fig. 6) is also inversely correlated with SVF (Fig. 5) in winter. Moreover, MRThuman weighted is higher in areas C and B than in areas J and S. This is because areas C and B have no vegetation, and therefore building and ground heat release is the only variables affecting MRThuman weighted. In areas J and S, vegetation obstructs the long-wave radiation from urban surfaces and reduces the radiant temperature. This can have a positive effect on the human thermal comfort in areas J and S.
In summer, the average WS is the lowest in area C, possibly because of the high density of high buildings along the streets. Average WS in area B is higher than area C. This is because area B has more open space, and buildings of lower height. In area J, the WS varies dramatically in different locations. The WS is higher in main streets than in side streets with trees on the sides. WS in area S is lower than in area J, because area S is almost entirely covered with vegetation. The higher ventilation effect in area S is one of the reasons that area S has a lower Ta than area J.
Looking at the result of PET, in the night of summer, PET in area C is about 2.5°C higher than that in area S. In the winter night, PET in area C is about 2.4°C higher than that in area S.
Figure 7 shows that as SVF increases Ta, TMRT, and PET decrease and WS increases. The coefficient of determination (R2) in winter is higher than in summer. This could be explained by the effect of vegetation in the summer. Since SVF affects the outgoing long-wave radiation, it results in a correlation between SVF and MRThuman weighted that is stronger than that between Ta and WS. Outgoing long-wave radiation reduces Ta at night, and Ta is inversely correlated with SVF. In the night of winter, the R2 of Ta against SVF is 0.53. It is lower in the night of summer, 0.25. We calculated the R2 again but without area S and three receptors on side streets in area J, to account for the effect of vegetation; the R2 in summer increased from 0.25 to 0.40.
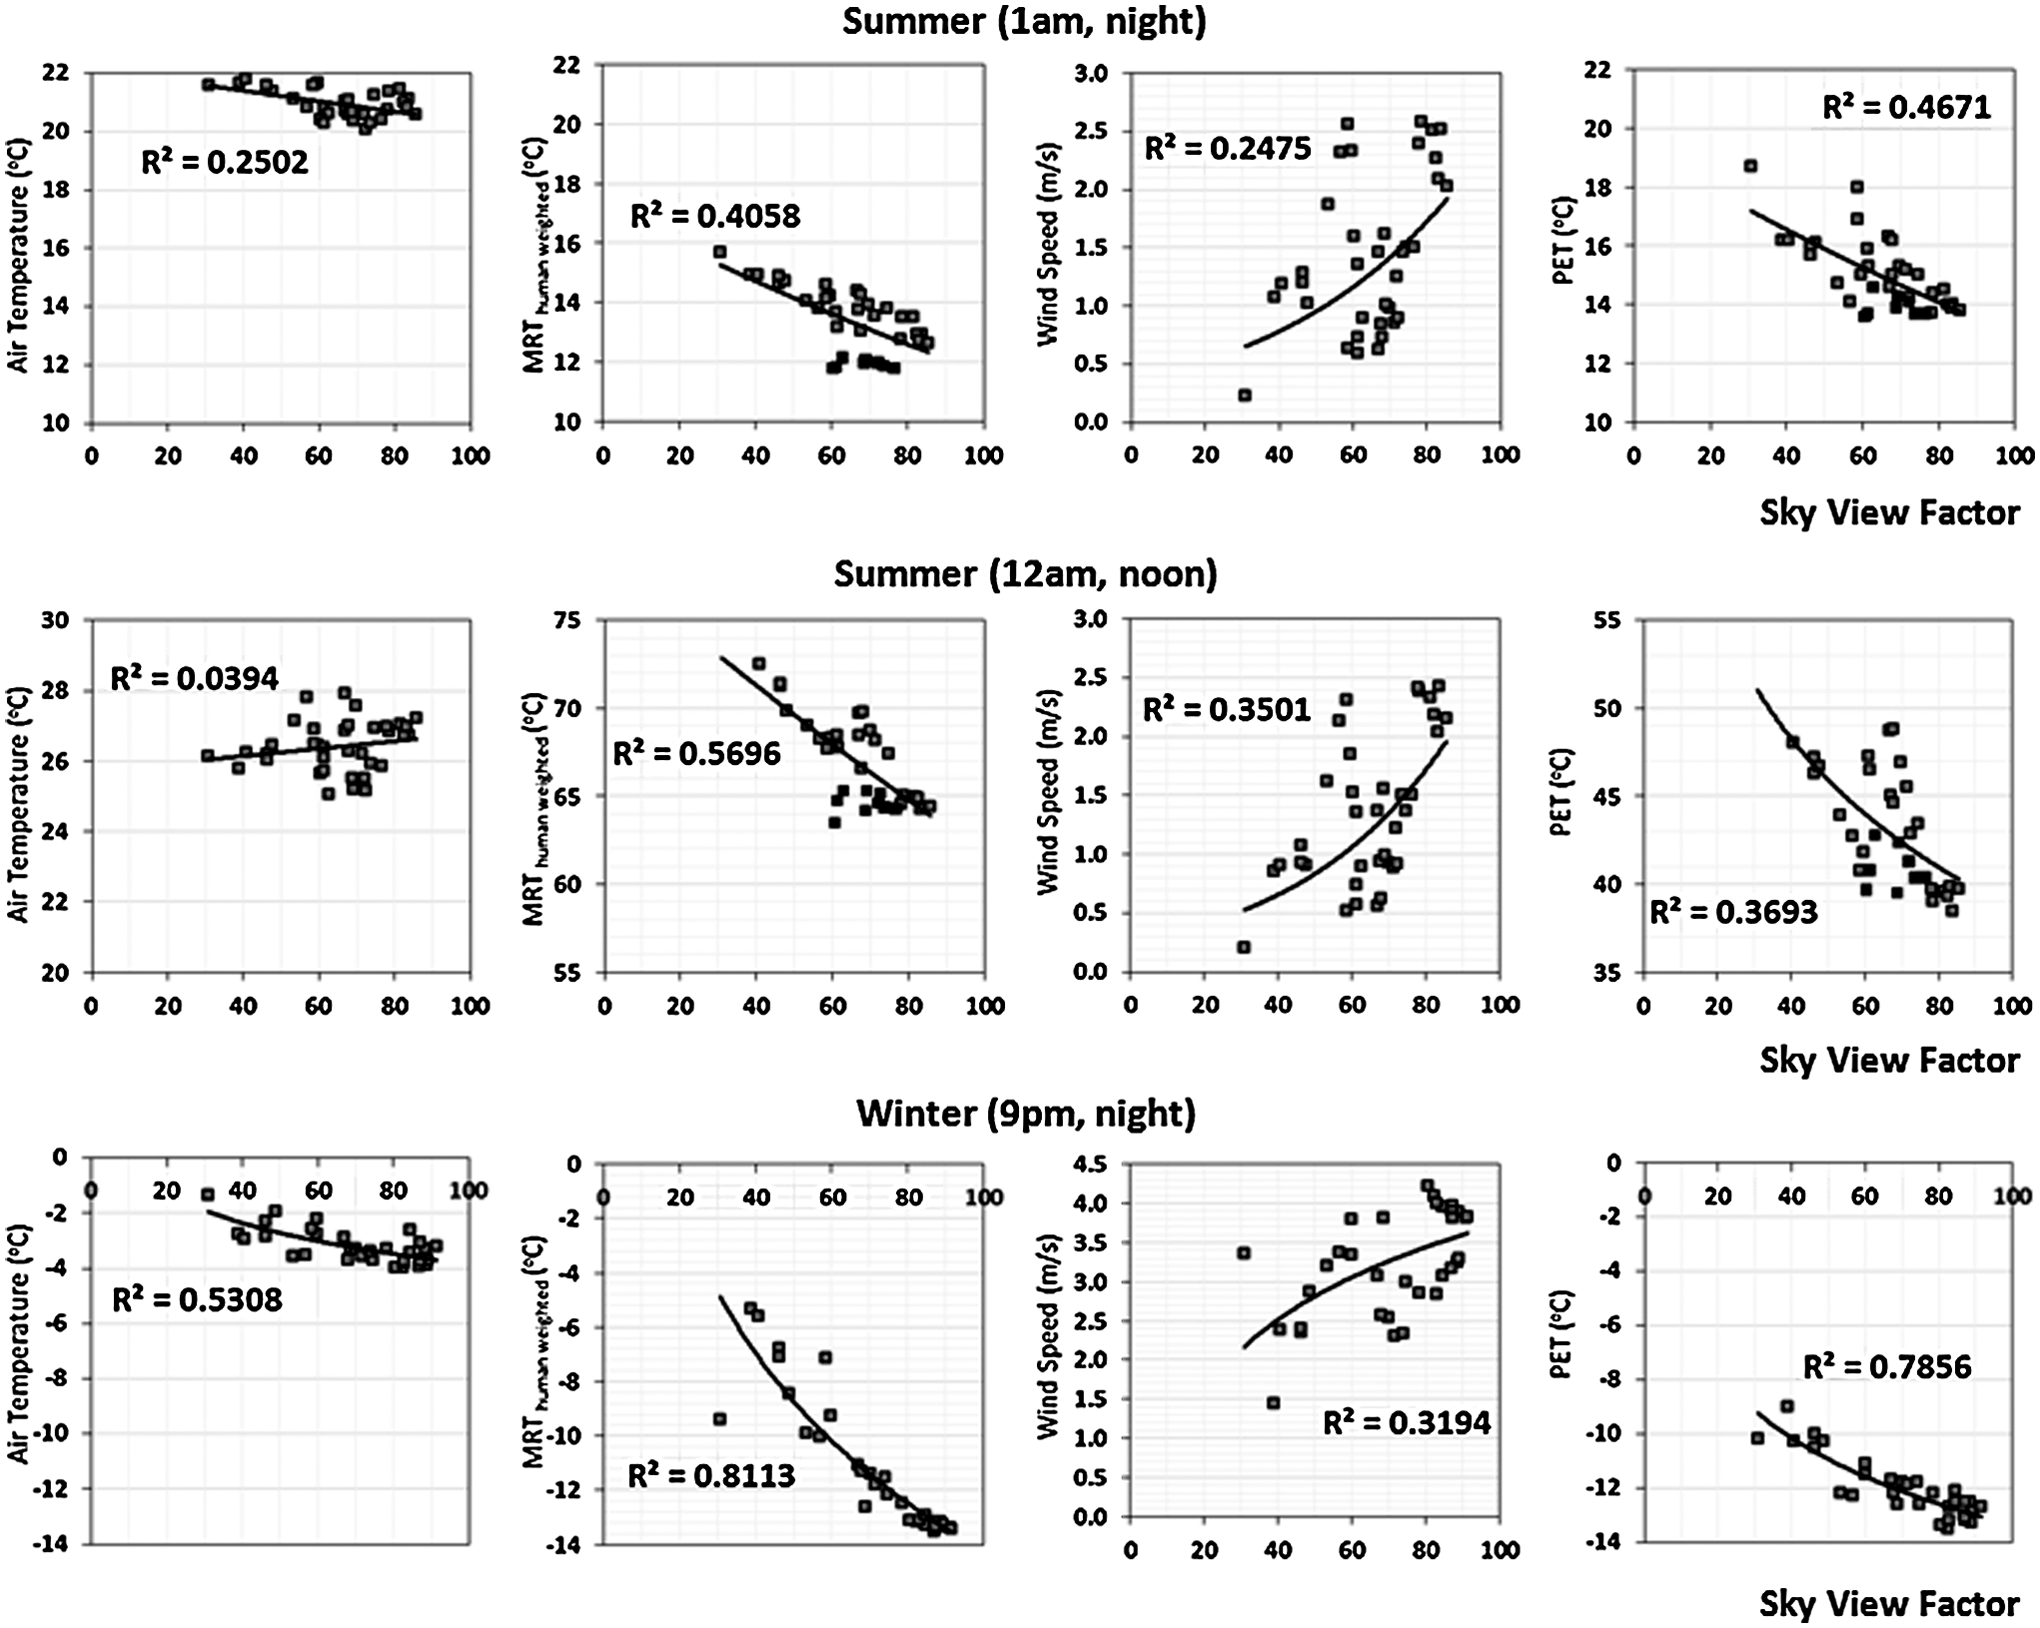
The effect of SVF (x-axis) on Ta, MRThuman weighted, WS, and PET. The data are from the receptors at 1.5 m above the ground in the four selected areas at 4 h after sunset on a typical day in summer (1 am, 23rd July) and winter (9 pm, 20 January), and the mid noon of the summer day (12 am, 22nd July). R2=coefficient of determination. Black dots of MRThuman weighted are derived data from S. SVF is inversely correlated to Ta and MRThuman weighted, proportional to WS.
Black dots on the graphs for MRThuman weighted in Fig. 7 express the simulation results from area S. They indicate that MRThuman weighted in area S is distinctly lower than in the other three areas in summer. This is because the leaves in summer moderate the UHI in area S. Without considering data for in area S, we calculated the correlation between MRThuman weighted and SVF in area C, B and J. The R2 for summer night increased from 0.41 to 0.79, and that in the noon of summer increased from 0.57 to 0.82, showing that SVF is an important factor affecting MRThuman weighted at night, without considering vegetation. However the impact of SVF is small in dense vegetation areas so the correlation is weak. The R2 of SVF with MRThuman weighted is 0.28 higher than Ta in winter night and 0.16 higher than Ta in summer night; this means that SVF has a larger effect on MRThuman weighted than on Ta.
The R2 of WS against SVF is 0.31 in the night of winter, 0.25 in the night of summer, and 0.35 in the noon of summer. It appears that SVF has a stronger effect on Ta and WS in winter than in summer. Air ventilation will be sufficiently smooth in sites with a high SVF, that is, areas with wide streets with low-rise buildings.
The R2 of PET against SVF is 0.47 in the night of summer, 0.37 in the noon of summer, and 0.79 in the night of winter. Without considering the results in area S, the PET in the night of summer increased from 0.47 to 0.53, and that in the noon increased from 0.37 to 0.45.
Air temperature and thermal comfort change in summer
In these calculations, we used the local SVF estimating Ta and MRThuman weighted (Table 6). These local SVFs are consistent with those presented in Fig. 5. These selected points appear to be representing the overall environmental characteristics of each of the four studied areas. These points are indicated in Fig. 2 with symbol “▴” in red color. The SVFs at the central points are 0.46 in C area, 0.75 in B area, 0.83 in J area, and 0.77 in S area.
In summer, as the UHI effect intensifies, indoor-cooling energy consumption increases. Outdoor environmental changes on a typical summer day were derived to assess the differences in the four selected areas (Fig. 8). For comparison, we also simulated a rural area (T-Test Soil) without any buildings (SVF=1). The ground was assumed to be only soil. For estimating UHI, Ta and MRThuman weighted at crossroads were derived for comparison. Figure 8 shows the 24-h-simulated air temperature of the selected locations. Area B has the highest Ta during daytime, and area C has the highest Ta during night time. At 2 pm, the temperature at area B is higher by 2.3°C, 1.9°C, 1°C, and 0.9°C, respectively, than area S, rural area, area J, and area C. In the daytime, Ta in area J is close to area C. When the SVF is markedly low, such as in area C (where SVF is about 20% lower than area B), the daytime Ta is lower because absorbed solar heat is less; the nocturnal Ta is higher because of the small amount of outgoing long-wave radiation. However, in area B (where SVF is about 10% lower than that in area J), Ta is higher in daytime and night time, because of the high heat-storage capacity of the area. With large amounts of vegetation cover, Ta is noticeably mitigated. This is seen in area S, which has a similar SVF as area B but is almost entirely covered by vegetation. The curve minimum of the MRThuman weighted at noon could be explained by the minimum projection factor at noon that is opposite of the sun height (Appendix).

Diurnal Ta, MRThuman weighted, and PET change at 1.5 m above the ground on a typical summer day (from 3 am, 22nd July, to 3 am the next day) in four selected areas and one reference scenario (a district of ground soil and no buildings). Diurnal Ta and MRThuman weighted of area C is the highest in all areas and that in area T is the lowest. Ta in area J is higher than that in area B during daytime, and turns to be lower during night time.
Area B has the highest MRThuman weighted at the midday, from 10 am to 1 pm (Fig. 8, MRThuman weighted). Its peak of 62.7°C is at 2 pm, 1 h after the peak of Ta. The time of the peak of 2 pm (2 h after solar noon) could be explained by the heat storage of asphalt road and building surfaces. In the daytime, MRThuman weighted in B is roughly 3°C higher than area J, 4°C higher than area C, 10°C higher than area S, and 3°C higher than rural districts. This is because of the heat reflected from buildings in high building density areas. However, from 2 pm, MRThuman weighted in area C begins to decrease; this is about 2 h earlier than the decreasing MRThuman weighted in areas B, J, and S. Moreover, MRThuman weighted of area T in morning (around 6 am–9 am) and afternoon (around 3 pm–6 pm) is obviously higher than the other areas. This could be explained by the effect of shadows made by buildings, especially the high-rise buildings, which emerge in the afternoon in area C.
After 7 pm, MRThuman weighted in area C stays 0.5–4°C higher than the other areas until late at night. This is because area C's small SVF diminishes outgoing long-wave radiation. The MRThuman weighted in area S is lower, despite it having a lower SVF than areas B and J. This is because the large amount of vegetation cover in area S and the ensemble radiation environment comprise the bioclimatology. With the exception with area S, MRThuman weighted is highly dependent on SVF during most of the day, showing the significance of SVF on outdoor human thermal comfort.
The result of PET is showing a similar trend with MRThuman weighted. In the daytime from 7 am to 6 pm, PET in area B is about 2–4°C higher than that in area C, and about 1–2°C higher than that in area J. After 6 pm, the PET in area C is about 0.5–3°C lower than the other areas. It is demonstrated that SVF affects the urban thermal comfort to some extent.
Discussion
In this analysis, we focused on the effect of SVF on outdoor temperature, MRT, and WS for a 24-h period in summer and winter. In sufficiently developed urban areas, the correlation between SVF and UHI is significant; the correlation between SVF and outdoor thermal comfort (MRThuman weighted) is particularly strong. However, the relationship in areas with dense vegetation (area S) is weak.
The urban environment contribution from vegetation shading and evapotranspiration is demonstrated in Fig. 9. This comparison and discussion is carried out in area S, because the big value of vegetation in area S could make the impact markedly. Comparison between types 1 and 2 reveals the impact of latent heat fluxes from evapotranspiration; comparison between types 2 and 3 reveals the impact of solar radiation absorption in daytime and outgoing long-wave radiation in night time from shading. In type 2, Ta is slightly higher than that of type 1 in the daytime; the biggest difference is 0.2°C, revealed from 10 am to 4 pm. The Ta of type 3 is higher than that of type 1 and type 2; the biggest different between type 3 and type 2 is 1.4°C, at 3 and 4 pm. This is to say, compared to evapotranspiration, the effect on Ta from shading is higher. Comparing MRThuman weighted, no significant difference could be observed from type 1 and type 2, and MRThuman weighted in type 3 is ∼10°C higher than the others during the daytime. This demonstrated that the shading effect on radiation absorption and release is the main effect from vegetation. Without evapotranspiration, relative humidity is decreased by 1.3–1.5% during the daytime. However, without shading, relative humidity is averagely increased 2–5% in daytime and decreased 0.7–0.9% in night time. Increase of vegetation could increase relative humidity. Overall, it is demonstrated that increasing the volume of vegetation contributes to outdoor urban comfort promotion, primarily caused by vegetation shading.

Comparison of environmental conditions at 1.5 m above the ground on a typical summer day (from 3 am, 22nd July, to 3 am the next day) in Snowdon area with three vegetation types (type 1: with vegetation; type 2: vegetation without evapotranspiration; type 3: no vegetation). Overall, it revealed that increasing of vegetation increases relative humidity, and reduces Ta, MRThuman weighted, WS, and PET.
Comparing PET between with and without vegetation evapotranspiration, no significant difference could be observed. The PET without shading in type 3 is about 4.1–7.4°C higher than that with vegetation shading in type 1 and type 2, during the daytime from 7 am to 6 pm. The PET difference is low as 0.3–0.6°C during the night after 7 pm. It is to say, vegetation shading is a significant factor to urban thermal comfort.
For testing the effect of varying vegetation on urban thermal environment with constant SVF, area C is selected to analyze the potential for varied vegetation types. Based on the original plan, two additional plans are designed for comparison, as shown in Fig. 10. The area of C with grass is a plan with lawn around all of the building blocks, and the area of C with tree is a plan of 10-m tree with a 3-m-wide crown planted along the street every 6 m.
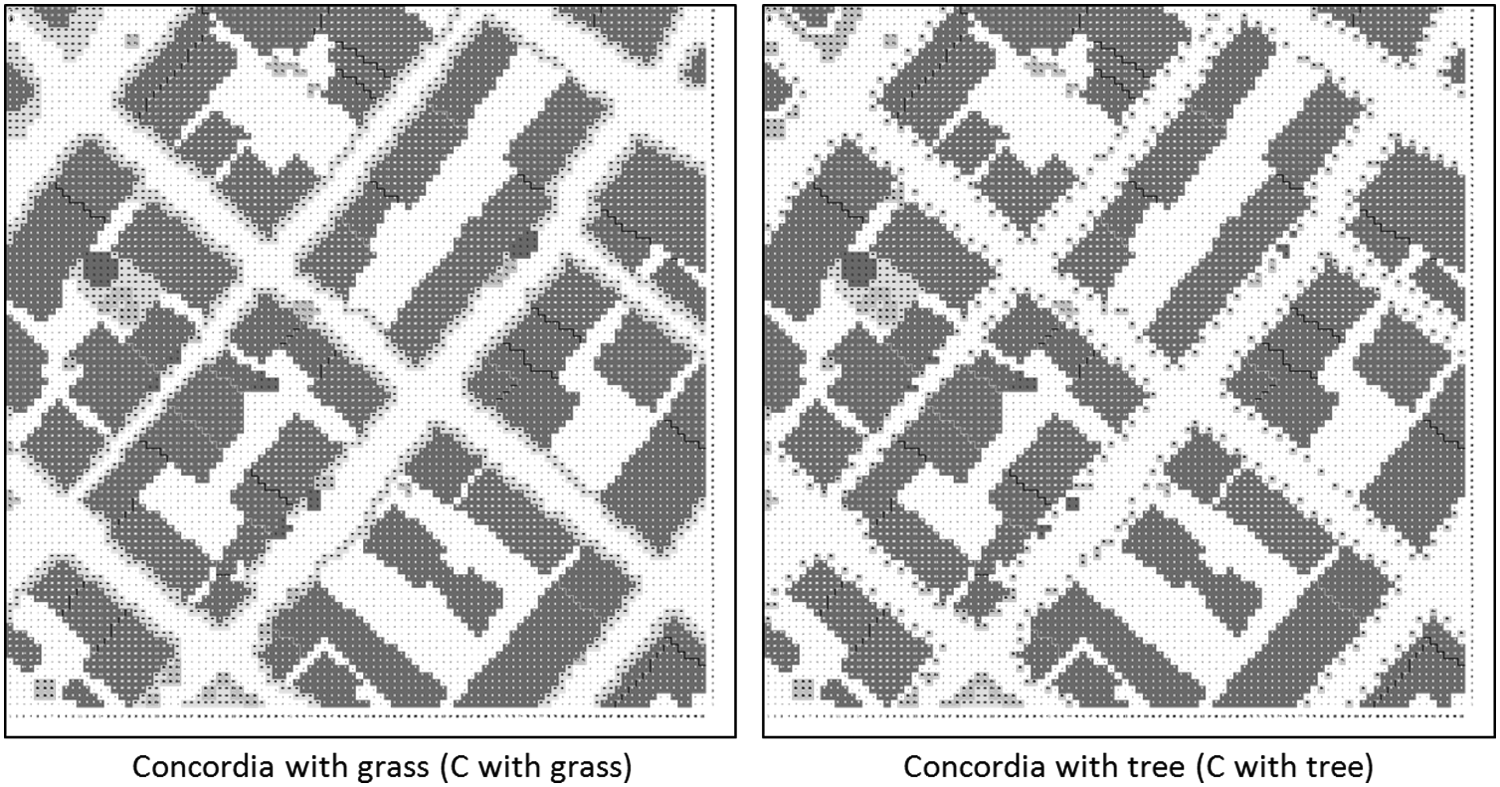
Area input file to the ENVI-met for comparison of varied vegetation.
As shown in Fig. 11, area C with tree is cooler than the other two plans all over the day, especially during 8 am–6 pm. Compared with the original status, Ta is 0.2–0.3°C, MRThuman weighted is 1.2–2.7°C, and PET is 0.8–1.8°C lower in area C with tree during the meantime. However, in the night, the contribution from vegetation to Ta, MRThuman weighted, and PET shows only 0.1–0.2°C difference, which is smaller than that of the difference between area C and area B. It is to say, in the daytime, tall vegetation benefits to reducing the urban heating with the shading, and higher SVF contributes to cooling down the city at night.

Comparison of Ta, MRThuman weighted, and PET at 1.5 m above the ground on a typical summer day (from 3 am, 22nd July, to 3 am the next day) in Concordia area with three vegetation types.
The effect of building surface materials is shown in Fig. 12. This comparison and discussion is carried out in area C, which has the highest volume of building in the four studied areas. We compared Ta and MRThuman weighted at human-height level, among three building types with various albedo of roof material. The biggest difference of Ta between albedo of 0.1 and 0.7 is 0.2°C, which was observed during 10 am–2 pm. Meanwhile, the difference of MRThuman weighted is <0.1°C, and the difference of PET is about 0.2–0.3°C during 9 am–4 pm. It is demonstrated that the impact of SVF on UHI is higher than that of the property of building surface materials. Considering the weakness of ENVI-met in exploring the long-wave flux divergence in the model and the effect of thermal properties of materials, the actual effect of increase of building surface albedo on local thermal comfort should be more significant than the predicted result. In our analysis, we did not consider the effect of heat emission from transportation and buildings. Man-made heat can cause a significant increase in the local temperature, depending on the building density and urban configuration. Increasing the albedo of building surfaces decreases the surface temperature of buildings, reduces the energy consumption during hot weather, and reduces the heat emission from inside of buildings, and leads to mitigate UHI (Akbari et al., 2001). The effect of building surface materials on urban microclimate needs further investigation.
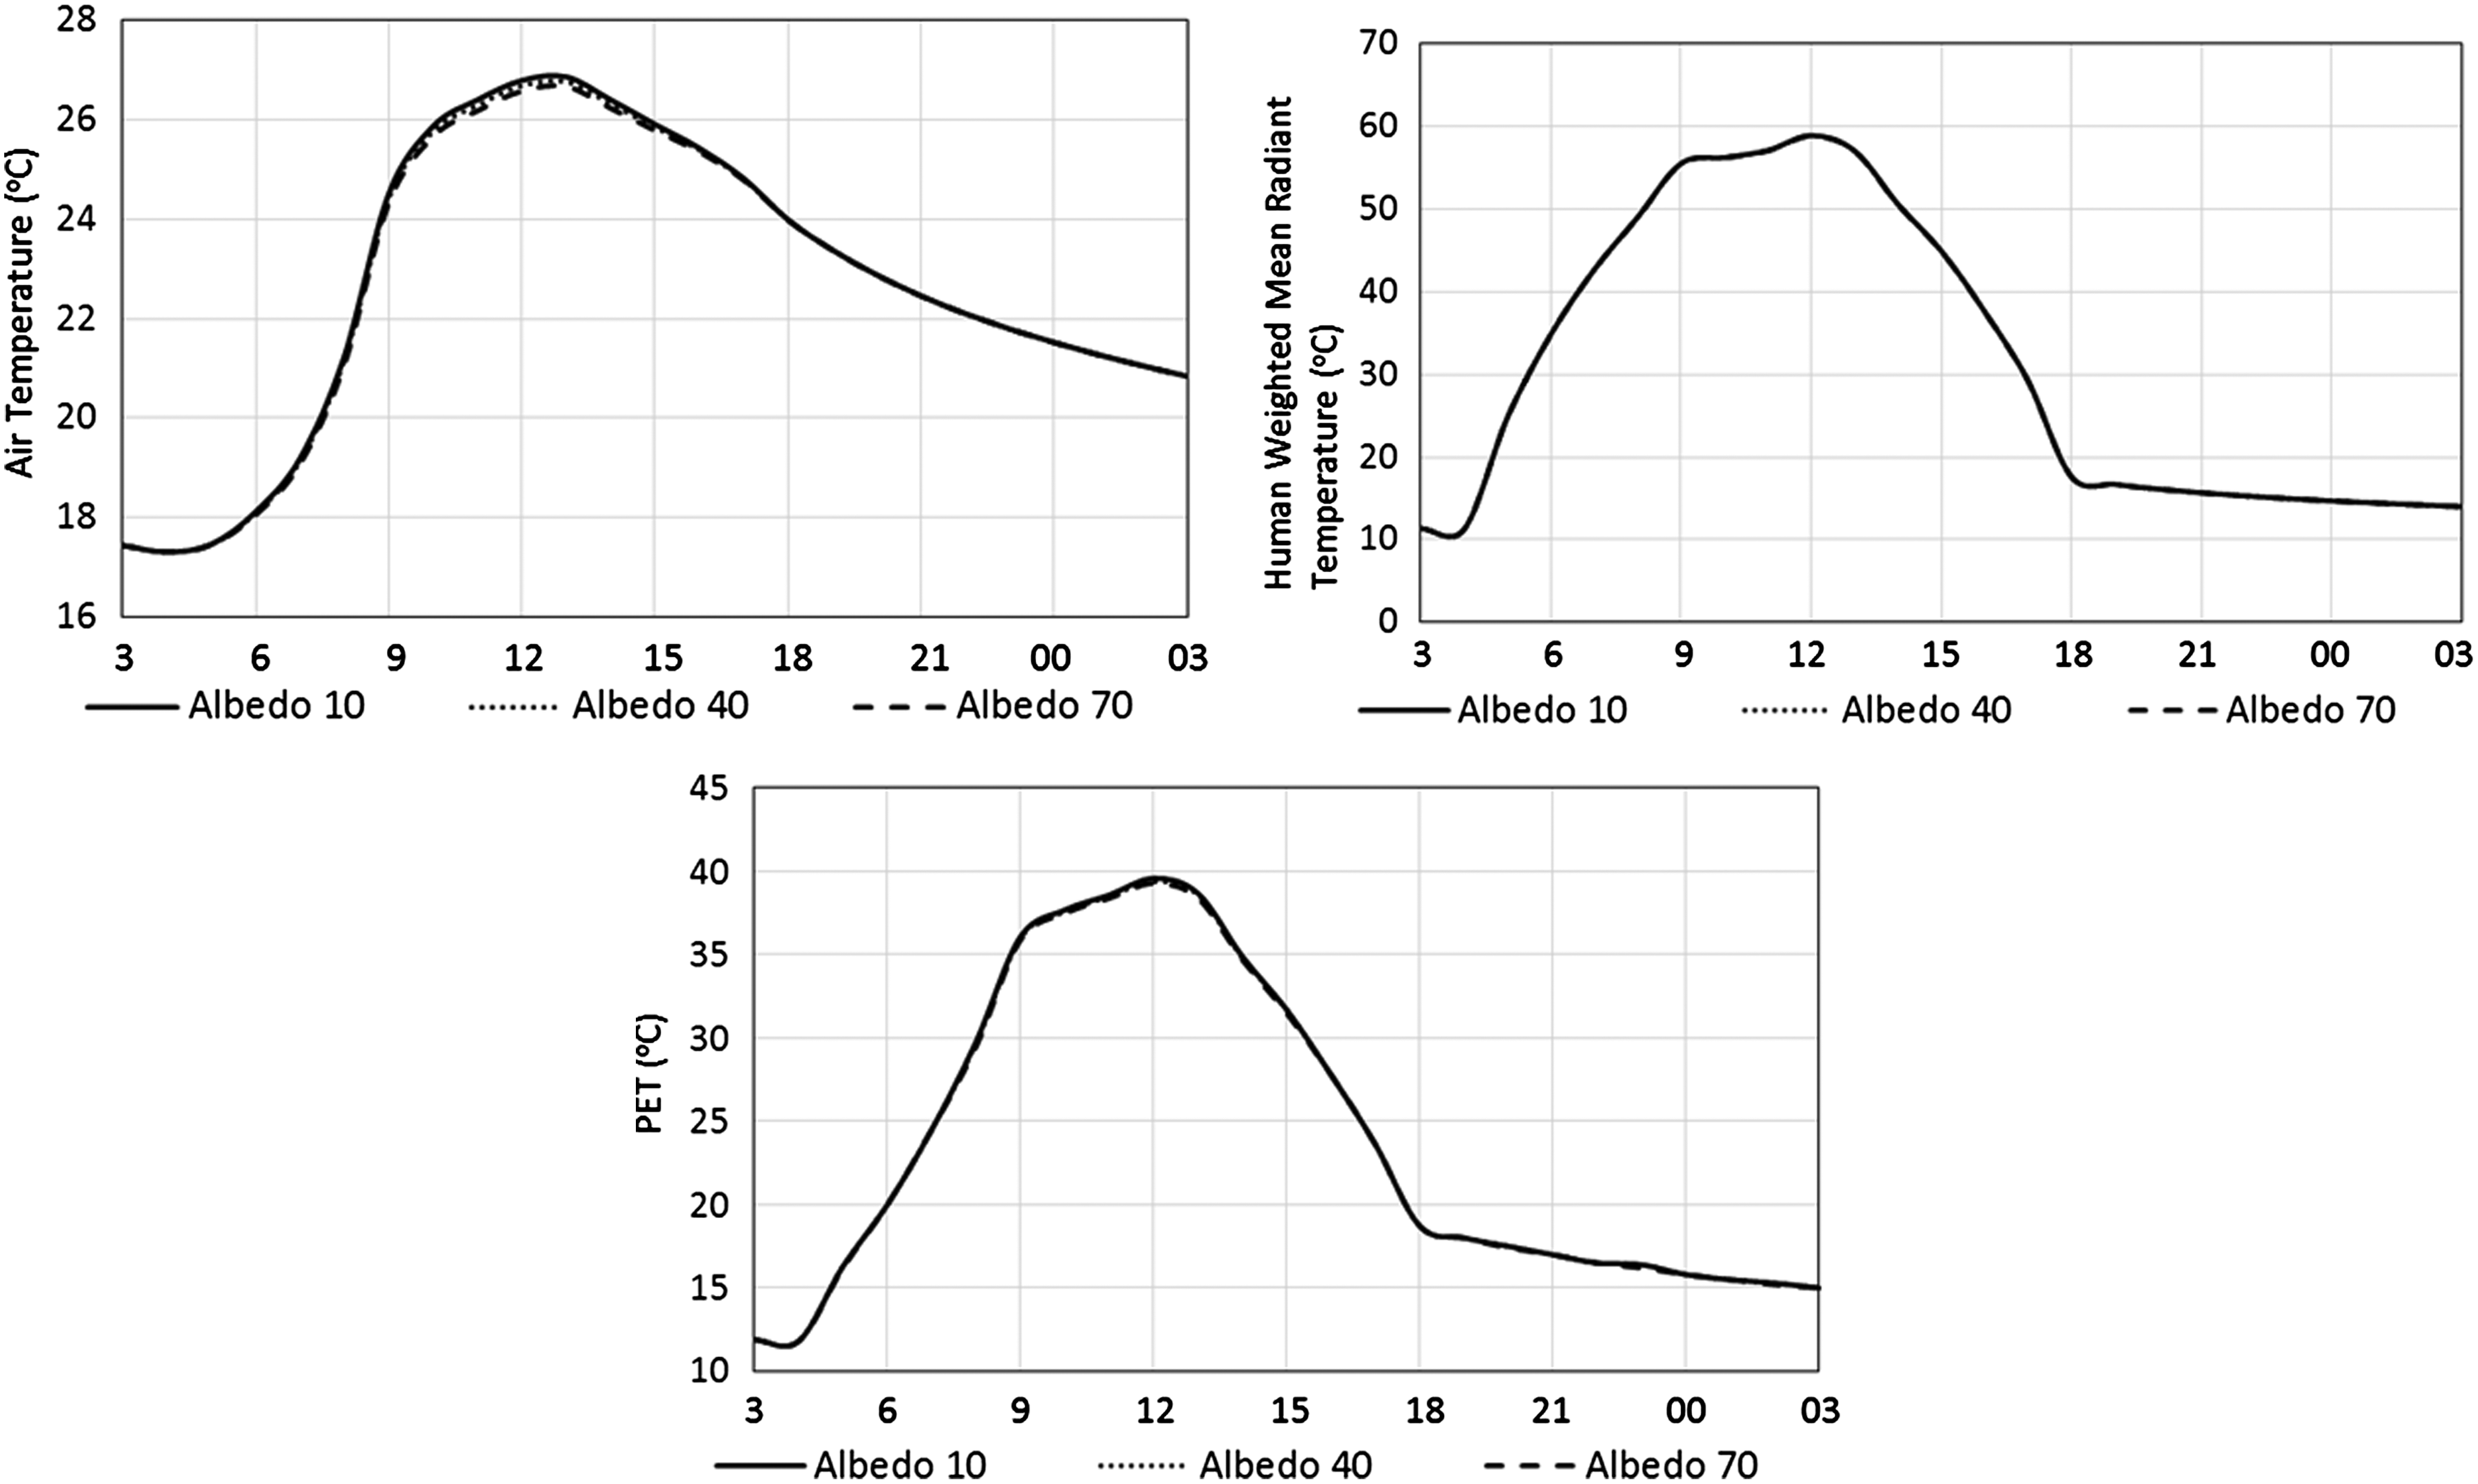
Comparison of Ta, MRThuman weighted, and PET at 1.5 m above the ground on a typical summer day (from 5 am, 22nd July, to 4 am the next day) in Concordia area with three building surface material types (10: albedo of roofs is 0.1; 40: albedo of roofs is 0.4; 70: albedo of roofs is 0.7).
In our analysis, it is evident that high SVF leads to UHI mitigation in city centers. With the growth of a city economy and population density, demand for real estate increases. With the high demand for commercial buildings, residential buildings, and city service facilities, it is not possible to reduce the building density in cities. However, it is possible to focus on the SVF in the planning process for urban development or redevelopment. SVF preservation policy will be a critical issue to moderate microscale urban climates. To preserve the SVF in a city, policies need to be developed for open space addition and building facade design and materials. This consideration decreases the proportion of building area in the urban area, potentially increases the possibility of urban surface property improvement with vegetation or high-moisture-content-paving materials.
Growth of big cities leads to higher population densities, concomitant facility demand, and commercial opportunities. Advantages of big cities also lead to energy consumption reduction and living comfort promotion. We suggest to increase SVF with a preservation of building volume, building floor area, and the capacity for city industry (Wang et al., 2011) to provide daily services for citizens in high-density areas.
Policy Implication
Most Canadian cities do not have comprehensive UHI mitigation policies. The goal of this study (and similar studies) is to carry out analysis to support development of such policies. The fundamental approaches in UHI mitigation are reducing the solar heat gain during the day and increasing radiation heat loss during the night. Customized analysis of SVF and building albedo can help development of such policies.
Planning
Chaotic and planless urban sprawling is an important issue of urban environment deterioration. Here, it was demonstrated that SVF can be used as a suitable index to evaluate the environmental effects of urban canyons. Higher SVF in summer benefits to energy consumption for cooling at night, while higher SVF leads to colder air temperature in winter, potentially increases energy consumption for heating. However, it is not a universal blessing at all times and in all seasons. It is demonstrated that higher SVF at the daytime of summer leads to higher air temperature in urban area. Meanwhile, the environmental penalty of high SVF in daytime of summer could be eliminated by planning bigger amount of vegetation in the big open spaces. Therefore, the SVF manipulation should be carried out with optimum levels according to the effect in varied weather conditions and accompanying with appropriate vegetation planning.
SVF could be used as a tool to develop policies relating urban planning and urban environment. However, urban planning alteration for urban climate change mitigation can only be achieved in a long-term planned redevelopment period. This long-term objective could be achieved by urban policies that promote increasing urban SVF. Complementary policies could involve open-space placement, building style restricting, and building density adjustment. Such guidelines should pay attention to the preservation of high building floor density in central urban areas, in order to avoid the negative impacts on urban economic development (Wang et al., 2011).
Building and pavement materials
Reflectivity of urban surface materials could affect the absorption of solar radiation in daytime. Cool building and pavement materials result in lowered ambient temperatures. Lower temperature reduces demand for electricity for air conditioning and decreases production of smog (ozone). For pavements, the initial higher incremental cost may be offset by lifetime savings through the energy and smog savings and substantially longer lifetime of cool pavements. Since most roofs have regular maintenance schedules or are re-roofed or recoated periodically, in most applications, cool roofs incur no additional cost. Cool material concoction could be considered as the most effective and economical method for UHI mitigation. Compared with the adjustment of urban redevelopment, urban surface material promotion is more feasible in a short term. Urban policy support and technical support system building up for popularizing the conduction of cool building/urban surface material should be provided in further policy analysis.
Vegetation
Urban tree planting provides a more pleasant, healthful, and comfortable environment in which to live, work, and play, saving in the costs of providing a wide range of urban services and substantial improvements in individual and community well-being. Increasing of SVF potentially leads to the increasing of open space and vegetation area in cities. In this research, it is demonstrated that urban vegetation contributes to urban diurnal thermal environment, because of the shading. Taking the advantage of vegetation planning in the bustling districts in commercial centers or business centers where are used in the daytime could effectively optimize urban thermal comfort for pedestrian and reduces the heating energy consumption in a summer day. The challenge is to balance the many benefits and costs that are associated with urban trees. Low-cost tree planting programs can be designed so they can offer savings to communities that plant trees. Related guidelines should include applicable vegetation types that adapt to the demand of varied land-use styles.
Conclusions
This study points out that SVF is one of the most important factors that affects urban environment. We analyzed heat island intensity in four typical areas in Montreal. In a typical summer day, the largest diurnal Ta difference reaches up to 2.4°C (between areas B and S), and the largest nocturnal Ta difference is 1.9°C (between areas C and S). The Ta difference between areas C and T is more than 0.9°C in daytime and 1.3°C at night. The largest diurnal MRThuman weighted difference reaches up to 13.5°C (between areas B and S), and the largest nocturnal MRThuman weighted difference is 4.2°C (between areas C and S). The MRThuman weighted difference between areas C and T is about 4.5°C at night. The largest diurnal PET difference reaches up to 8.9°C (between areas B and S), and the largest nocturnal PET difference is 2.5°C (between areas C and S). The PET difference between areas C and T is averagely 3.1°C in daytime and 2.9°C at night. Many factors are affecting Ta and MRThuman weighted, such as SVF, vegetation, speciality of building and ground surface, and so on. However, SVF was demonstrated to be a strong causation factor of the UHI.
In Montreal, the second largest city of Canada, there is always new development projects under construction. The layout and building form of city continues to change slowly, as well as the urban climate in a microscale. For reducing heat island and promoting the outdoor thermal comfort, a high SVF should be considered in the urban planning stage.
This research is based on the simulation data analysis and discussion. We used ENVI-met that allowed us to compare UHI between existing city areas, and to determine the environmental impact of the SVF. Further researches could include comparisons between specified urban geometry changes, varied urban vegetation volumes, and the impacts of different building surface coatings and ground surface materials. These technical analyses contribute to environmental policy development for UHI mitigation.
Footnotes
Acknowledgments
This research was partially funded by an NSERC Discovery grant. The authors appreciate Professor Michael Bruse (University of Mainz, Germany) for providing the advanced free environmental simulation program (ENVI-met), and Professor Andreas Matzarakis (Alberts-Ludwigs-University Freiburg, Germany) for providing the advanced free model “RayMan.”
Author Disclosure Statement
No competing financial interests exist.
Appendix
ENVI-met gives a good approximation of Tmrt at street level, which is calculated for each grid point (z) as follows (Bruse, 1999):
Where Et(z), total long-wave radiation fluxes; Dt(z), diffuse and diffusely reflected solar radiation; It(z), direct irradiance.
Where SVF, sky view factor; z, grid point; Ew, long-wave radiation emitted by the walls; Es, downward radiation flux; Eg, long-wave radiation fluxes from the ground.
Where α, vertical angle determined by and obstacle at the azimuth angle.
Where
Where αm, mean albedo of the model area; I(z), direct solar irradiance; αmI(z), diffusely reflected solar radiation; Ds, diffuse radiation comes from the sky.
Where It(z), solar irradiance absorbed by human body; fp, projection factor;
Where φ, the sun height.