
Abstract
Abstract
Arsenic in drinking water is a major health risk in many places in the world. In this study, arsenic removal by nanofiltration membranes, NF270 and TFC-SR-2, were evaluated under various initial arsenic concentrations, initial feed pH, ionic strength, applied pressure and stirring speed, and co-occurring ions. To model arsenic rejection and understand removal mechanisms, membranes were characterized using potentiometric titration, contact angle measurements, membrane permeability, salt rejection, and pore size characterization. Results indicated that increases in the initial arsenic concentration, pH, and operating pressure and stirring speed led to enhanced As(V) rejections up to 90%. Increasing ionic strength and concentration of co-occurring ions such as sulfate, phosphate, and calcium reduced As(V) rejection. As(V) rejection was likely controlled by charge exclusion. For As(III), rejections were relatively low (less than 40%) and decreased with increasing initial As(III) concentration and ionic strength. The pH did not significantly affect As(III) rejection at pH<9.2. Efforts were made to model both As(III) and As(V) rejections. As(V) rejection data could be well represented by the Donnan-steric-pore model with proper consideration of concentration polarization. For As(III), the calculated rejection based on Spiegler–Kedem–SHP model was significantly higher than experimental data, likely caused by the affinity interaction between arsenite and membranes.
Introduction
A
Many approaches have been proposed and applied to remove arsenic from water. Conventional technologies include coagulation/precipitation (Scott et al., 1995; Hering et al., 1996), lime softening (McNeill and Edwards, 1997), ion exchange (Clifford et al., 1999), and adsorption (Manning and Goldberg, 1997; Driehaus et al., 1998; Gu et al., 2005). Nanofiltration (NF) has recently attracted much attention because a number of studies have demonstrated the effectiveness of NF membranes to reject arsenic and other divalent or polyvalent ions with high water flux under a relatively low operation pressure (Hering and Elimelech, 1996; Vrijenhoek and Waypa, 2000; Figoli et al., 2010; Sen et al., 2010). A systematic evaluation of NF membrane performance on arsenic removal, however, could not be accomplished because specific NF systems used in various studies differ from case to case in terms of membrane types, operating parameters, and application conditions. For example, Vrijenhoek and Waypa (2000) found that the As(V) rejection by a NF membrane, NF45, was much higher when 0.01 M of background electrolyte NaCl was present. Sato et al. (2002) observed that the removal of As(V) by three NF membranes, ES-10, NTR-729HF, and NTR-7250, was independent of the concentration of other ions in groundwater. It has been reported that the pH did not affect the removal of arsenic species, both As(V) and As(III), by the NF membranes (Hering and Elimelech, 1996; Waypa et al., 1997). In other studies, it was concluded that As(V) rejection by the N30F or NE 90 membranes increased with increasing solution pH values (Nguyen et al., 2009; Figoli et al., 2010). These experimental observations that were quite different might be due to the differences of membrane pore size/pore size distribution, effective charge density, feedwater composition, and membrane application assembly. Therefore, further investigations are needed to understand the effects of various operating parameters on arsenic rejection.
Theoretical frameworks or models exist for the transport of ions and organic solutes through NF (Mason and Lonsdale, 1990). The advantage of developing a transport model is that the costs can be saved by reducing the number of experiments needed for designing new membrane systems or optimizing the existing membrane installations (Straatsma et al., 2002). In recent years much effort has been made to describe solute transport through NF membranes. Tsuru et al. (1991) and Wang et al. (1995) used a homogeneous one-dimensional version of the extended Nernst–Planck equation to analyze the movement of ions through membrane pores (Tsuru et al., 1991; Wang et al., 1995). Bowen et al. derived a Donnan-steric-pore model (DSPM) from the extended Nernst–Planck equation and modified ion transport to include hindered transport with equilibrium partitioning (Bowen and Mukhtar, 1996; Bowen et al., 1997; Bowen and Mohammad, 1998). In the DSPM, rejection of ions by membrane pores was a manifestation of the equilibrium partitioning of ions at the pore–solution interface and the ionic fluxes were considered to be generated through convection-, diffusion-, and electrostatic potential-driven migration forces, as shown in Equation (1) (Bowen and Mukhtar, 1996):
where the hindered diffusivity Di.p=Ki,d Di,∞ (product of hindrance factor for diffusion and bulk diffusivity),
A limited number of studies have been focused on modeling arsenic transport through NF membranes. Oh et al. (2000) described the movement of arsenite, dimethyl arsenic acid, and arsenate through low-pressure NF membranes using the extended Nernst–Planck model. Chemical equilibrium of the arsenic compounds was considered in the model calculation. The model was later improved by coupling the extended Nernst–Planck equation with steric hindrance and Donnan equilibrium (Oh et al., 2004). These studies, however, did not account for the effect of concentration polarization (CP) on arsenic transport through the membranes. Generally, CP occurs when a membrane shows different permeabilities for the various components of a solution (Mulder, 1996). The solutes accumulate on the feed side of the membrane, leading to a higher concentration in the vicinity of the membrane than in the bulk solution, so water flux decreases due to the increase of osmotic pressure at the membrane wall and solute flux across the membrane increases because of the increased concentration gradient (Mulder, 1996). Therefore, it is necessary, in general, to incorporate CP into the modeling of arsenic rejection by membranes.
In this study, the rejections of arsenic by two NF membranes (TFC-SR-2 and NF270) were investigated under different operating conditions and the arsenic transport through the membranes was analyzed using the DSPM coupled with the CP film theory. Potentiometric titration, contact angle measurement, permeability and salt rejection, and pore size determination were performed to characterize the NF membranes to enable an in-depth understanding of the membrane performance.
Materials and Methods
Chemicals and materials
Chemicals
All chemicals were reagent grade. The solutions were prepared with the Milli-Q water (Q-H2O, with resistivity of 18.2 MΩ-cm; Millipore Corp.). Sodium arsenate (Na2HAsO4•7H2O, 99%), sodium arsenite (NaAsO2, 99%), potassium iodide, glucose, and maltose were obtained from Sigma-Aldrich. Sodium chloride, sodium hydroxide, hydrochloric acid, sulfuric acid, and phenol were purchased from Fisher Scientific. The stock solutions of 100.0 mg/L As(V) and As(III) were prepared by dissolving Na2HAsO4•7H2O and NaAsO2 in water, respectively, and filtered through a 0.22 μm membrane.
NF membranes
Flat sheet samples of two commercially available thin-film composite polyamide NF membranes, TFC-SR-2 and NF270, were used in the filtration experiments. TFC-SR-2 was supplied by Koch and NF270 was provided by Dow FilmTec. The main characteristics of the two NF membranes are listed in Table 1. The membranes were supplied and stored as dry coupons. Before being loaded into the test cell, the membranes were thoroughly rinsed with Q-H2O and then soaked in a Q-H2O bath for 24 h.
Initial concentration at 200 mg/L.
Initial concentration at 2000 mg/L.
Membrane characterization
Membrane volume charge
Potentiometric titration was performed to determine the fixed charge density of the membranes. A 100 cm2 of membrane was cut into 20 small pieces and suspended in 100 mL of 0.01 or 0.1 M NaCl solution acidified with 200 μL of 1 M HCl. The suspension was stirred magnetically and equilibrated to a constant pH level under a protective nitrogen flow to eliminate the influence of atmospheric CO2 throughout the measurements. The pH was measured by a ROSS pH electrode. The titration was performed with 0.1 M NaOH using a 798 MPT Titrino (Metrohm) equipped with a computer. Data acquisition through the computer were completed with the DataLog software.
Contact angle measurement
Static contact angles of membrane samples were measured by projecting an image of an automatic sessile droplet resting on the surface with a VCA-2500XE Video Contact Angle System (AST Products, Inc.). Membrane samples were placed on a vertically and horizontally adjustable sample stage. A microsyringe was set to automatically dispense a predetermined amount of water. After the 0.3 μL water droplet made contact with the polymer surface, a snapshot of the image was taken. After placing markers around the perimeter of the water droplet, the VCA-2500 Dynamic/Windows software calculated the right and left contact angles.
Membrane permeability and salt rejection
To measure the membrane permeability, the membranes were thoroughly rinsed with Q-H2O, soaked for 24 h, and precompacted in the membrane cell for 48 h. The flux was then determined gravimetrically by weighing the mass of permeate collected at predetermined time intervals. The membrane permeability was calculated as the slope of the linear pure water flux versus pressure line. To test the salt rejection, a 200 mL of 1 or 10 mM sodium chloride solution was added to the membrane cell, then 20 mL of permeate was collected at a certain pressure. The salt rejection was determined from the difference between the NaCl concentrations in the feed and permeate, monitored by a standardized digital conductivity meter.
Pore size determination
Membrane pore radius (rp) and ratio of effective membrane thickness to membrane porosity (Δx/Ak) are the key membrane structural parameters in the framework of the DSPM for predicting membrane performance. Spiegler and Kedem and Steric-hindrance Pore model (Spiegler–Kedem–SHP model) is able to describe the transport of uncharged solutes through membranes, and membrane pore radius (rp) and the ratio of effective membrane thickness to membrane porosity (Δx/Ak) can be obtained by fitting the rejection data of uncharged solutes, such as glucose and maltose, as a function of volume flux to this model (Wang et al., 1995; Vrijenhoek and Waypa, 2000). The experiments were conducted at different stirring speeds and incremental pressures until an asymptotic rejection value was achieved.
Experimental setup and procedures
Membrane permeability and salt rejection were evaluated in the experimental setup shown in Fig. 1, a dead-end system using a stirred Amicon cell (Model 8200) of 200 mL capacity. While the cross-flow filtration is commonly used to assess membrane processes since the resulting flux and rejection data might be more consistent with the industrial scale applications, the dead-end filtration cell is preferred for membrane selection, operating parameter optimization, and mechanism analysis because of its relatively quick processing times, minimal equipment and feedwater requirements, and the potential for longer membrane usage (Northcott et al., 2009; Lou and Wan, 2013; Tsibranska and Tylkowskia, 2013). Thus, we selected to use the dead-end filtration mode for this study. The membrane coupons used were flat sheet type with an effective membrane surface area of 28.2 cm2. The cell was pressurized by a high pressure nitrogen cylinder with the pressure determined by a gas pressure regulator. The stirring speed was controlled by a digital magnetic stirrer plate. The permeate samples were collected using a graduated cylinder and the permeate weights were measured by a digital balance (Scout Pro, Ohaus).
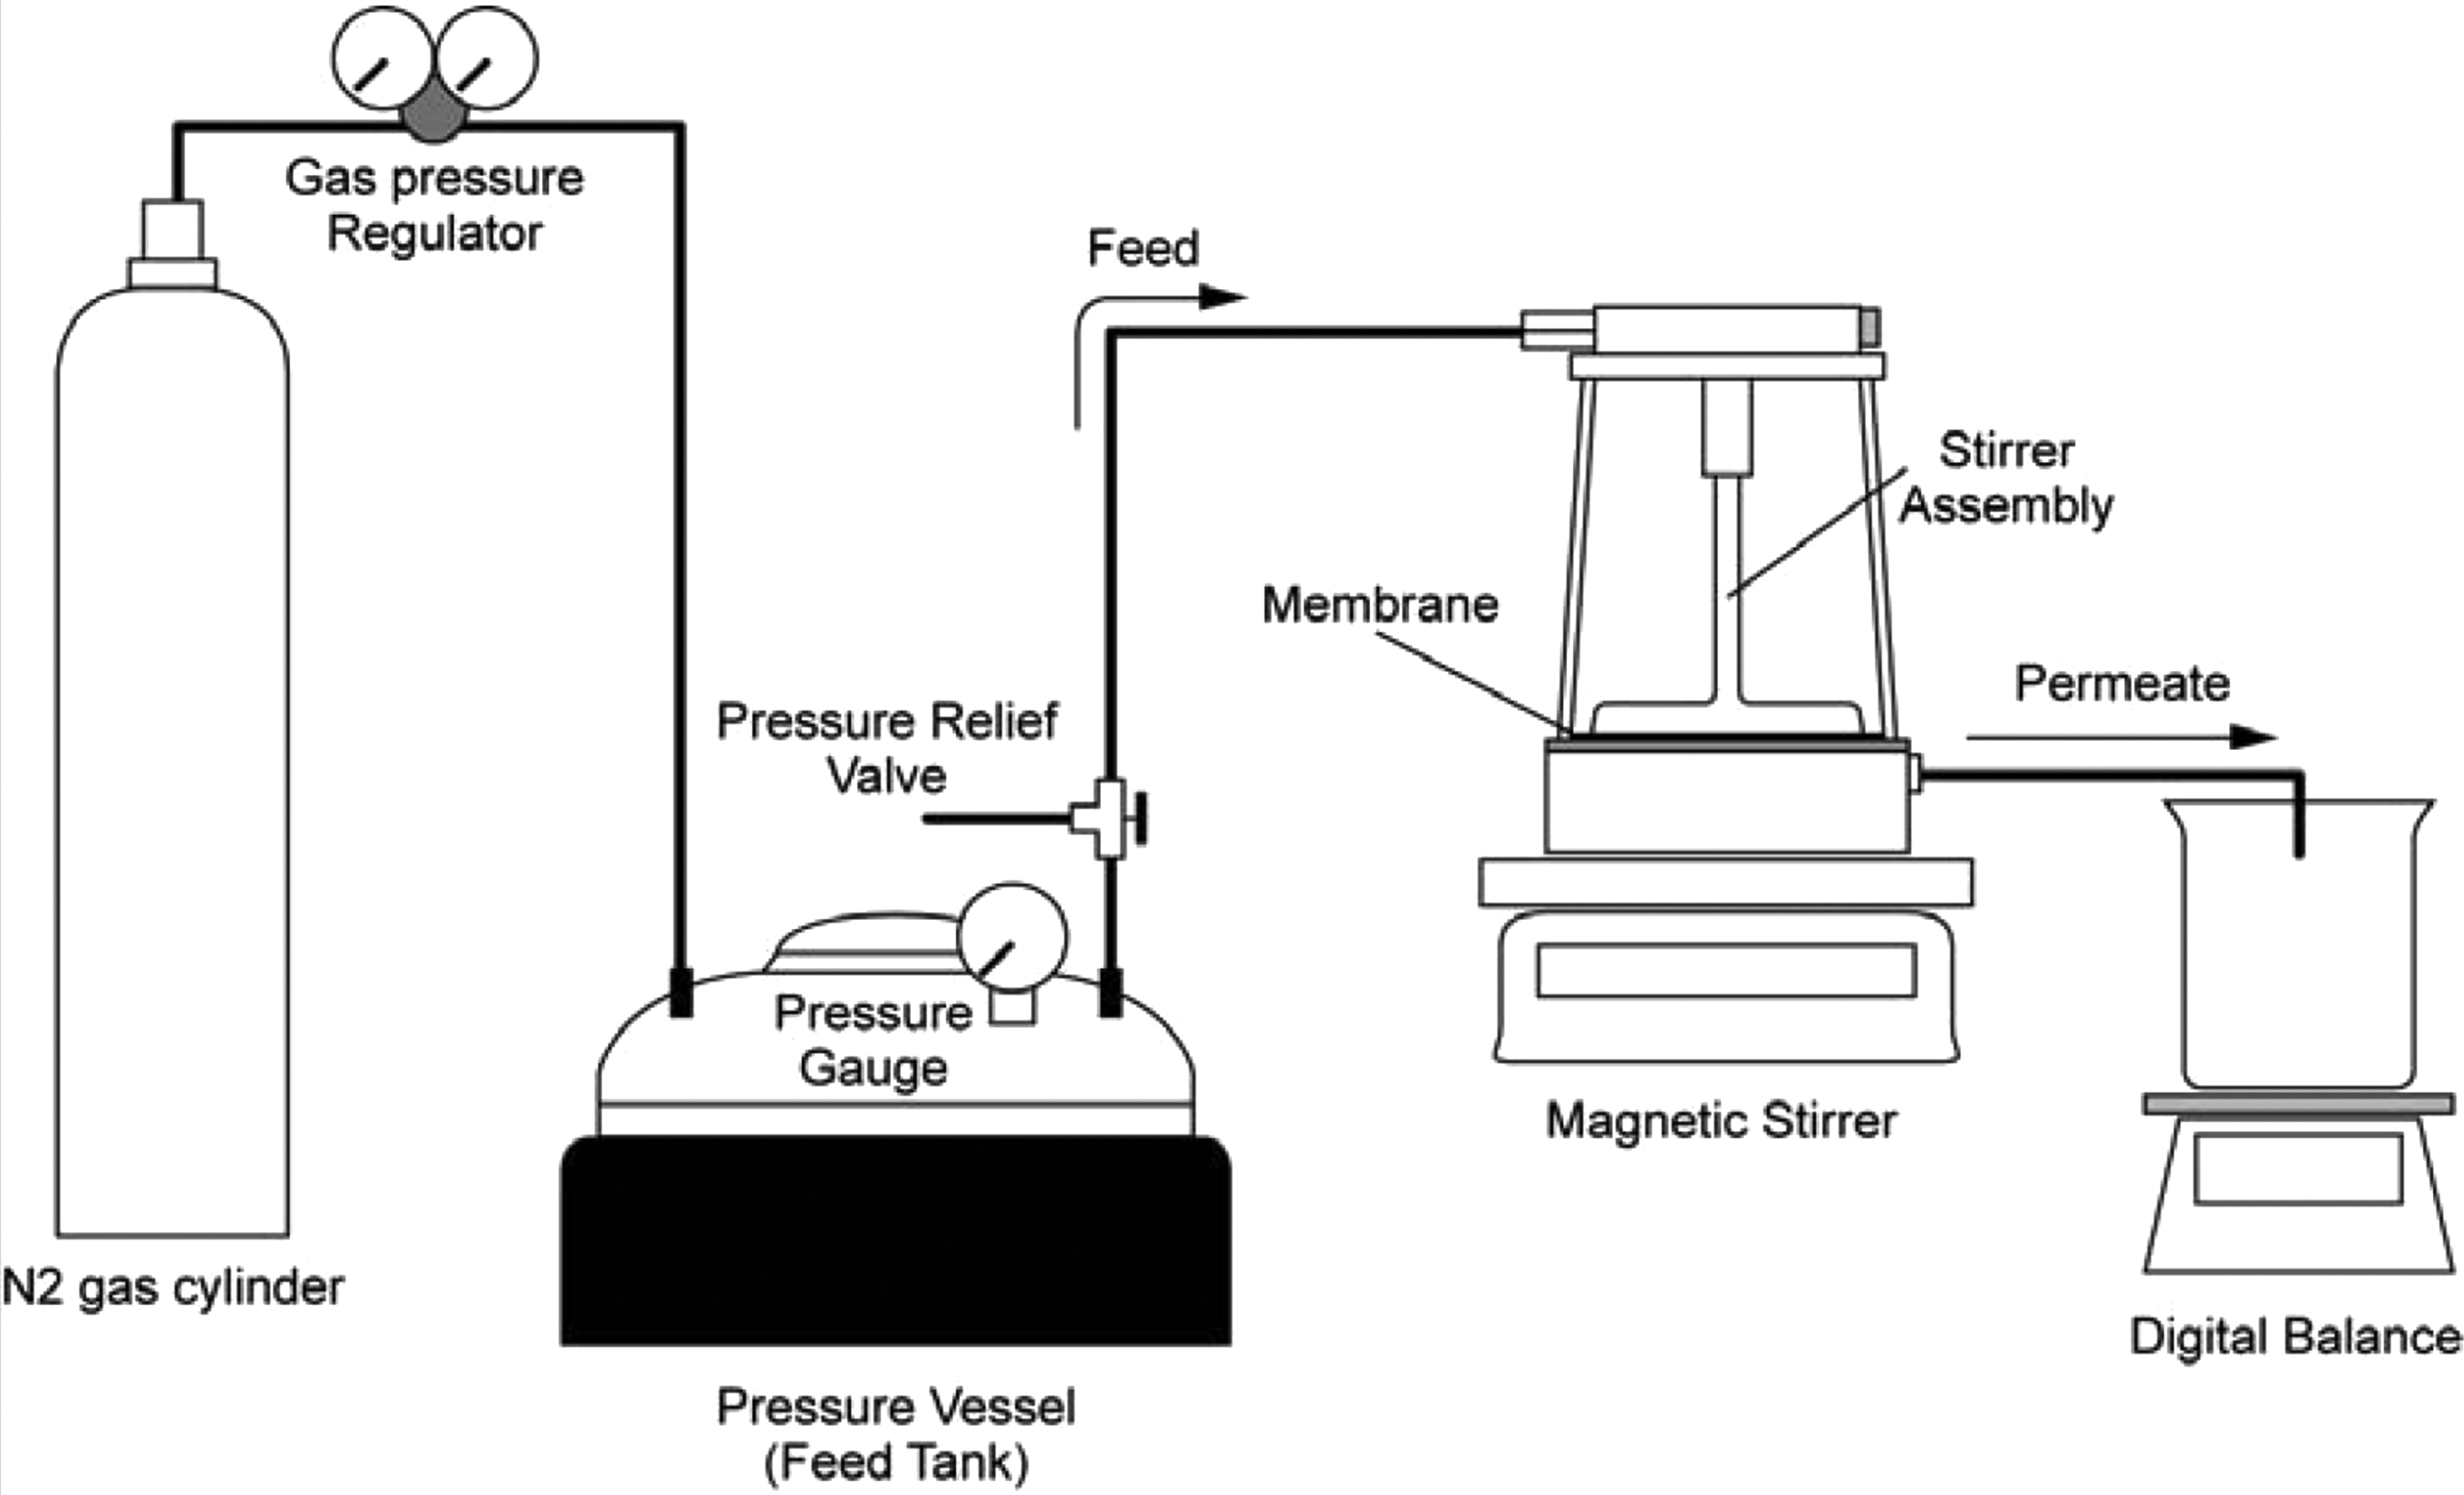
Schematic diagram of experimental set-up.
The arsenic rejection experiments were performed under various initial arsenic concentrations, initial feed pH, ionic strength, applied pressure and stirring speed, and co-occurring ions. All experiments were performed at room temperature. At the beginning of the experiment, to minimize the influence of membrane compaction, membranes were precompacted at 482.6 kPa (70 psi) by filtering Q-H2O through them for 12 to 24 h until a steady state flux was observed. A 200 mL of arsenic feed solution was then introduced into the membrane cell replacing the original Q-H2O in the cell. For each experimental run, 120 mL of the feed solution (60% recovery) was filtered with six permeate samples, 20 mL each, being taken for arsenic analysis. To ensure the reproducibility, each membrane filtration test was conducted three times and the average data were presented in results. In all experiments, the apparent rejection was calculated as:
where Cp is the permeate concentration and Cb the concentration in the bulk solution. The stability of the membrane permeability during the experiments was checked by comparing the pure water flux before and after each experimental run. Only those membranes for which permeability changes were low (less than 5%) were used.
Analytical methods
Determination of glucose and maltose
Concentrations of glucose and maltose in the permeate and feed were determined using a colorimetric method with a detection limit of 0.1 mg/L (Dubois et al., 1956). Phenol, 80% by weight, was prepared by adding 20 grams of distilled water to 80 grams of redistilled reagent grade phenol to form a water-white liquid. Two milliliter of glucose solution/maltose was mixed with 0.05 mL of the 80% w/w phenol solution, and then 5 mL of concentrated sulfuric acid was added rapidly to form an orange-yellow mixture for analysis.
Arsenic analysis
Total arsenic was analyzed by a PSA millennium analytical system (P.S. Analytical Ltd.) based on hydride generation atomic fluorescence spectroscopy (Le and Ma, 1998; Gu et al., 2005). A calibration curve, with a concentration series of 0, 1, 2, 5, 10, 20, and 50 μg/L, was prepared using arsenic reference solution (1,000 ppm±1%, Fisher certified) and had a correlation coefficient (R2) always higher than 99.9%. The method had a detection limit of ∼50 ng/L.
Results and Discussion
Membrane properties
Membrane volume charge
The membrane volume charge density,

Membrane volume charges of NF270 and TFC-SR-2 measured in background solutions of 0.01 and 0.1 M NaCl.
Membrane permeability and salt rejection
The pure water flux is a linear function of the applied pressure, and the measured membrane permeability of TFC-SR-2 is a little higher than that of NF270 (Table 1). The result is consistent with our observation on the hydrophilicity of the membranes. The NF270 membrane has a contact angle of 30.7°, and the TFC-SR-2 membrane is more hydrophilic with a contact angle at 20°. The high water fluxes of both membranes at the relatively low pressures confirmed the NF being a low energy consumption process.
Salt rejections for NF270 and TFC-SR-2 are consistent with the reported results of other researchers (Schaefer et al., 2003; Tang et al., 2007). With an initial NaCl at 10 mM and applied pressure of 482.6 kPa (70 psi), the NaCl rejection by TFC-SR-2 was approximately in the range of 15–20%, which was lower than that of NF270 (50–60%). When the initial NaCl was 100 mM, the rejection by NF270 and TFC-SR-2 decreased to 22% and 6%, respectively under the same transmembrane pressure (70 psi). The different performances between the two membranes could be related to the difference of the membrane pore size and the charge density.
Pore size determination
Molecular weight, diffusivity, and radius of glucose and maltose were obtained from literature (Table 2) (Bowen and Mukhtar, 1996). The rejection and permeate data of glucose (Fig. 3) were used to estimate the reflection coefficient, σ, and membrane permeability, P, in the Spiegler–Kedem–SHP model by the best fit method. The criterion for the best fit was a minimization of the least-squares deviation. The pore size, rp, and the ratio of the thickness to porosity, Δx/Ak, of NF270 and TFC-SR-2 were then calculated. The average pore size of NF270 and TFC-SR-2 were determined to be 0.49 and 0.46 nm, Δx/Ak are 54.8 and 9.49 μm, respectively.

Rejection of glucose as a function of permeate flux for NF270 and TFC-SR-2, and lines are results of a best fit using Spiegler–Kedem–SHP model.
Arsenic rejection by the membranes
Effect of initial arsenic concentration
Arsenic rejection and its concentration in the permeate as a function of initial arsenic concentration are presented in Fig. 4. The As(V) rejection increased slightly with increasing initial As(V) concentration. The rejection of As(V) by NF270 increased from 90% to 93% with the initial concentration increasing from 50 to 1,040 ppb, and the rejection by TFC-SR-2 increased from 88% to 91% with the initial As(V) ranging from 48.2 to 1,002 ppb. This phenomenon can be explained assuming that the transport of As(V) through the membranes does not increase proportionally with increasing initial As(V) concentration, consequently, the rejection of As(V) species increases (Fang and Deng, 2012). For both membranes, the As(V) detected in the permeate was lower than the EPA recommended MCL when the feed As(V) concentration was less than about 100 ppb.
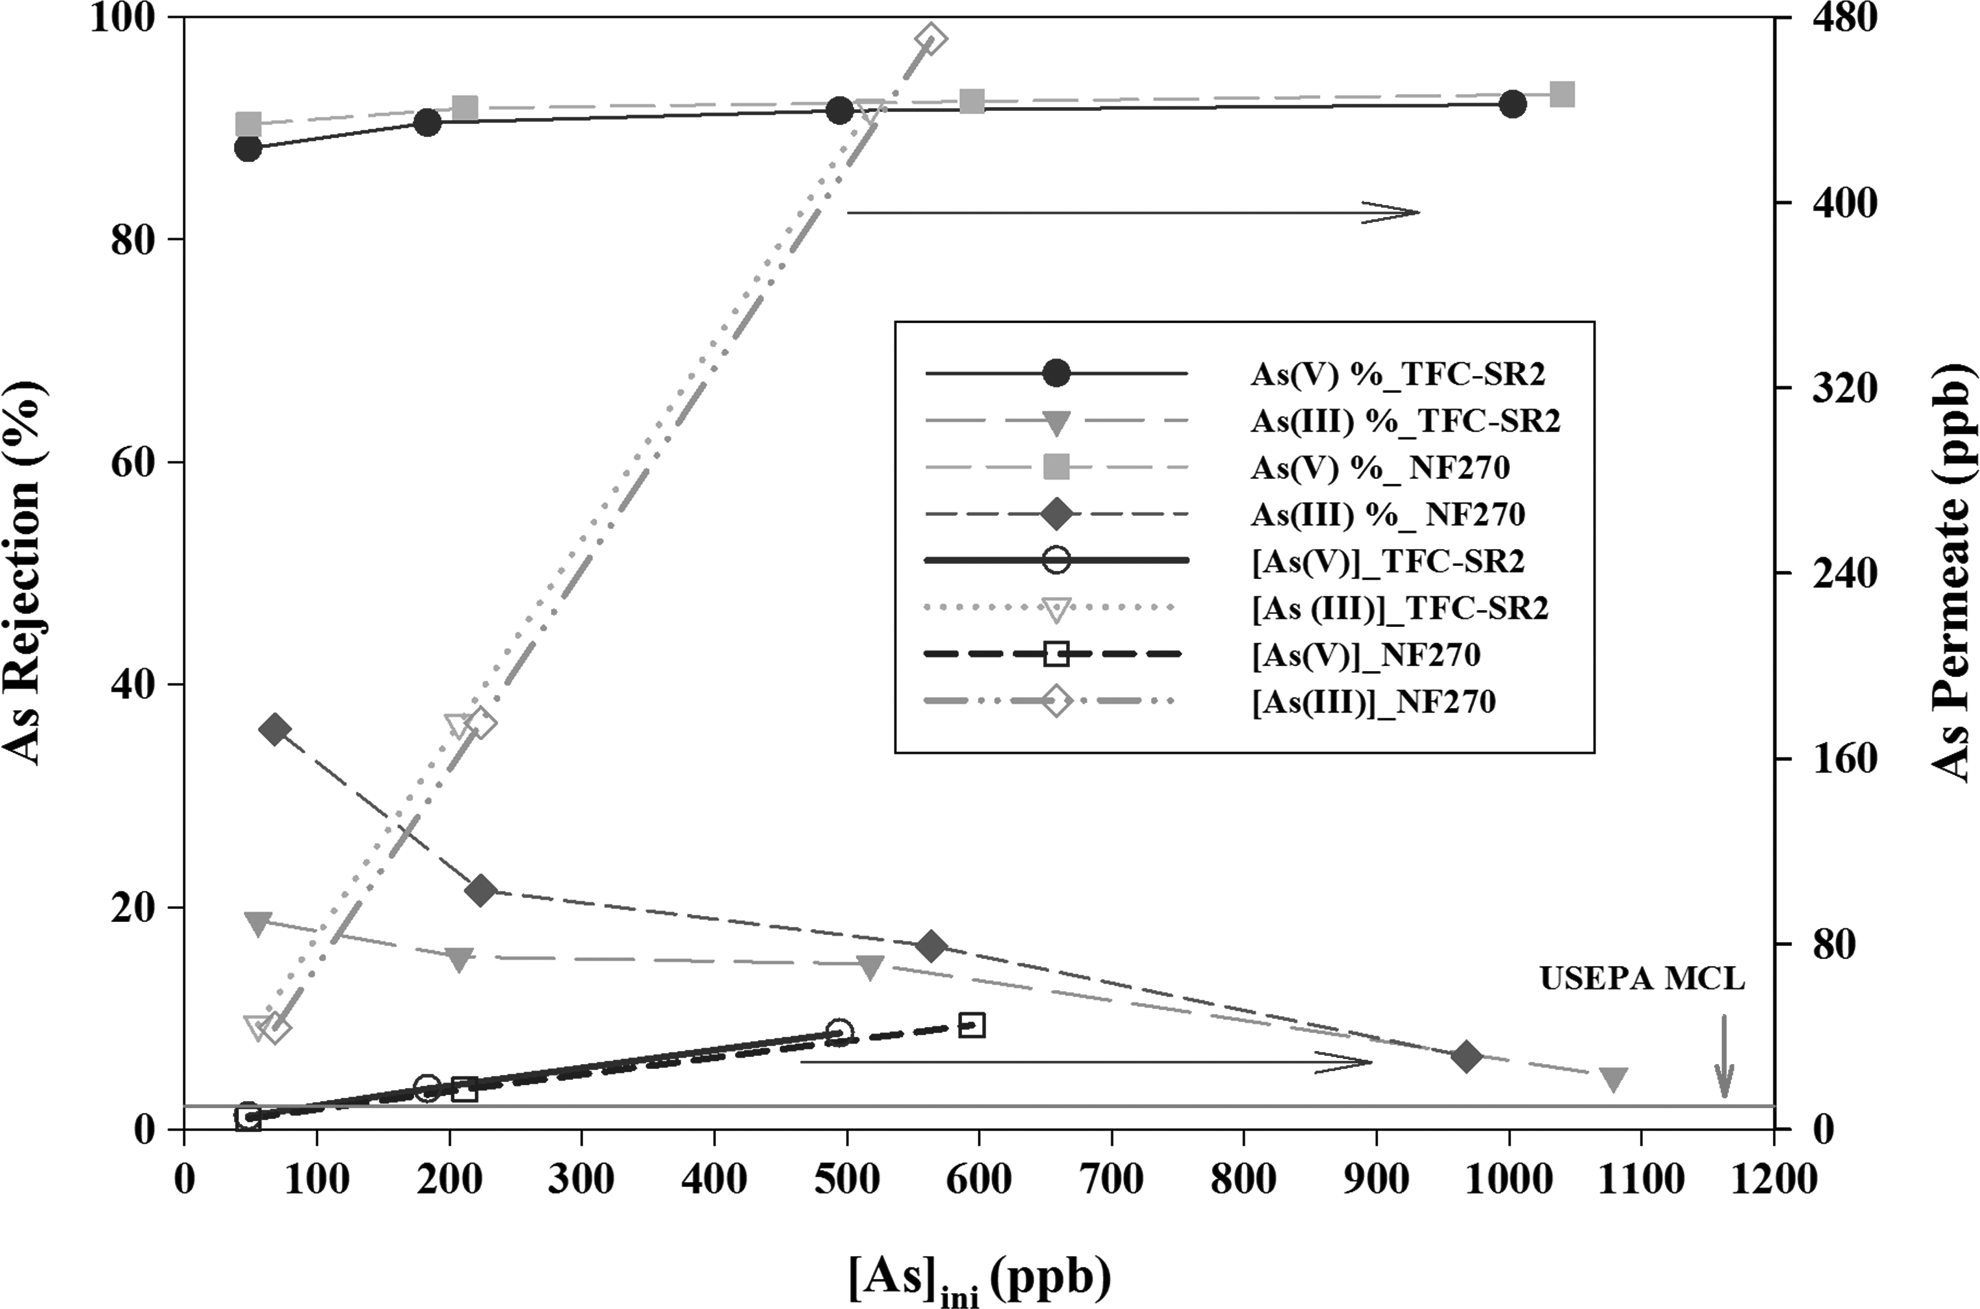
As(V) and As(III) rejection by TFC-SR-2 and NF270 at different initial concentrations. NaCl 0.1 M, pH 8.0, applied pressure at 482.6 kPa (70 psi).
The rejection of As(III) was much lower (less than 40%). When initial As(III) was increased from 68 to 968 ppb, the rejection of As(III) by NF270 declined significantly from 36% to 6.5%. Similarly, TFC-SR-2 showed a substantial decrease in the As(III) rejection with increasing initial As(III) concentrations from 55 to 1,078 ppb. The decrease of the As(III) rejection could be possibly attributed to the high affinity interaction between the arsenite species and the membranes, and the increasing diffusion and convection of uncharged arsenite species through the membranes.
Effect of initial feed Ph
The rejections of As(V) and As(III) under various pHs and the corresponding aqueous speciation of arsenic are presented in Fig. 5a and b. It is notable that with a pH increase from 4–10, the As(V) rejection was increased from 54% to 93% by NF270 and 51% to 91% by TFC-SR-2. This substantial increase in As(V) rejection by both membranes with increasing pH is in agreement with the observations reported by Nguyen et al. (2009) and Figoli et al. (2010), in which they found that the N30F and NE 90 membranes with a relatively large pore size rejected arsenic primarily by charge exclusion. When pH increases, more monovalent arsenate anions are transformed to divalent arsenate anions. Because both membranes in our study are more negatively charged with increasing pH, a stronger electrostatic repulsion exists between the membrane and the arsenate ions at a higher pH, leading to the increase of As(V) rejection. In contrast, Hering and Elimelech (1997) reported that the rejection of As(V) by the NF70 membrane was independent of solution pH. The behavior could be attributed to a significantly smaller pore size of the NF70 membrane, where the size exclusion dominates the arsenic rejection. Therefore, despite changes of the arsenate species and/or the membrane charges, the arsenic rejection remains unchanged in their study.
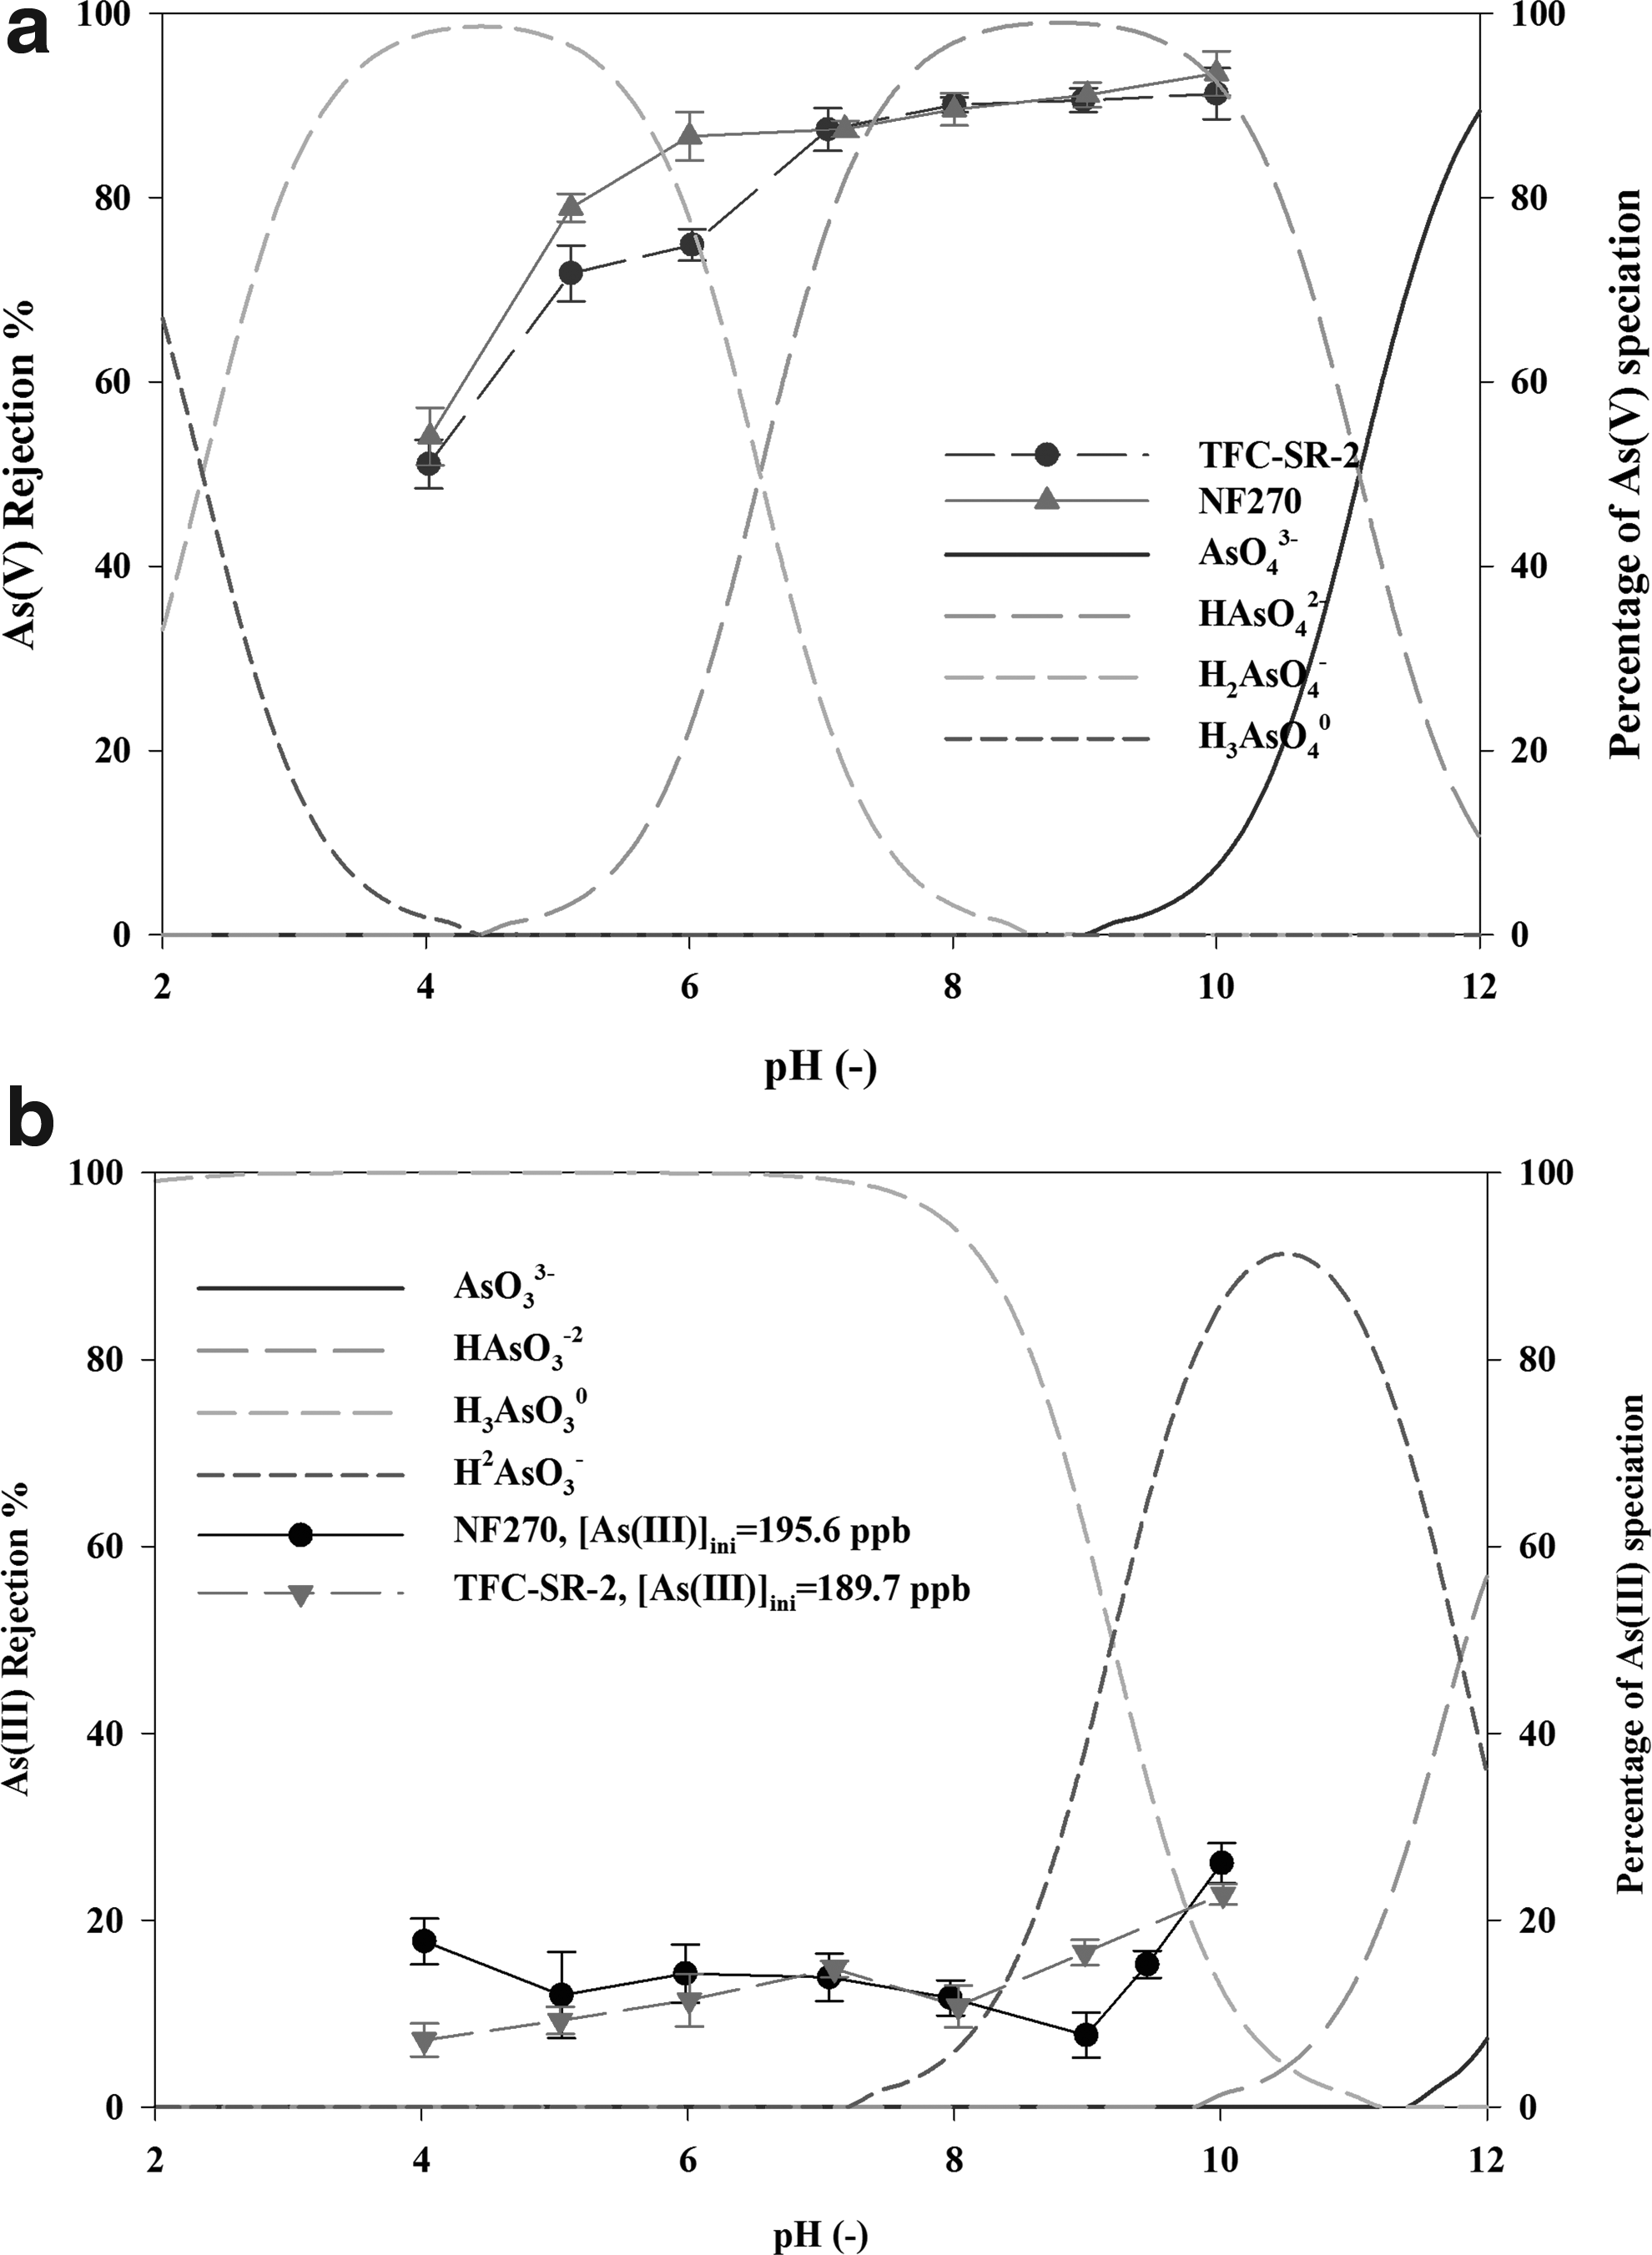
The As(III) rejection by NF270 was very low in the entire range of pH investigated and there was no apparent effect of initial feed pH on the rejection (varied between 7% to 14%) in the pH range of 4–9. A similarly low rejection was observed with TFC-SR-2 (Fig. 5b). The extremely low rejection of As(III) by the membranes investigated is likely attributed to the neutral form of arsenite species at pH<9.2 and the smaller Stokes radius of neutral arsenite (0.236 nm) than the pore size of the membranes (0.49 nm for NF270 and 0.46 nm for TFC-SR-2). At pH 10, As(III) rejections by NF270 and TFC-SR-2 respectively increased to 26% and 22%, which could be explained by the fact that the pKa,1 of arsenite is 9.2, so when the solution pH is higher than this value, the neutral arsenite (H3AsO3) transforms to monovalent arsenite (H2AsO3−), for which charge exclusion begins to play a role in rejection.
Effect of ionic strength
The As(V) rejection by NF270 varied from 98% to 79% as the background electrolyte NaCl concentration increased from 0 to 1.0 M. For TFC-SR-2 the As(V) rejection decreased from 92% to 73% with the NaCl concentration increasing from 0 to 1.0 M (Fig. 6). This behavior is due to the shielding phenomenon (Wang et al., 1997; Paugam et al., 2004), that is to say, when the ionic strength increased, the sodium cations in the solution form a screening zone and tend to partially neutralize the negative charges of the membrane. Consequently, the electrostatic repulsion between As(V) anions and the membrane becomes weaker, thus the rejection of the As(V) anions decreases. Our observations differ from the previously reported results by Sato et al. (2002) where the impact of the ionic strength is less significant. This could be due to their use of much tighter NF membranes, for which the electrostatic interaction plays a smaller role in As rejection. For the neutral As(III) species, the rejections by both NF270 and TFC-SR-2 had a very slight decreasing trend with increasing ionic strength. This could be explained by the enlargement of the membrane pore size in the presence of a high electrolyte concentration (Bargeman et al., 2005).
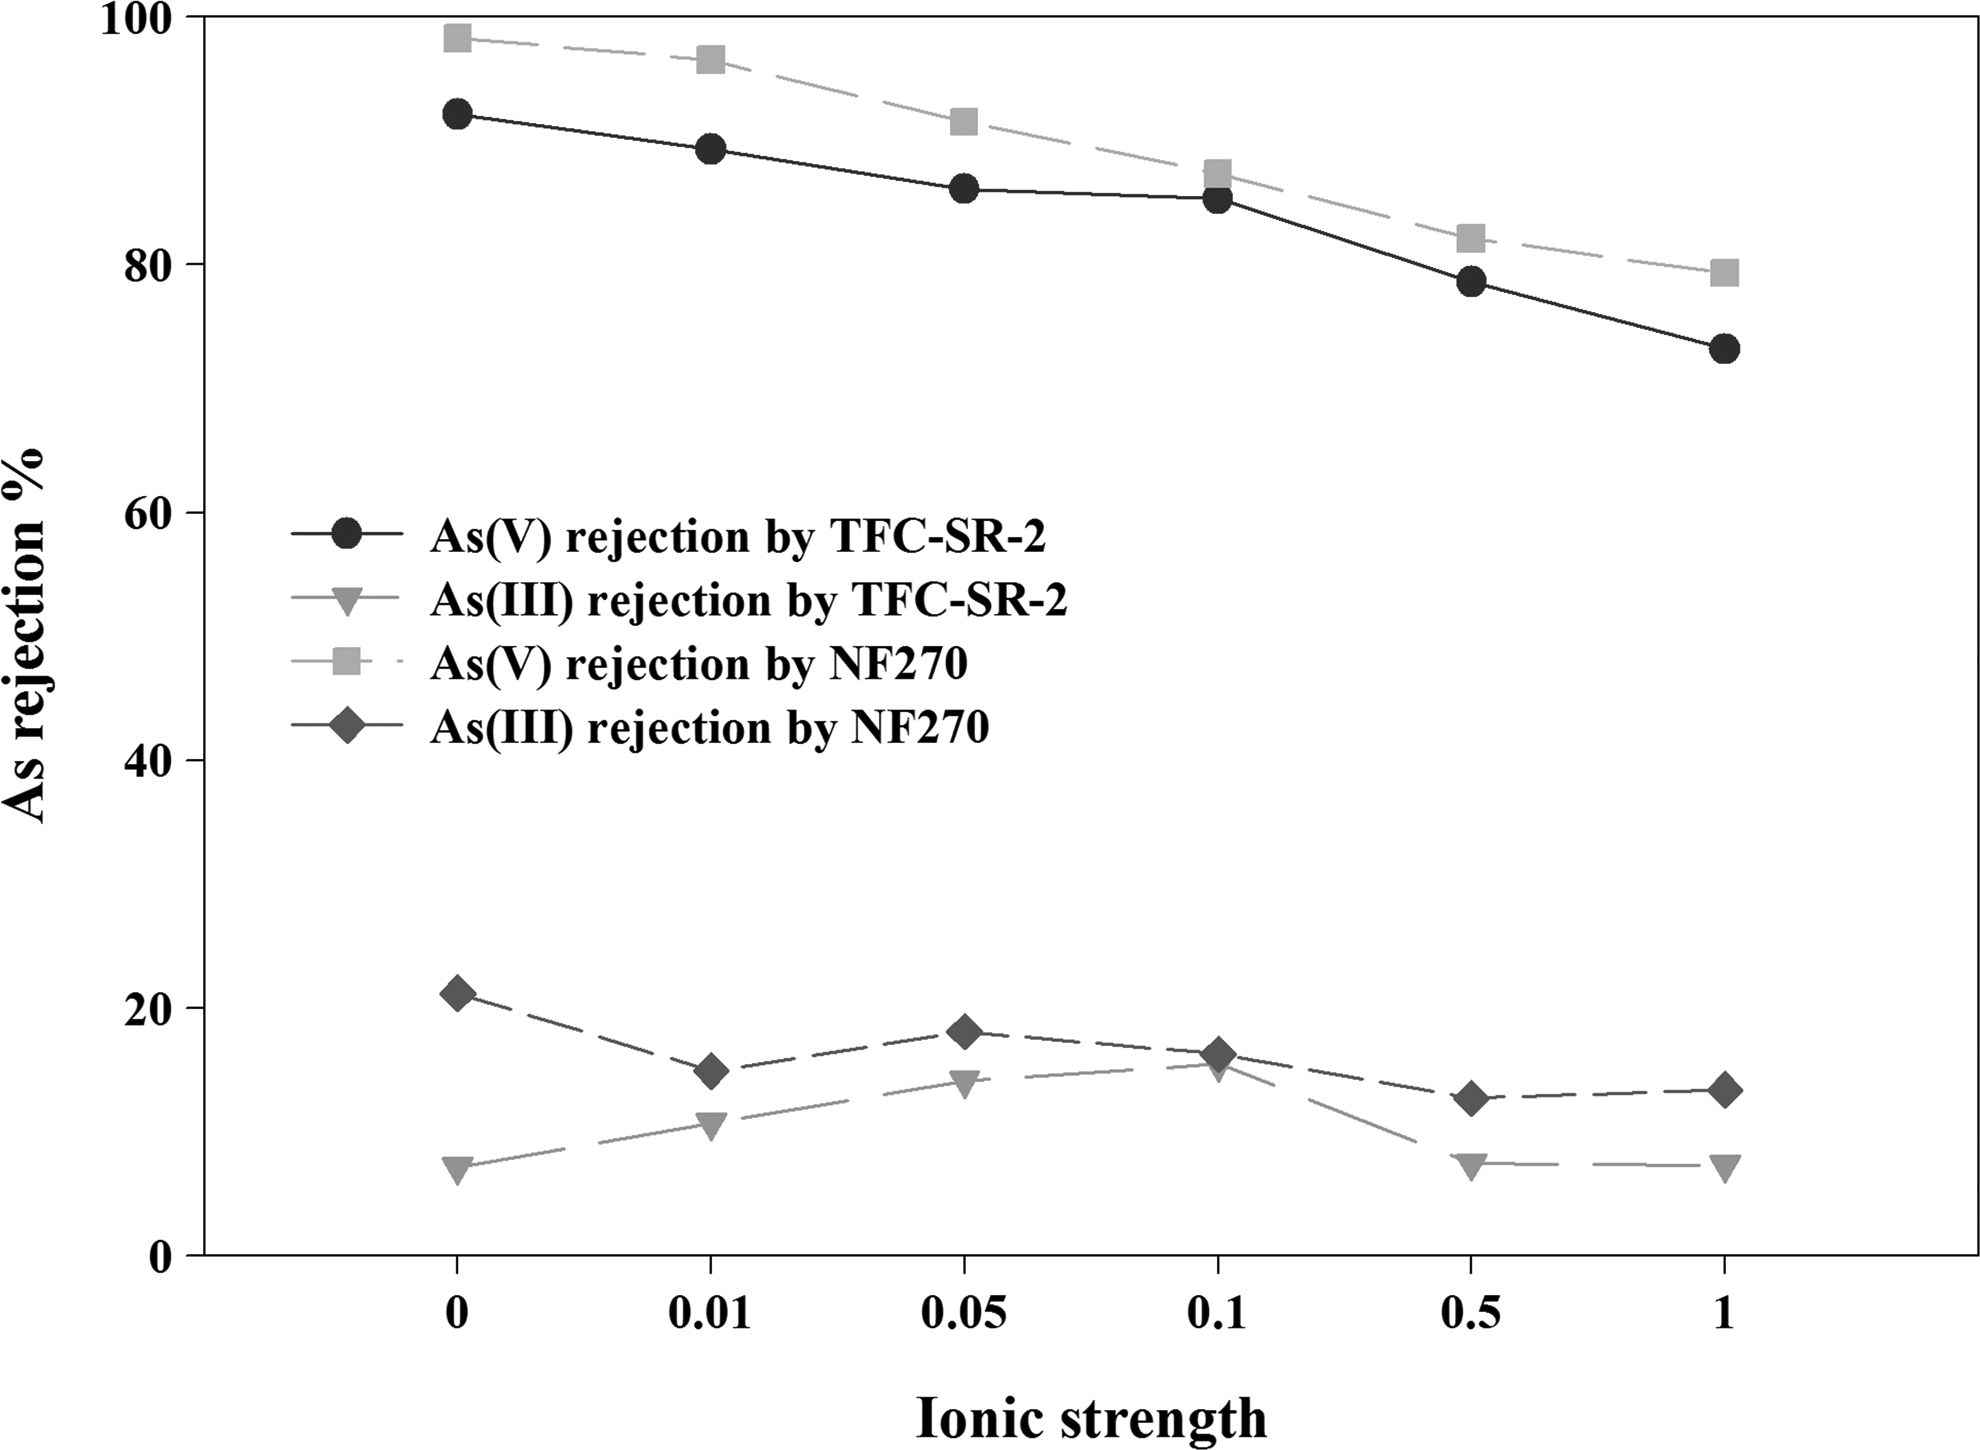
Effect of ionic strength on arsenic rejection at pH 8.0 and applied pressure 482.6 kPa (70 psi). For NF270: [As(V)]ini 215.7 ppb, [As(III)]ini 188.8 ppb. For TFC-SR-2: [As(V)]ini 183 ppb, [As(III)]ini 207.3 ppb.
Effect of applied pressure and stirring speed
The As(V) rejection and normalized permeate flux at different applied pressures were plotted in Fig. 7. Generally, two competing phenomena dictate the separation behavior of the ions under increasing permeate flux conditions. As the applied pressure increases, water flux increases and the ion flux is electrically and sterically hindered, thus resulting in lower ion concentrations in the permeate (the so-called dilute effect). On the other hand, more ions are transported from the bulk solution toward the membrane surface as permeate flux increases, which enhances the CP and subsequently reduces the ion rejection (Seidel et al., 2001; Ong et al., 2002). The observed rejection results from the competition of these two opposing effects. Obviously the dilution effect plays a dominant role in our cases and As(V) rejection increased with the increase of applied pressure.
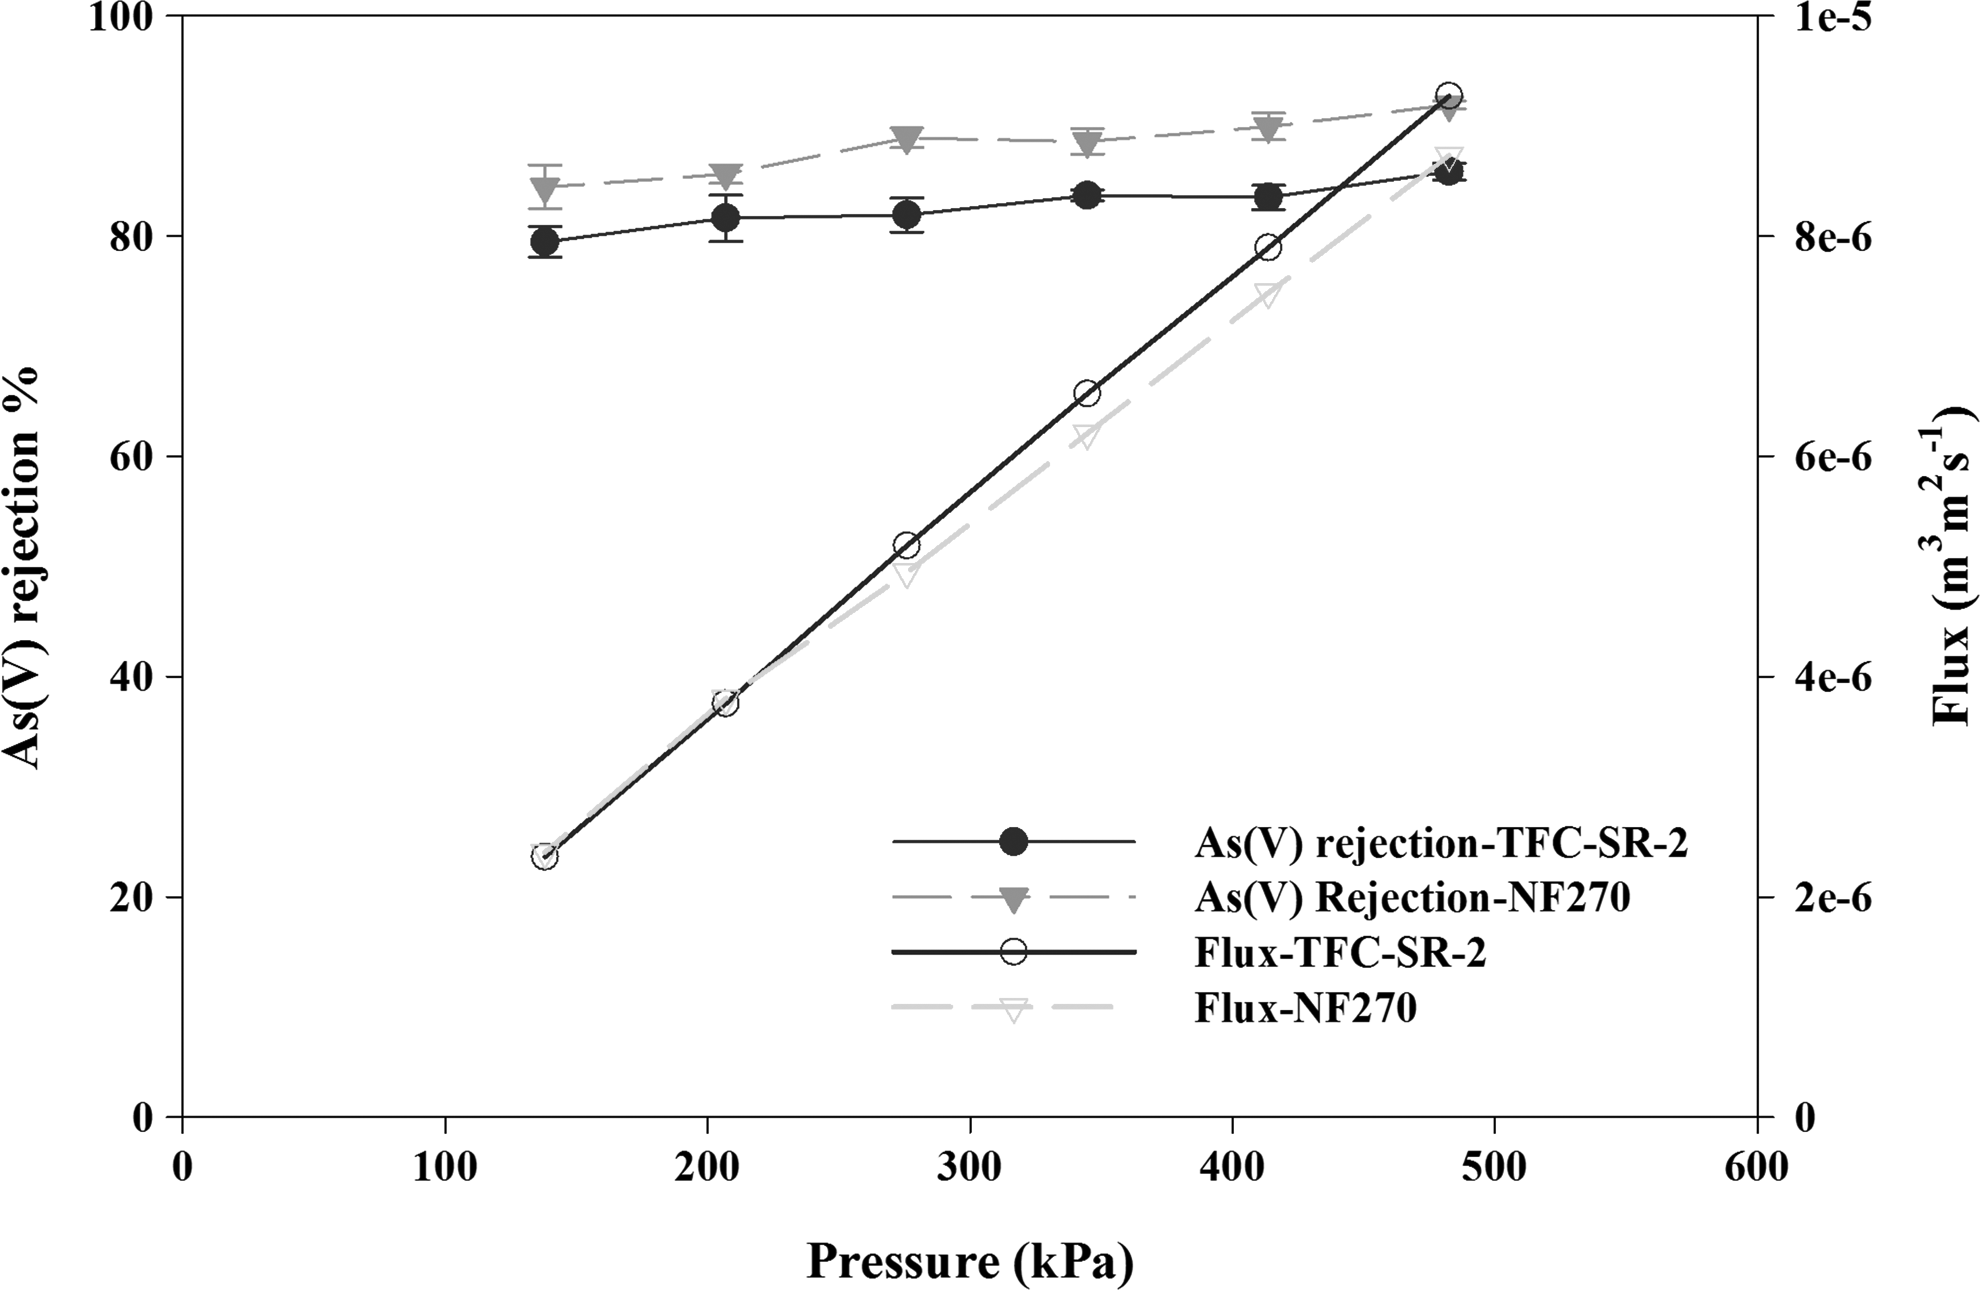
Effect of applied pressure on As(V) rejection by TFC-SR-2 and NF270 and the flux profiles of the membranes. [As(V)]ini 212.2 ppb; Background NaCl 0.1 M; pH 8.02; Stirring speed 300 rpm.
Figure 8 depicts the effect of stirring speed on the As(V) rejection by NF270 and TFC-SR-2 and the normalized permeate flux. The increase of stirring speed correspondingly led to increase of the As(V) rejection. Without stirring, the removal efficiency of arsenate was as low as 60%, although it could reach up to 92% as the stirring speed was increased to 600 rpm. The higher the stirring speed, the more the complete mixing occurs in the solution, therefore, the CP at the membrane surface would be mitigated, leading to less transport of As(V) species across the membrane.

Effect of stirring speed on As(V) rejection by TFC-SR-2 and NF270. [As(V)]ini=200 ppb, background NaCl 0.1 M, pH 8.02, applied pressure 482.6 kPa (70 psi). Normalized flux denotes the ratio of As(V) permeate flux and pure water flux at the same pressure. Pure water flux of TRC-SR-2: 1.266×10⁻⁵ (m3/[m2·s]); NF270: 1.32×10⁻⁵ (m3/[m2·s]) (both at 482.6 kPa [70 psi]).
Effect of co-occurring ions
Calcium chloride, monobasic sodium phosphate, or sodium sulfate was spiked into the arsenic solution to evaluate the effect of co-occurring ions on the arsenic rejection. Figure 9a shows that the As(V) rejection by NF270 reduced slightly when the concentration of co-occurring ions (calcium, sulfate, or phosphate) was increased from 0.0001 to 0.01 M. For the divalent anions as sulfate and phosphate, the reduction of As(V) rejection is possibly due to the increase in the ionic strength, which again could be interpreted by the shielding phenomenon. The increase in concentration of sodium sulfate or sodium phosphate forms a zone of positive sodium ions acting as a screen, thereby neutralizing the negative charge of the membrane. The force of repulsion is reduced between the negatively charged membrane and arsenate anions. At higher ion concentrations, the screen effect is more significant than the repulsion of the anions, and therefore, produces a lower rejection (Diawara et al., 2003). Unlike sodium ions forming a screen zone, Ca2+ ions could bond with ionizable functional groups of some negatively charged membranes to form either inner-sphere or outer-sphere surface complexes. In both cases, the adsorption of Ca2+ to the membrane surface reduces the negative charge of the membranes (Childress and Elimelech, 1996). As the concentration of Ca2+ ions increases, the membranes become even less negatively charged. In this study, the existence of calcium, however, only led to a slight decrease of the arsenate rejection.
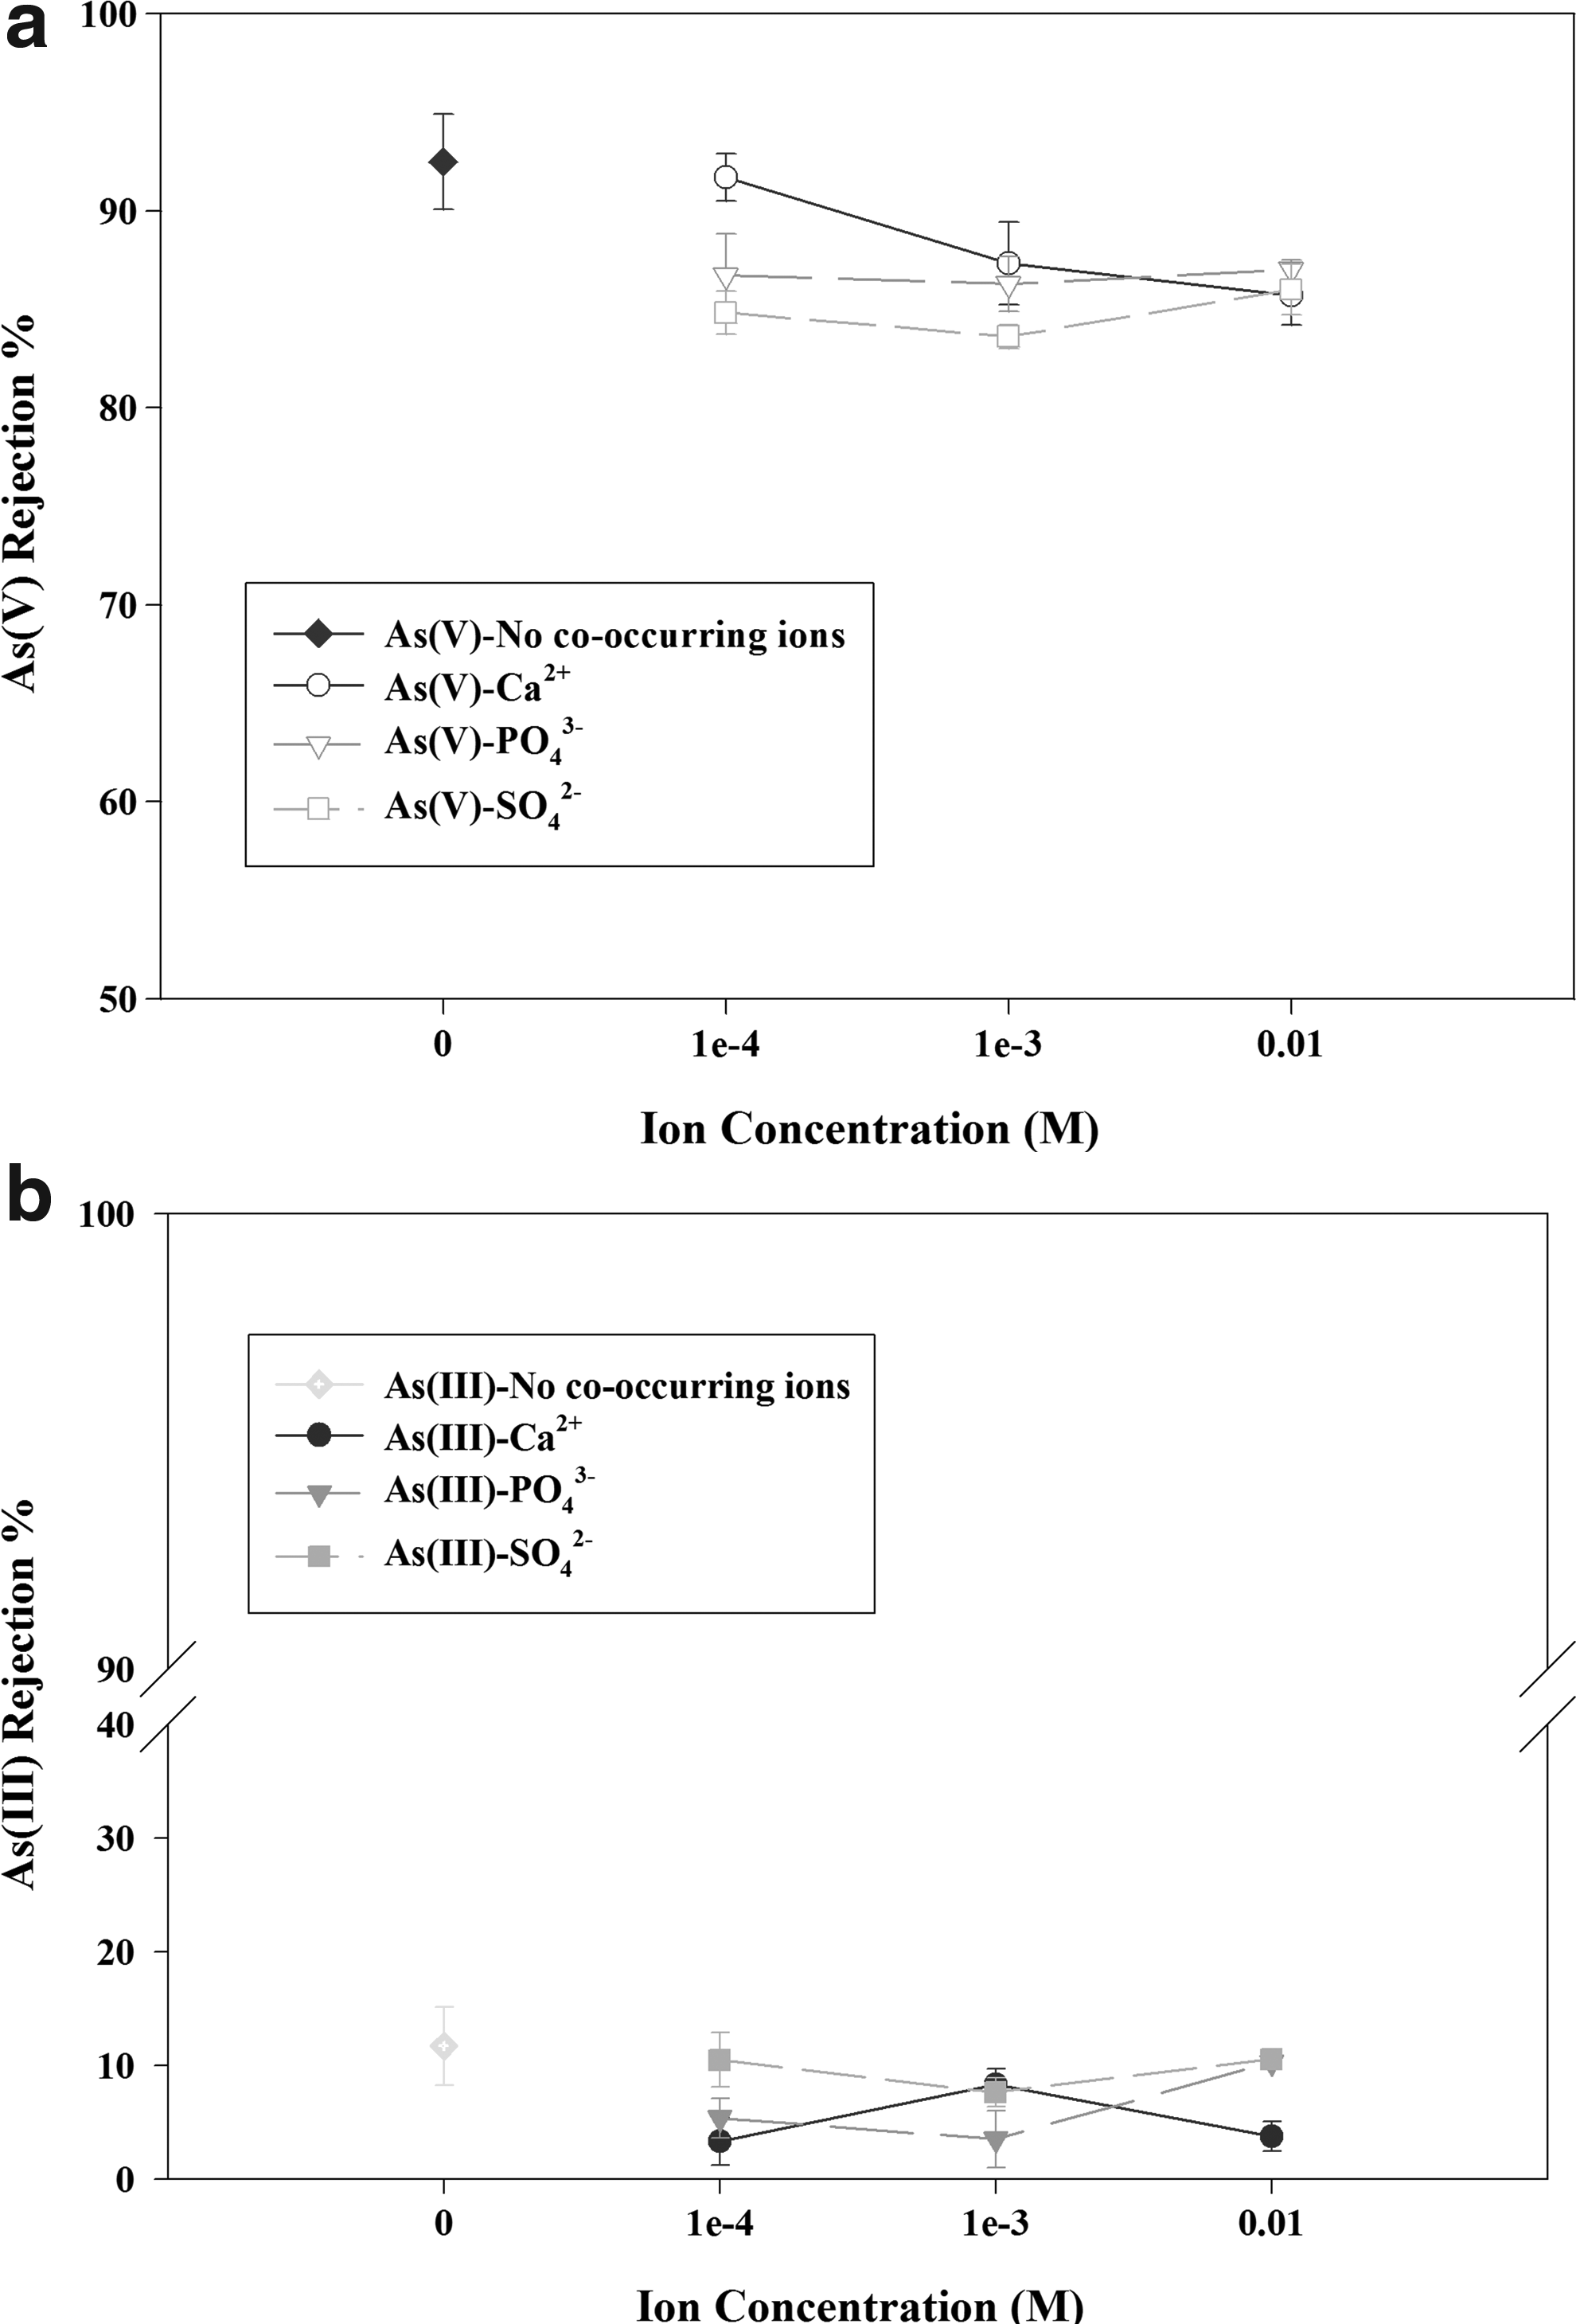
Although the As(III) rejection by NF270 was quite low, a minor decrease in the As(III) rejection was still observed when co-occurring ions were added (Fig. 9b). The rejection of the neutral As(III) was attributed to size exclusion, not charge repulsion. The presence of high salt concentrations in the membrane pores generally results in enlargement of the pore radius and consequently could reduce rejection of neutral components in the solution (Bargeman et al., 2005). The decrease of the As(III) rejection could also be associated with the non-uniform distribution of the membrane pore size. When salts were added to the feed, the membrane flux decreased. This decrease in flux, as a result of salt addition, is relatively higher for small pore radii; consequently, large pores contribute more to permeate flux. Since large pores have lower rejections of neutral components than smaller pores, reduced rejection for neutral components is possible (Bowen and Welfoot, 2002a; Bargeman et al., 2005).
Model analysis of arsenic rejection
Modeling of As(III) rejection
Arsenite existed in its neutral solute form at a pH<8.0. The intrinsic rejection of arsenite by NF270 was slightly increased with the increase of the permeate flux from 2% at flux 5.2×10⁻⁶ (m3/[m2·s]) to 19.9% at 1.95×10⁻⁵ (m3/[m2·s]). Similarly, the As(III) rejection by TFC-SR-2 increased from 5.2% at 5.35×10⁻⁶ (m3/[m2·s]) to 17.6% at 2.104×10⁻⁵ (m3/[m2·s]). For neutral solute, a modified Nernst–Planck model or the Spiegler–Kedem–SHP model can be used to predict the solute transport through the membranes. In this study, the Spiegler–Kedem–SHP model was used to estimate the As(III) rejection as a function of permeate flux at pH 8.0. As seen from Fig. 10, the calculated rejection was significantly higher than the experimental results and showed poor model fitting for both membranes. The plausible explanation for this discrepancy is that the Spiegler–Kedem–SHP model considered only steric hindrance in estimating the partition of neutral arsenite (at pH 8.0) into the charged NF membrane. Transport of neutral molecules through membranes, however, could be significantly affected by the solute–membrane affinity interaction, especially, for the neutral molecules such as arsenite with a high dipole moment and a relatively small size (Van der Bruggen et al., 1999). The possible affinity interaction for adsorption of As(III) onto the membranes could be the formation of hydrogen bonds between OH groups from arsenite and N from polyamide layer of the membranes (Mi et al., 2007). In addition, the hydrated radius of As(III) may change due to the dehydration phenomenon during the As(III) partitioning, that is, the neutral arsenite molecules with less strongly bound shells may actually detach from their hydration layer while passing through the membrane (Richards L.A. 2012). Both cases could facilitate the transport of arsenite through the membranes. Once the arsenite molecules were in non-dead-end pores, they would permeate, thus leading to a lower rejection.
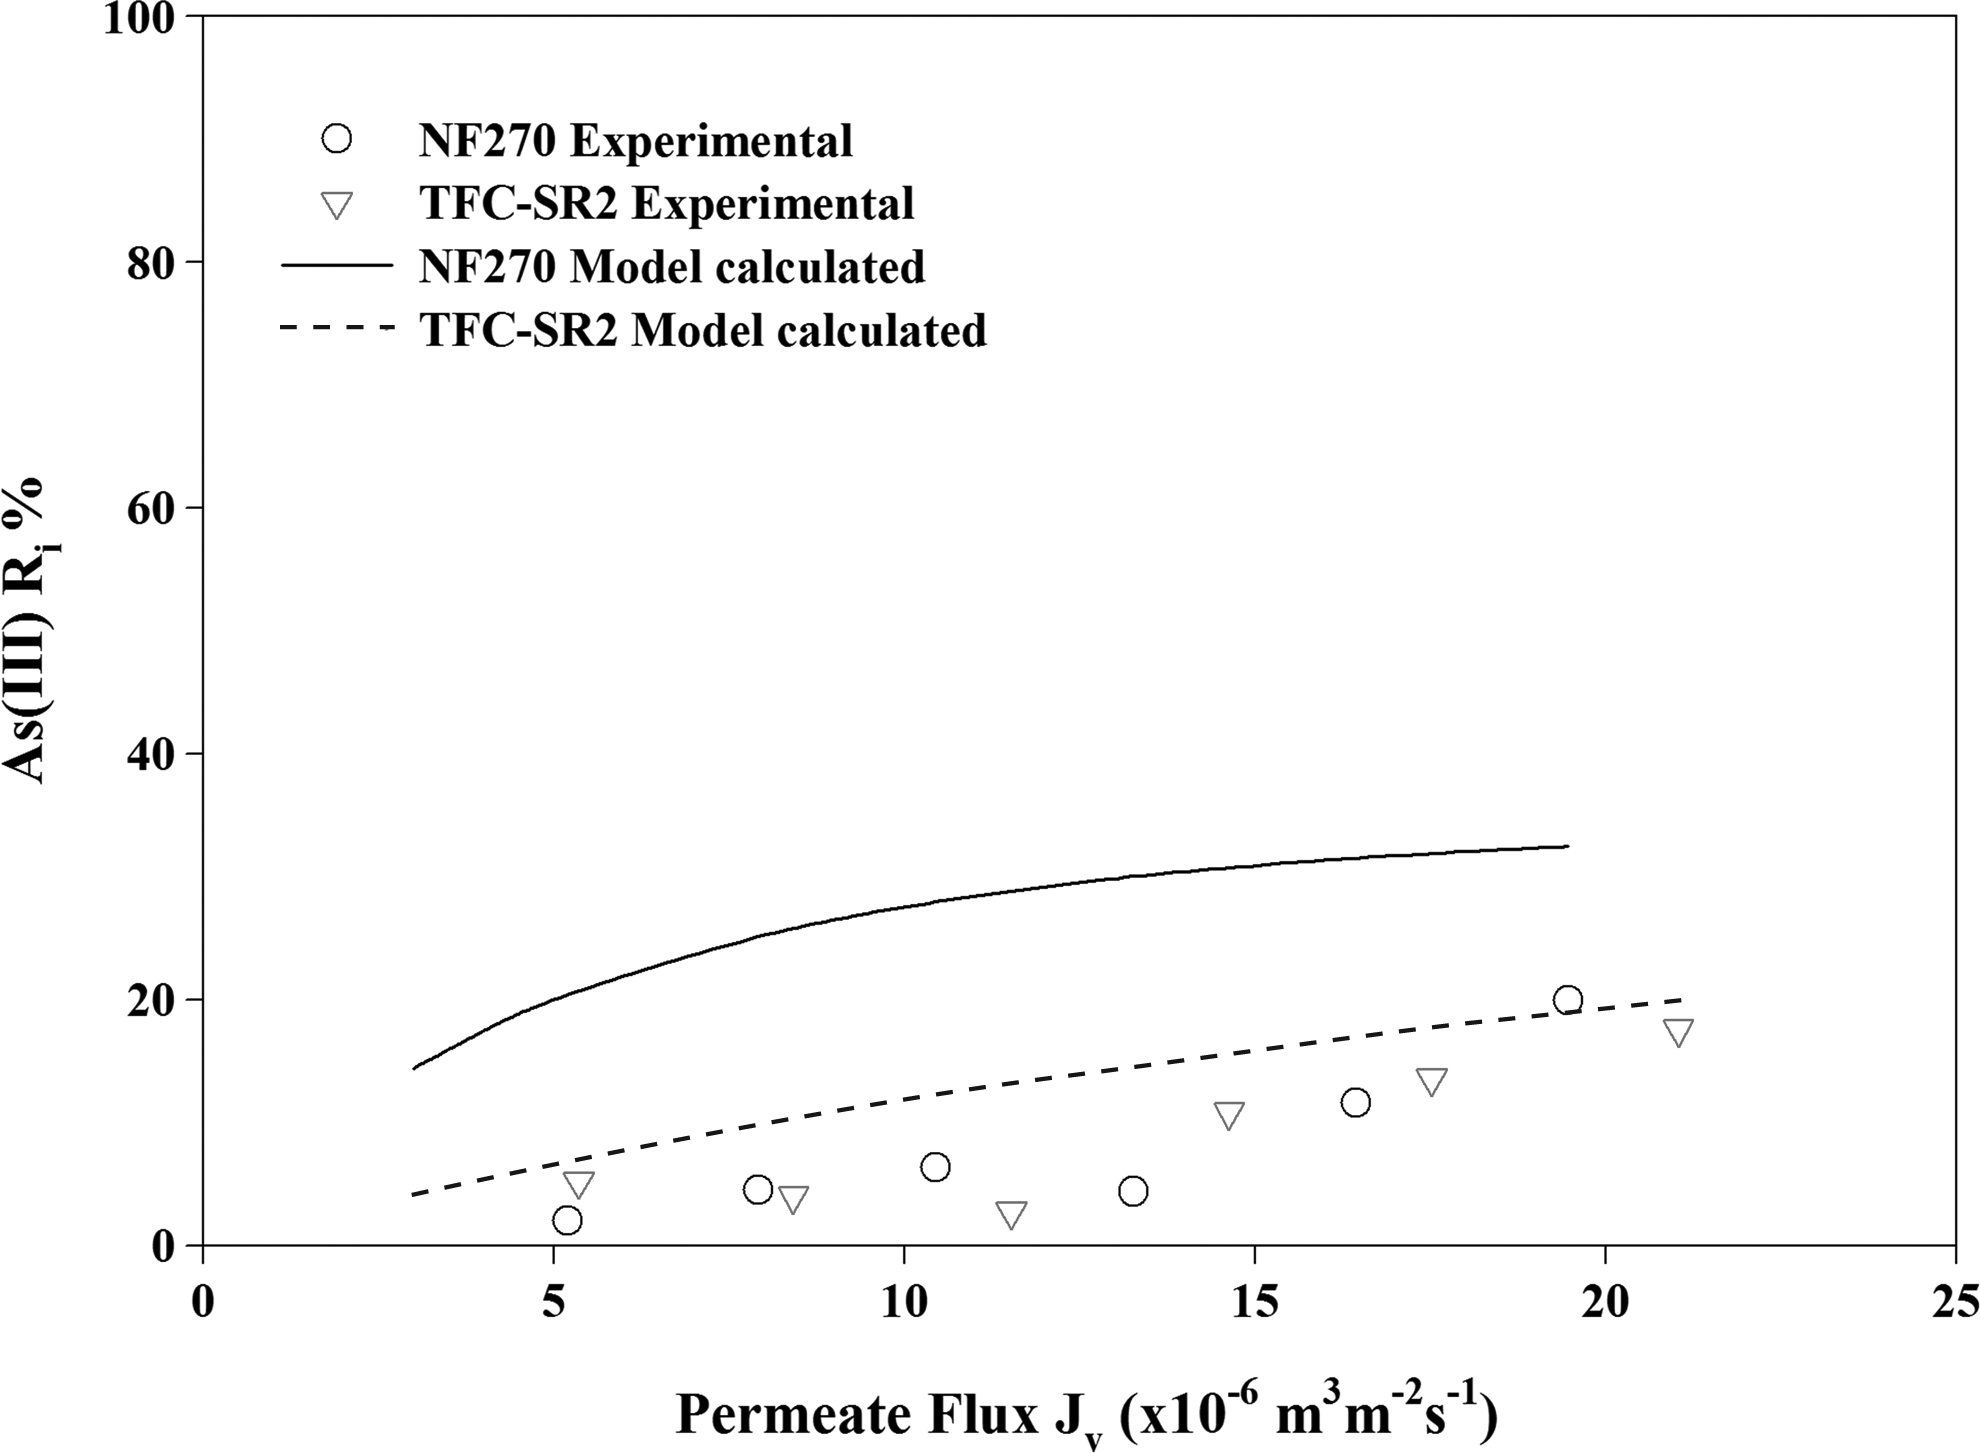
Comparison of experimental results with model calculated rejection of As(III) by NF270 and TFC-SR-2 as a function of permeate flux.
Modeling of As(V) rejection
The As(V) rejection by the membranes was evaluated using DSPM in combination with CP film theory. The flux of ion
Equation (1) could be rearranged in the form of a concentration gradient as Equation (4) in Table 3 together with other supporting Equations (5)–(12). Based on the CP film theory, at a steady state and assuming the transverse solute flux through the CP layer is constant, one can evaluate the solvent flux (Jv) by the one-dimensional mass balance across the CP layer. Therefore, the following equation can be obtained (Zydney, 1997):
where k denotes the mass transfer coefficient, which is related to the Sherwood number (Sh):
Of the equation, a, b, c, and d are constants,
where rstirrer, ω, ν, and Ds are the radius of the stirrer in the membrane cell, the stirring speed, the kinematic viscosity, and the diffusivity, respectively.
The differential Equations (4) and (5) could be solved numerically using a fourth order Runge–Kutta method (SigmaPlot) with the initial value of ci|x=0 (the solute concentration in the membrane at the concentrate side interface) to yield the solute concentration in the membrane at the permeate side interface, ci|x=Δx, for obtaining Ci,p. To simplify the calculation, one could also assume that the concentration gradient through the membrane pore is linear (Bowen and Welfoot, 2002b; Bowen et al., 2002). This assumption avoids the integral necessary in solving Equation (4). The linear form of Equation (4) is:
with
where
The numerical procedures for model calculation have been detailed elsewhere (Lee and Lueptow, 2001). Figure 11 depicts the experimental data of arsenate rejection and the model calculated results as a function of permeate flux. The model calculation is in good agreement with the experimental results, and predicts a very low rejection of arsenate at low permeate flux and an increased As(V) rejection with the increase of permeate flux.
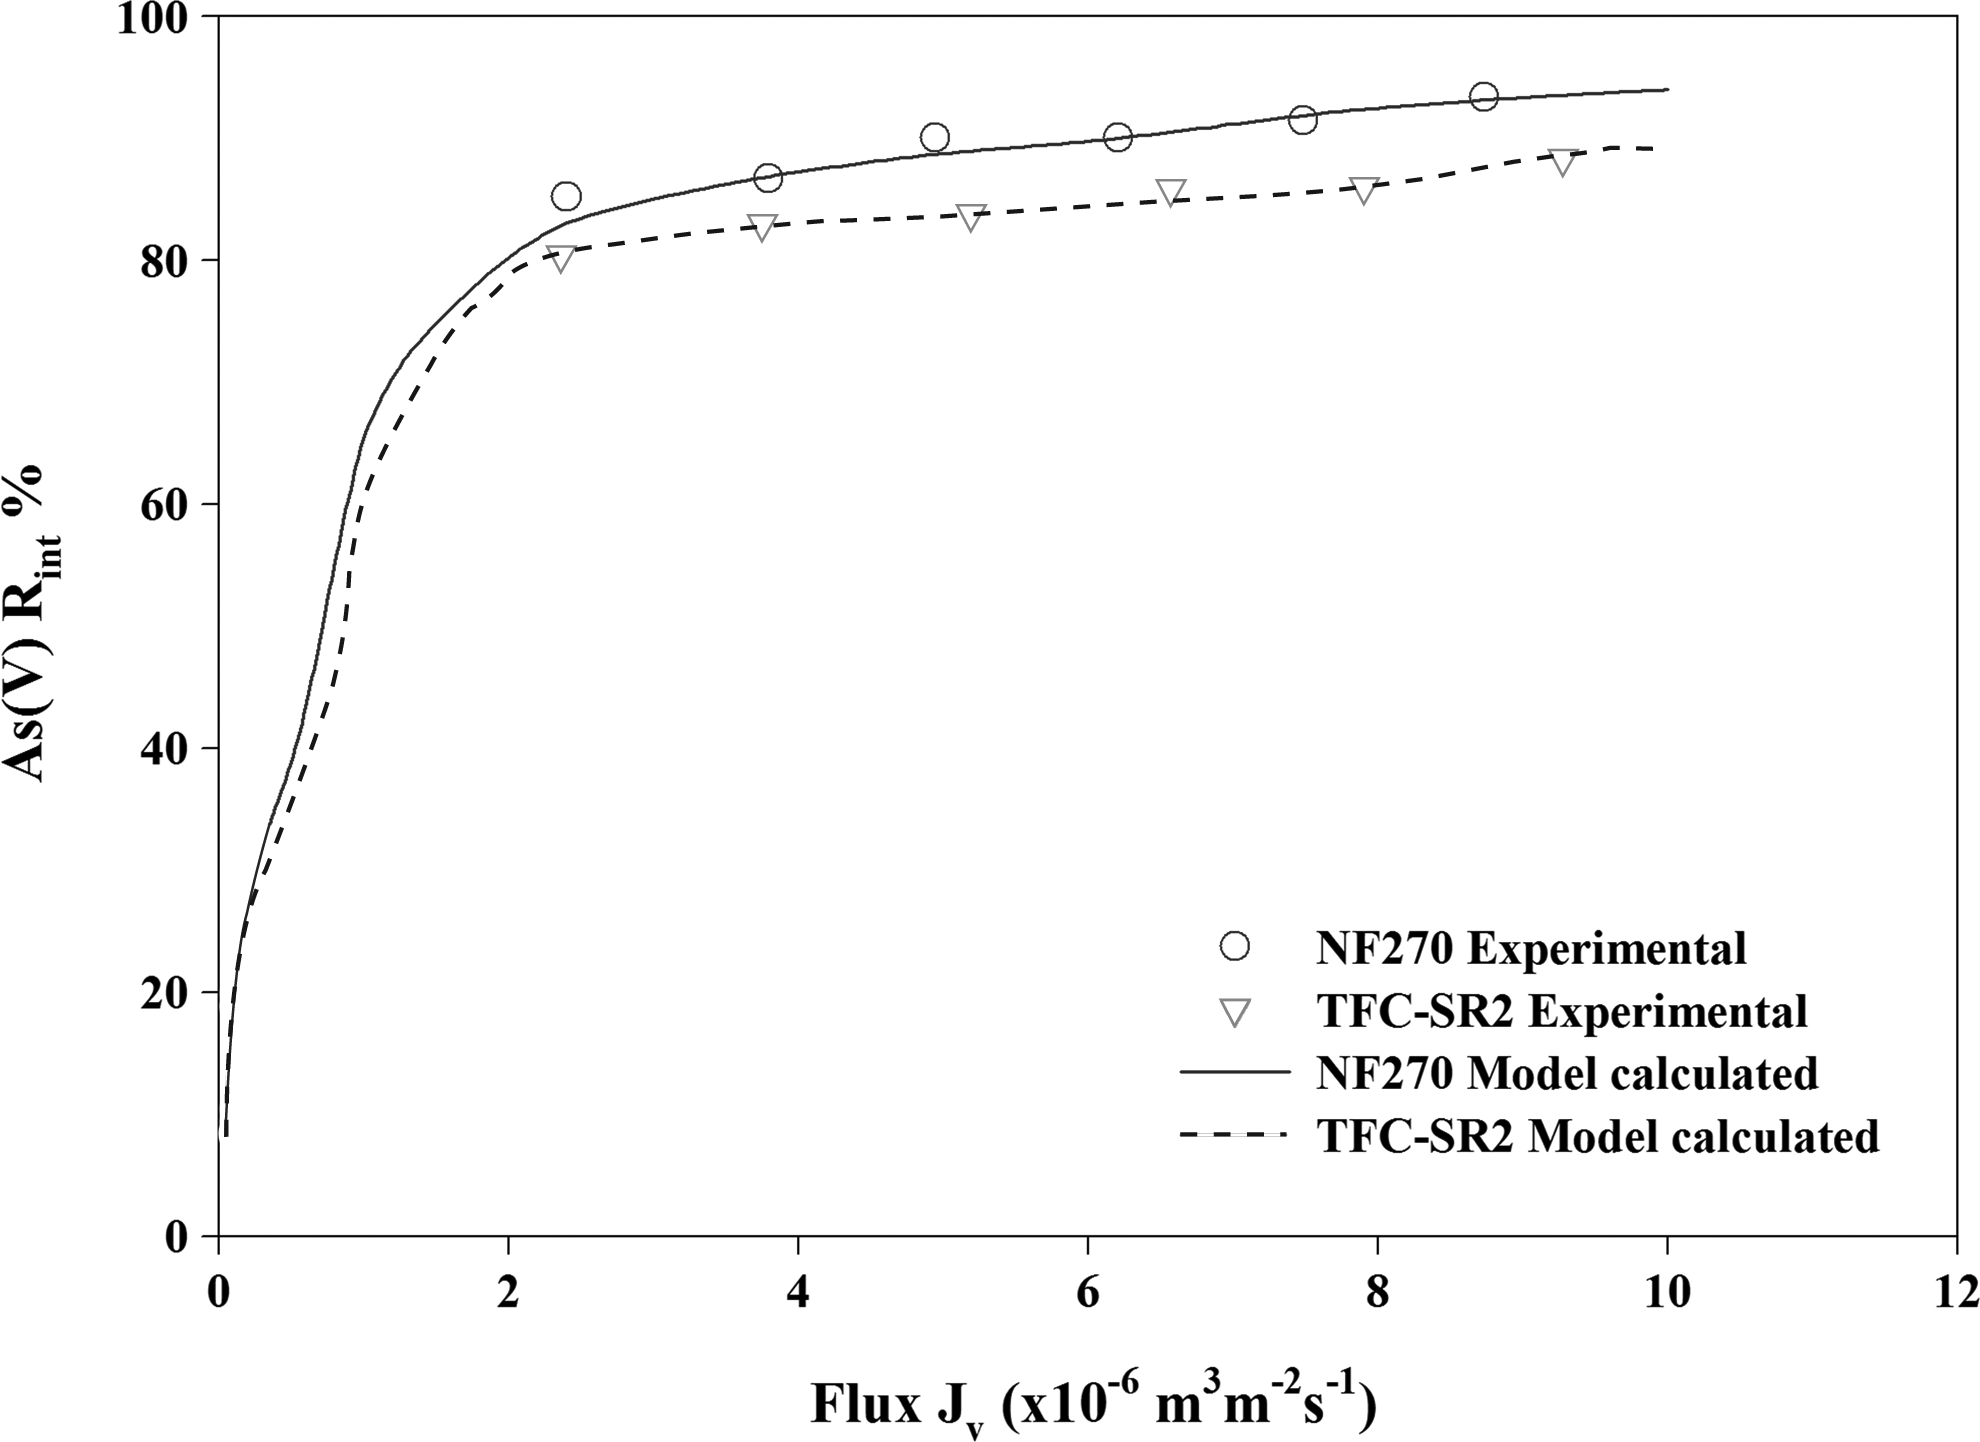
Comparison of intrinsic rejection with Donnan-steric-pore model calculated results of As(V) by NF270 and TFC-SR-2 as a function of permeate flux.
During the model calculation, the membrane volume charge obtained through the potentiometric titration (−4.25 mol/L for NF270 and −3.80 mol/L for TFC-SR-2) was too large to be used for data fitting. The effective membrane charge density obtained by fitting rejection data of 0.1 M sodium chloride into DSPM, therefore, was used for model calculation. It is well known that the effective charge of NF membranes depends strongly on the bulk anion concentration (Velizarov et al., 2004). Given that As(V) concentration (200 ppb) in bulk solution was in the order of magnitude less than that of the background electrolyte (0.1 M NaCl, i.e., 5,850 ppm), it was plausible to hypothesize that the presence of As(V) in solution would not affect the values of the membrane charge density. The obtained volume charges for NF270 and TFC-SR-2 were −0.1384 and −0.1310 mol/L, respectively. The membrane volume charge determined by titration differed significantly from the volume charge obtained by the model fitting since the former analysis led to the total amount of fixed charge on the membrane including the support layer, whereas in the latter case only an effective charge concentration was delineated, which was affected by the pH and the electrolyte concentration of outside solutions, and reflected the real situation of the membrane in rejection experiments (Demisch and Pusch, 1976). Additionally, the CP could not be neglected in the calculation of the solute concentration on the membrane surface since the mass transfer coefficient k determined is in the same order of magnitude of the permeate flux (both at 10−6 m3/[m2·s]). The use of film theory incorporating the CP in model calculation appears to interpret well the arsenate rejection by nanofiltration.
Conclusions
In this study, the As(V) and As(III) rejections by NF270 and TFC-SR-2 were investigated. The results indicated that increases in the initial arsenic concentration, pH, and operating pressure and stirring speed led to enhanced As(V) rejections up to 90%. Increasing the ionic strength and concentration of co-occurring ions such as sulfate, phosphate, and calcium reduced As(V) rejection. The As(V) rejection was likely controlled by charge exclusion. For As(III), the rejections were relatively low (less than 40%) and decreased with increasing initial As(III) concentration and ionic strength. The pH did not significantly affect As(III) rejection at pH<9.2.
The As(III) rejection was analyzed by the Spiegler–Kedem–SHP model, however, the calculated rejections were much higher than the experimental data. This poor fitting could be mainly caused by the affinity interaction between arsenite molecules and membranes. The As(V) rejection was predicted by Donnan-Steric Pore Model coupled with the CP film theory. The calculated As(V) rejections were in good agreement with the experimental results.
Footnotes
Acknowledgments
Financial support for this research was provided by the U.S. National Science Foundation (No. BES-0296109). The experiments were conducted while the first author was a Ph.D. student in the Department of Civil and Environmental Engineering, University of Missouri. The authors greatly appreciate Professor Qingsong Yu in the Department of Mechanical & Aerospace Engineering at the University of Missouri for providing access to the video contact angle measurement system.
Author Disclosure Statement
No competing financial interests exist.
Nomenclature
Ak: porosity
ci: concentration of solute i at the surface of the membrane (mol/m3)
Ci: concentration of the ion i inside the membrane (mol/m3)
Cio: solute concentration at the membrane surface (mol/m3)
Ci,b: bulk concentration (mol/m3)
Ci,m: feed concentration of the ion i at the interface of the membrane (mol/m3)
Ci,p: permeate concentration of the ion i at the interface of the membrane (mol/m3)
ci|x=0: solute concentration within pore entrance (mol/m3)
ci|x=Δx: solute concentration within pore outlet (mol/m3)
Cx: effective membrane volume charge (mol/m3)
D: diffusion coefficient
dh: hydraulic diameter (m)
Di,p: hindered diffusivity (m2/s)
Di,∞: bulk diffusivity (m2/s)
DS: diffusivity of the solute (m2/s)
I: ionic strength
Ji: flux of ion i (m/s)
Js: the molar solute flux (mol/[m2·s])
Jv: total volume flux (m/s)
Jw: pure water flux
K: mass transfer coefficient
Ki,c: hindrance factor for convection
Ki,d: hindrance factor for diffusion
K−1: hydrodynamic coefficient
ΔP: applied hydraulic pressure (Pa)
Re: Reynolds number
Ri: intrinsic rejection
Ro: observed rejection
rp: pore radius of the membrane (m)
rs: solute radius (m)
rstirrer: radius of the stirrer in the membrane cell (m)
Sc: Schmidt number
Sh: Sherwood number (J/[mol·K])
Δx: membrane thickness (m)
X: effective membrane volume charge (mol/m3)
zi: the valance of solute i
Greek Letters
φX: effective membrane volume charge (mol/m3)
H: the liquid viscosity (Pa·s)
λ: ratio of solute radius (rs) to membrane pore radius (rp)
N: the kinematic viscosity (m2/s)
Φ: steric partition coefficient
ρ: density of water (g/m3)
Σ: reflection coefficient
Ω: stirring speed (rpm)
Ξ: normalized volume charge of membrane
ΔΨm,x=0: membrane potential at the feed side (V)
ΔΨm,x=Δx: membrane potential at the permeate side (V)
ΔΨd|x=0: Donnan potential at the feed side (V)
ΔΨd|x=Δx: Donnan potential at the permeate side (V)