
Abstract
Abstract
Toward the development of a “green” technology for cleaning soil contaminated by halogenated hydrophobic organic contaminants, here we demonstrate that combined use of palladium (Pd) and rhodium (Rh) catalysts enables the conversion of 1,2,4,5-tetrachlorobenzene (TeCB) to cyclohexane in mixtures of water and ethanol. We tested the hypotheses that, in batch reactors, (1) an increased ratio of water to ethanol in water/ethanol solvents would increase the reaction rates of both Pd-catalyzed hydrodehalogenation (HDH) and Rh-catalyzed hydrogenation, and (2) catalytic reaction rate coefficients would be constant above a hydrogen (H2) pressure threshold, but would decrease with decreasing H2 pressure below that threshold. These hypotheses were derived from a Langmuir–Hinshelwood model for the heterogeneous catalytic reactions. Complete conversion of TeCB to cyclohexane was achieved at all experimental conditions tested, suggesting that the proposed technology may be technically viable. Concentration data were consistent with an apparent first-order kinetic model in which Pd-catalyzed HDH and Rh-catalyzed hydrogenation occur in series. As expected, HDH and hydrogenation rate coefficients increased as the fraction of water in the solvent increased. However, contrary to expectations, HDH rate coefficients decreased when H2 pressure increased from 69 to 207 to 345 kPa. We attributed this to the displacement of TeCB by H2 on the catalyst surface at higher H2 pressures. No statistically significant effect of H2 pressure on hydrogenation rate coefficients was observed. The findings suggest that the proposed technology should be operated with at least 50% water in the solvent and a H2 pressure as low as 30–70 kPa.
Introduction
T
Several methods are currently available for the remediation of soil contaminated by HHOCs, including incineration, biological reduction, electrokinetic remediation, and solvent extraction paired with activated carbon adsorption. However, significant disadvantages are associated with each of these technologies. Incomplete incineration of HHOCs can generate hazardous air pollutants, such as halogenated dioxins and furans (Söderström and Marklund, 2002; Rivera-Austrui et al., 2011). Hazardous waste incineration is also associated with high operation and maintenance costs (Tang, 2004). Biological reduction has been shown to successfully reduce concentrations of chlorinated organic compounds in soil (Potrawfke et al., 1998; Chen et al., 2010), but the challenges of potentially long lag phases and the difficulty of maintaining bacterial biomass currently limit large-scale use of bioremediation (Chaplin et al., 2012). Electrokinetic remediation and solvent extraction are phase-transfer remediation technologies that aim at separating pollutants from soil but do not destroy them (Lee et al., 2010). Electrokinetic remediation utilizes a direct current to induce pollutant transport, but it can be hindered by the sorption of contaminants to soil particles (Gomes et al., 2012). Finally, under traditional solvent extraction, HHOCs tend to concentrate in either the solvent or in a secondary waste stream of contaminated activated carbon (U.S. EPA, 2001), which should then be properly stored or further treated to prevent future recontamination or human exposure.
To overcome these challenges, Wee and Cunningham (2008, 2011, 2013) recently introduced the Remedial Extraction and Catalytic Hydrodehalogenation (REACH) technology. Their goal was to develop a technology that would eliminate the production of a secondary waste stream when treating soil for HHOC contamination, and would, therefore, be a more environmentally friendly soil remediation alternative. The REACH technology combines solvent extraction of contaminants from soil with catalytic hydrodehalogenation (HDH), a process previously applied to contaminated aqueous solutions, in which contaminants are transformed with the aid of catalysts to less toxic end-products (Kovenklioglu et al., 1992; Xia et al., 2004, 2009; Mackenzie et al., 2006; Léger et al., 2007; Ordóñez et al., 2010). Wee and Cunningham (2008, 2011, 2013) successfully demonstrated that 1,2,4,5-tetrachlorobenzene (TeCB), one of the EPA's 31 priority chemicals (U.S. EPA, 2012), could be extracted from soil and transformed into benzene using Pd-catalyzed HDH in a water-and-ethanol solvent under mild hydrogen (H2) gas pressure. However, though benzene is less toxic than TeCB, it is still a regulated contaminant, and is, therefore, not an acceptable end product in most instances.
Wee and Cunningham (2011) proposed that combining the REACH technology with rhodium (Rh)-catalyzed hydrogenation of the produced benzene might transform benzene to cyclohexane, which is a more benign end product. Thus, a natural next stage in development of the REACH technology is investigation of combined palladium (Pd)-catalyzed HDH and Rh-catalyzed hydrogenation of target contaminants, such as TeCB. More specifically, since Wee and Cunningham (2008, 2013) observed important effects of solvent composition on the HDH reaction, there is now a need to investigate the effects of solvent composition on the combined HDH and hydrogenation reactions. In addition, since H2 is a reactant in both the HDH of TeCB and the hydrogenation of benzene, H2 pressure is another operating condition that has the potential to influence catalytic reaction rates, and, therefore, warrants investigation.
Therefore, the objective of this article is to contribute to the development of the REACH process by quantifying the effects of solvent composition and H2 pressure on Pd-catalyzed HDH and Rh-catalyzed hydrogenation reaction rates. Specifically, here, we test three hypotheses: (1) TeCB dissolved in mixtures of water and ethanol can be catalytically converted to cyclohexane at ambient temperature and under mild (<350 kPa) H2 pressure; (2) an increased ratio of water to ethanol in the solvent will increase the reaction rates of both Pd-catalyzed HDH and Rh-catalyzed hydrogenation; and (3) catalytic reaction rate coefficients will remain constant above an H2 pressure threshold, but will decrease with decreasing H2 pressure beneath that threshold. The rationale for the second and third hypotheses is explained subsequently in this article.
We use TeCB as a model contaminant for three reasons: (1) It is one of the U.S. EPA's targeted priority chemicals; (2) it has been previously studied by Wee and Cunningham (2008, 2011, 2013), and, therefore, results obtained here can be interpreted and evaluated in the context of earlier results; and (3) it has physical and chemical properties that are qualitatively similar to many HHOCs, and, therefore, information gained about TeCB may be applicable to other contaminants of concern.
Materials and Methods
Chemicals and catalysts
The catalysts and chemicals used for experiments and for sample analyses are listed in Table 1. Alumina (Al2O3)-supported catalysts were used to maintain consistency with the work of Wee and Cunningham (2008, 2011, 2013). The supported Pd catalyst used in the HDH of TeCB was 5% Pd by weight on Al2O3, and will be referred to as Pd-on-Al2O3. The supported Rh catalyst used in the hydrogenation of benzene was 0.5% Rh by weight on Al2O3, and will be referred to as Rh-on-Al2O3. Catalysts were used as received with no modification before use. All gases were supplied by Airgas. Ultra-high-purity grade (99.999%) H2 was used as an H2 source during batch reactor experiments. Gases used to operate the gas chromatograph for sample analysis were helium (99.999%) as a carrier gas, nitrogen (99.999%) as a make-up gas for the electron capture detector, and H2 (99.999%) and compressed air (20–22% O2) as fuel for the flame ionization detector. Deionized water was obtained from a Thermo Scientific Barnstead GenPure water purification system.
Pd, palladium; Rh, rhodium.
Batch reactor experiments
All experiments were conducted with a Parr 3911 hydrogenation apparatus, which was operated within a fume hood. The apparatus included a reaction bottle, bottle rocker, reaction bottle pressure gauge, 4-L H2 gas tank, and gas tank pressure regulator (Augustine, 1965). The 4-L H2 gas tank enabled control of H2 gas pressure in the reaction bottle. The H2 gas tank pressure regulator was connected to an H2 gas cylinder. Catalytic reactions took place inside a 500-mL borosilicate glass reaction bottle, which was sealed with a rubber stopper and connected to the H2 gas tank with polypropylene tubing. The reaction bottle has a maximum pressure limit of 60 psi, and was surrounded by a metal bottle shield during experiments for safety. The reaction bottle was agitated at 200 rpm on the bottle rocker during experiments to minimize potential mass transfer limitations (Smith and Notheisz, 1999).
All experiments were conducted by filling the reaction bottle with 300 mL of solvent in the desired ratio of water to ethanol. For example, to achieve a 50:50 water/ethanol solvent composition, 150 mL of water and 150 mL of ethanol were added to the reaction bottle. The resulting volume of the solvent may have been slightly less than 300 mL due to the negative volume effect of mixing water and ethanol. However, any volume change due to this effect would be slight and can be considered negligible (Wee and Cunningham, 2008).
Experiments were conducted as follows. The solvent in the reaction bottle was spiked to a concentration of 10 mg/L TeCB using a TeCB-in-ethanol stock solution, the preparation of which is described elsewhere (Cone, 2013). Two samples of the spiked solvent were collected immediately to confirm the initial concentration of 10 mg/L TeCB. Then, ∼0.2 g of Pd-on-Al2O3 catalyst and 0.9 g of Rh-on-Al2O3 catalyst were added to the reaction bottle. (Due to slight variations in the mass of individual catalyst pellets, the actual Pd-on-Al2O3 catalyst mass varied from 0.1986 to 0.2171 g, and the actual Rh-on-Al2O3 catalyst mass varied from 0.9017 to 0.9390 g.) After the reaction bottle was connected to the Parr hydrogenation apparatus, any air in the bottle headspace was removed by filling the bottle with H2 gas to at least 45 psi and then venting the bottle headspace. The venting procedure was repeated thrice to ensure that any air was fully evacuated. After venting, the reaction bottle was pressurized to the desired H2 pressure, and the hydrogenation apparatus was activated. The reaction bottle remained open to the H2 tank during experiments to maintain a constant H2 pressure. After the desired reaction time had elapsed, the reaction bottle was isolated from the H2 tank and the bottle headspace was vented. A 10-mL sample of the reaction bottle solvent was filtered through a Whatman 934-AH glass microfiber filter (24 mm diameter) by a syringe. Two aliquots (2 mL each) from the 10 mL sample were tested for final concentrations of TeCB, and two aliquots (2 mL each) were tested for final concentrations of benzene and cyclohexane. Methods of sample analysis are described subsequently.
The rubber stopper and tubing used to connect the reaction bottle to the hydrogenation apparatus were cleaned after each experiment. Fresh catalyst was used for each experiment to minimize the potential influence of catalyst deactivation on catalytic reaction rates. All experiments were performed at room temperature (22.5°C±1.5°C).
Experimental design and experimental conditions tested
In order to investigate the effects of solvent composition and H2 pressure on HDH and hydrogenation reaction rates, batch experiments were conducted at multiple reaction times under the following operating conditions: (1) 50:50 (v/v, before mixing) water/ethanol solvent and 345 kPa H2 pressure; (2) 67:33 water/ethanol solvent and 345 kPa; (3) 33:67 water/ethanol solvent and 345 kPa; (4) 50:50 water/ethanol solvent and 207 kPa; and (5) 50:50 water/ethanol solvent and 69 kPa. Thus, catalytic reaction rates were investigated for three different water/ethanol solvent compositions (50:50, 67:33, and 33:67, all v/v before mixing) and three different H2 pressures (345, 207, and 69 kPa). Higher water-to-ethanol ratios were not investigated, because Wee and Cunningham (2013) previously found that the efficiency of TeCB extraction from soil declines for solvent compositions of 67% water or higher. H2 pressure experiments were conducted with a 50:50 water/ethanol solvent as a “default” solvent composition, because this has been successfully used to treat contaminated soil in the semicontinuous REACH system (Wee and Cunningham, 2011). Table 2 details the run times used for each set of experimental conditions. All experiments were performed in duplicate.
H2, hydrogen.
Control experiments
A control experiment was designed to test for alternative sources of contaminant mass loss other than catalytic reactions, such as volatilization or sorption onto the catalysts' surfaces. The experiment was conducted in duplicate at intermediate reaction conditions (50:50 water/ethanol solvent composition and 207 kPa). The control experiments were carried out in accordance with the general experimental method described earlier, but H2 gas was replaced by nitrogen gas to ensure that no catalytic HDH or hydrogenation reactions occurred. For these experiments, the reaction bottle was spiked with ∼10 mg/L each of cyclohexane, benzene, and TeCB in 150 mL of water and 150 mL of ethanol. Four initial samples were taken. Two were analyzed for initial TeCB concentration, and two were analyzed for initial cyclohexane and benzene, using analytical methods described subsequently. The reactor was then shaken under 207 kPa of N2 pressure. After 8 h, the reactor was stopped and four final samples were taken. Two samples were analyzed for final concentrations of TeCB, and two samples were analyzed for final concentrations of cyclohexane and benzene. The ratio of final concentrations to initial concentrations was calculated to determine the mass percentage lost for each chemical.
Sample analysis by gas chromatography
Collected samples were analyzed by gas chromatography (GC), with electron capture detection (ECD) for analysis of TeCB, and with flame ionization detection (FID) for analysis of benzene and cyclohexane. All samples were analyzed on a Perkin–Elmer Clarus 500 GC.
Samples were prepared for TeCB analysis by placing 2 mL of collected sample in a 5-mL glass vial with 2 mL of pentane. The pentane had been spiked with trichloroethene (TCE) as an internal standard. Sample vials were secured with screw caps and shaken on a VWR OS-500 Orbital Shaker at ∼200 agitations per minute for 1 h. Samples were then equilibrated (i.e., allowed to rest undisturbed) for 1 h, enabling TeCB to transfer into the pentane. Then, 1 mL of pentane from the sample vial was withdrawn by a syringe and placed in a 2-mL Perkin–Elmer amber glass autosampler vial with pierceable septum. The GC column used during TeCB analysis was either a DB-WAX or an HP-5 (both J&W Scientific). Details of the chromatographic method are provided by Cone (2013). The GC/ECD was calibrated by preparing and analyzing samples of known TeCB concentration, then plotting the ratio of TeCB/TCE peak area versus TeCB concentration.
Samples were prepared for benzene and cyclohexane analysis by placing 2 mL of sample in a 5-mL borosilicate glass vial that was affixed with an open screw cap with polytetrafluoroehtylene-lined septum. The vial was shaken on a VWR OS-500 Orbital Shaker at ∼200 agitations per minute for 1 h, then equilibrated with the vial headspace (i.e., allowed to rest undisturbed) for 24 h. This allowed a fraction of the benzene and cyclohexane to transfer from the aqueous phase to the headspace. Then, 1.0 mL of headspace was withdrawn with a gas-tight syringe and manually injected into the GC. The GC column used during benzene and cyclohexane analysis was an RTX-1301 (Restek), which efficiently separated benzene, cyclohexane, and ethanol. Details of the chromatographic method are provided by Cone (2013). Ethanol served as an effective internal standard for GC/FID analysis of benzene and cyclohexane because all samples came from a solvent with known ethanol composition, and some ethanol was transferred to the headspace during equilibration. The GC/FID was calibrated by preparing and analyzing samples of known benzene and cyclohexane concentrations, then plotting the ratio of peak areas (benzene/ethanol or cyclohexane/ethanol) versus analyte concentration.
Conceptual and mathematical model
The purpose of this section is to develop a conceptual and mathematical model describing the behavior of TeCB, benzene, and cyclohexane in the batch experiments. When introducing the REACH soil remediation technology, Wee and Cunningham (2008) developed a conceptual and mathematical model for the kinetics of Pd-catalyzed HDH of TeCB. Here, we extend the model of Wee and Cunningham (2008) to describe the hydrogenation of benzene as well as the HDH of TeCB.
Conceptual model
Following Wee and Cunningham (2008), we use a Langmuir–Hinshelwood framework as the basis of our conceptual and mathematical model. Langmuir–Hinshelwood models assume that surface catalytic reactions occur in the following sequence of steps (Hagen, 2006): (1) mass transfer of reactants from the solvent to the catalyst surface; (2) adsorption of reactants to the catalyst surface; (3) reaction on the catalyst surface; (4) desorption of the products of the reaction from the catalyst surface; and (5) mass transfer of reaction product(s) to the solvent.
Often, Langmuir–Hinshelwood models assume that the surface reaction is the rate-limiting step (Hagen, 2006). We invoke that assumption here. External mass transfer resistance is negligible, because the reaction bottles are shaken at 200 rpm, leading to high liquid-solid mass-transfer coefficients (Kato et al., 2001, 2003). Internal diffusion of chemical species within the pore structure of the catalyst pellets is probably complete within less than 1 h, based on the size of the pellets and reasonable estimates of the chemicals' diffusion coefficients. In addition, adsorption and desorption are typically rapid, so the concentrations of desorbed and adsorbed reactants can be assumed to be in rapid equilibrium. Therefore, it is a reasonable approach to treat the surface reaction as the rate-limiting step.
Previous research (Léger et al., 2007; Wee and Cunningham, 2008) suggests that, under the conditions considered here, Pd catalyzes the HDH of TeCB but not the hydrogenation of the benzene produced. We now also assume that Rh catalyzes hydrogenation of benzene to cyclohexane, but not HDH of TeCB. This assumption is something of an over-simplification, because Rh is known to catalyze HDH reactions in aqueous solution (e.g., Hubert et al., 2011; Baumgartner and McNeill, 2012; Baumgartner et al., 2013). However, at ambient or near-ambient temperature and mild H2 pressure, it has often been observed that Pd is a much more effective catalyst than Rh for HDH (Balko et al., 1993; Benítez and Del Angel, 2000, 2011; Gómez-Sainero et al., 2000; Urbano and Marinas, 2001; Yuan and Keane, 2003a; Diaz et al., 2011). Therefore, it may be acceptable to treat Rh-catalyzed HDH as insignificant in the systems considered here. With this simplification, the conversion of TeCB to cyclohexane can be considered a sequential process as illustrated by Fig. 1.
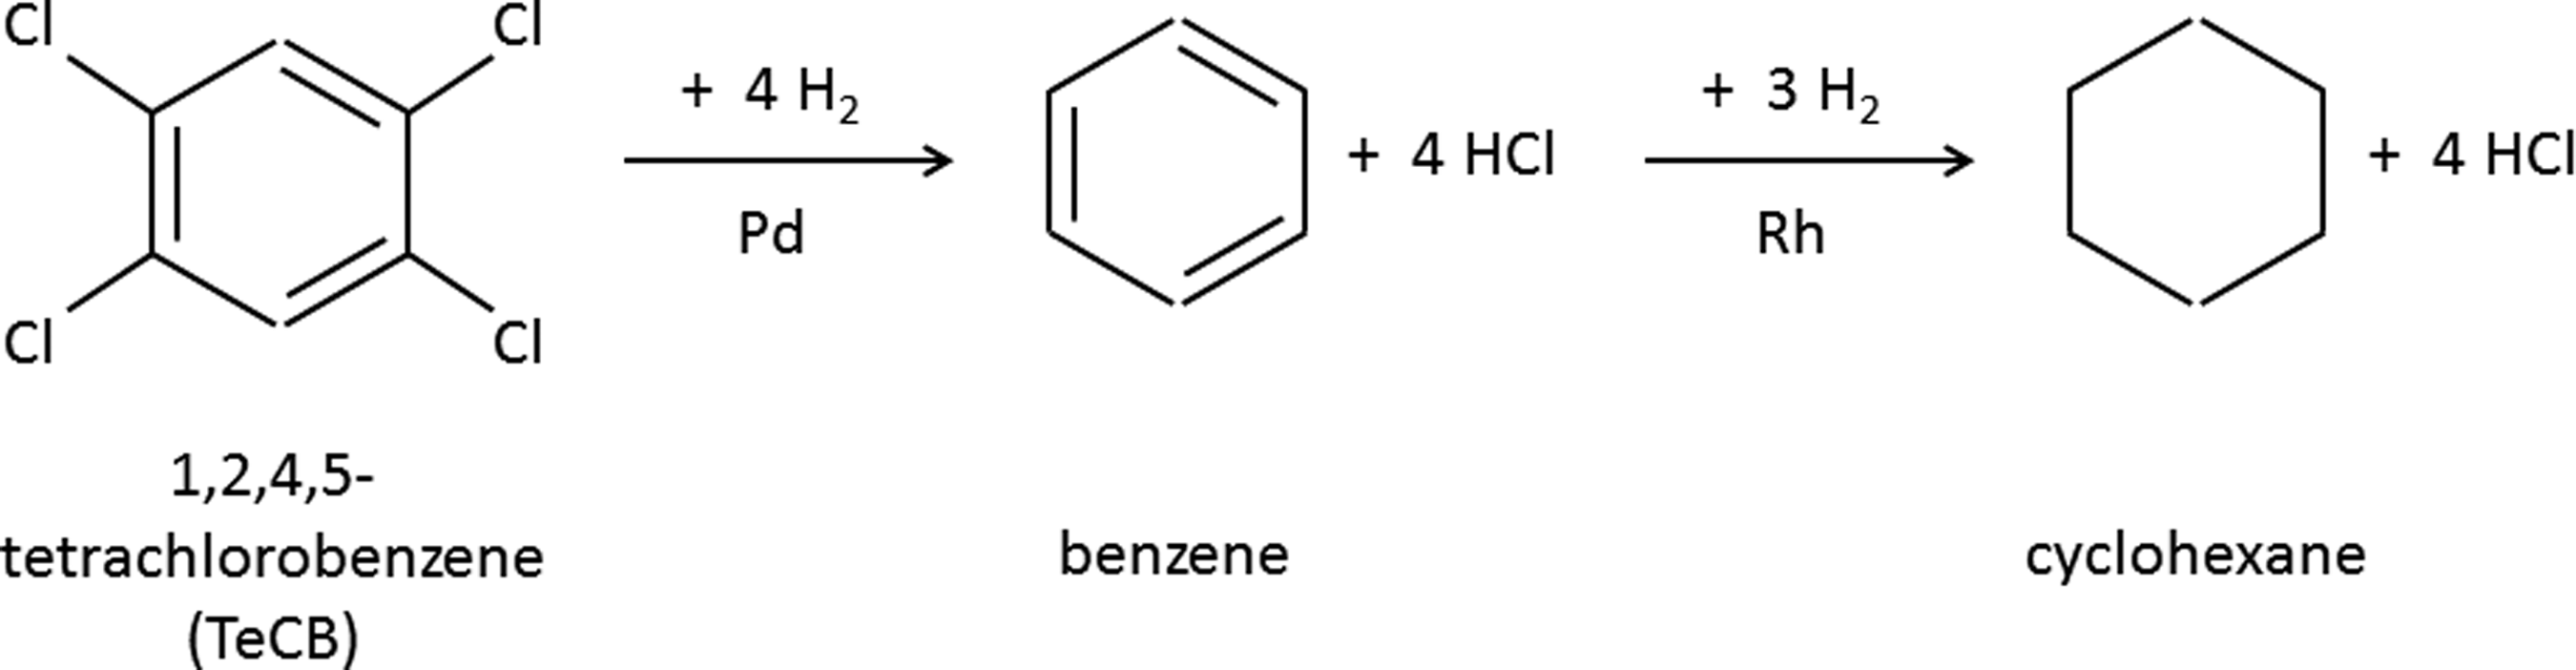
Stoichiometry for the conceptual model of sequential catalytic conversion of 1,2,4,5-tetrachlorobenzene (TeCB) to cyclohexane. Palladium (Pd) catalyzes the hydrodehalogenation of TeCB, and rhodium (Rh) catalyzes the hydrogenation of benzene.
Mathematical model
The rate of TeCB HDH on the Pd surface is assumed to be first order with regard to TeCB (Wee and Cunningham, 2008; Osborn, 2011) and unknown order n1 with regard to H2:
where r1 is the HDH reaction rate,
where r2 is the hydrogenation reaction rate,
Mass balance equations for TeCB and benzene in the batch reactor can be written as follows:
where MPd and MRh are the masses of the Pd and Rh catalysts in the reactor, V is the volume of solvent in the reactor, and CT and CB are the TeCB and benzene concentrations in the liquid solvent. Notice that the right-hand side of Equation (4) has two terms. The first term represents the formation of benzene by the HDH of TeCB, while the second term represents the consumption of benzene by hydrogenation.
The adsorption of TeCB and benzene onto the catalyst surfaces is assumed to follow Langmuir adsorption isotherms:
where all q and b terms are parameters of the Langmuir adsorption isotherms, the subscripts T and B represent the adsorption of TeCB and benzene (respectively), and the superscripts Pd and Rh indicate adsorption onto Pd and Rh catalysts, respectively. If the liquid-phase concentrations of TeCB and benzene are sufficiently low (C << 1/b), then the Langmuir adsorption isotherms are reduced to linear adsorption isotherms:
where the K terms are linear distribution coefficients (units of volume per mass) describing the equilibrium adsorption of TeCB and benzene onto the catalyst surfaces.
Combining Equations (1), (3), and (7) yields the following equation for the rate of change of TeCB concentration in the liquid solvent:
Similarly, combining Equations (2), (4), and (8) for the rate of change of benzene concentration in the liquid solvent yields the following:
The concentration of H2 on the Pd catalyst surface (
Substituting these into the preceding equations yields a simple mathematical model describing the rate of change of the liquid-phase TeCB and benzene concentrations:
By extension, the rate of formation of the end product, cyclohexane, is given by the following:
where CC is the concentration of cyclohexane in the water-ethanol solvent. Equations (13)–(15) comprise a familiar set of first-order kinetic expressions for sequential reactions of the form A→B→C. The apparent first-order reaction rate coefficients for the HDH and hydrogenation are k1 and k2, respectively.
This mathematical model does not account for competition for surface sites by the different constituents; that is, Equations (5) and (6) are noncompetitive forms of the Langmuir isotherm. It is possible, however, that the chemical species present (e.g., TeCB, benzene, cyclohexane, and H2) could compete for sites on the catalyst surfaces. For instance, the adsorption of cyclohexane on the surface of the Pd could result in less surface area available for TeCB. Future work may attempt to discern the importance of competition for adsorption. For the present analysis, the simpler noncompetitive isotherms were selected to facilitate the development and solution of the mathematical model.
Development of hypotheses
Based on the development discussed earlier, we can formulate hypotheses about how the apparent reaction rate coefficients k1 and k2 might depend on experimental conditions such as solvent composition and H2 pressure.
Since both TeCB and benzene are hydrophobic contaminants, we would expect that as the fraction of water in the water-ethanol solvent increases, the adsorption equilibria will shift to favor greater adsorption of TeCB and benzene from the liquid phase onto the catalyst surfaces. That is, the adsorption coefficients
Equations (11) and (12) also show that the apparent reaction rate coefficients k1 and k2 depend on the concentration of H2 adsorbed on the catalyst surfaces. If we assume that the adsorption of H2 onto the catalyst surfaces follows Langmuir isotherms [cf. Eqs. (5) and (6)], then there are finite capacities
Results and Discussion
Control experiments
As previously described, two control experiments were conducted at 207 kPa nitrogen gas pressure and 50:50 water/ethanol solvent compositions to test for losses of TeCB, benzene, and cyclohexane due to volatilization or sorption to catalyst surfaces. In the control experiments, percentage losses were 0–3% for TeCB, 11–23% for benzene, and 23–47% for cyclohexane after 8 h. This suggests that loss of cyclohexane, presumably by volatilization into the reactor headspace, can potentially be significant. However, more importantly, losses of TeCB were negligible and losses of benzene were low. Therefore, if TeCB and benzene are observed to disappear during the batch experiments, it may be assumed that they are disappearing due to catalytic conversion to their daughter products, not due to volatilization or adsorption.
Estimation of reaction rate coefficients k1 and k2
Equations (13)–(15) comprise a model for the expected disappearance and formation of TeCB, benzene, and cyclohexane in the liquid-phase solvent in the batch reactor. The solution to this set of differential equations is well known and is available in most text books on chemical reaction kinetics (e.g., Harris, 1966):
where C0 is the initial molar concentration of TeCB, and all concentrations are expressed in molar units. Apparent reaction rate coefficients k1 and k2 were estimated for each experiment by fitting Equations (16) and (17) to observed experimental data. Specifically, k1 was estimated by fitting (16) to observed TeCB data. Then, k2 was estimated by fitting (17) to observed benzene data, using the estimate of k1 already obtained. Fitting was performed using the “fit” function in MATLAB, which performs a nonlinear least-squares regression, and provides 95% confidence intervals around the best estimates. Estimates of k1 and k2 can then be used with Equations (16)–(18) to provide model predictions of TeCB, benzene, and cyclohexane concentrations in the reactor.
Effect of solvent composition
Measured and predicted concentrations of TeCB, benzene, and cyclohexane are plotted in Fig. 2 for experiments conducted at 345 kPa H2 pressure with 33:67, 50:50, and 67:33 water/ethanol solvents. Figure 2 shows that complete conversion of TeCB to cyclohexane was achieved with all three water/ethanol solvent compositions tested (50:50, 67:33, 33:67) at 345 kPa H2 pressure. Note that the time scale of the horizontal axis varies for the three experiments.
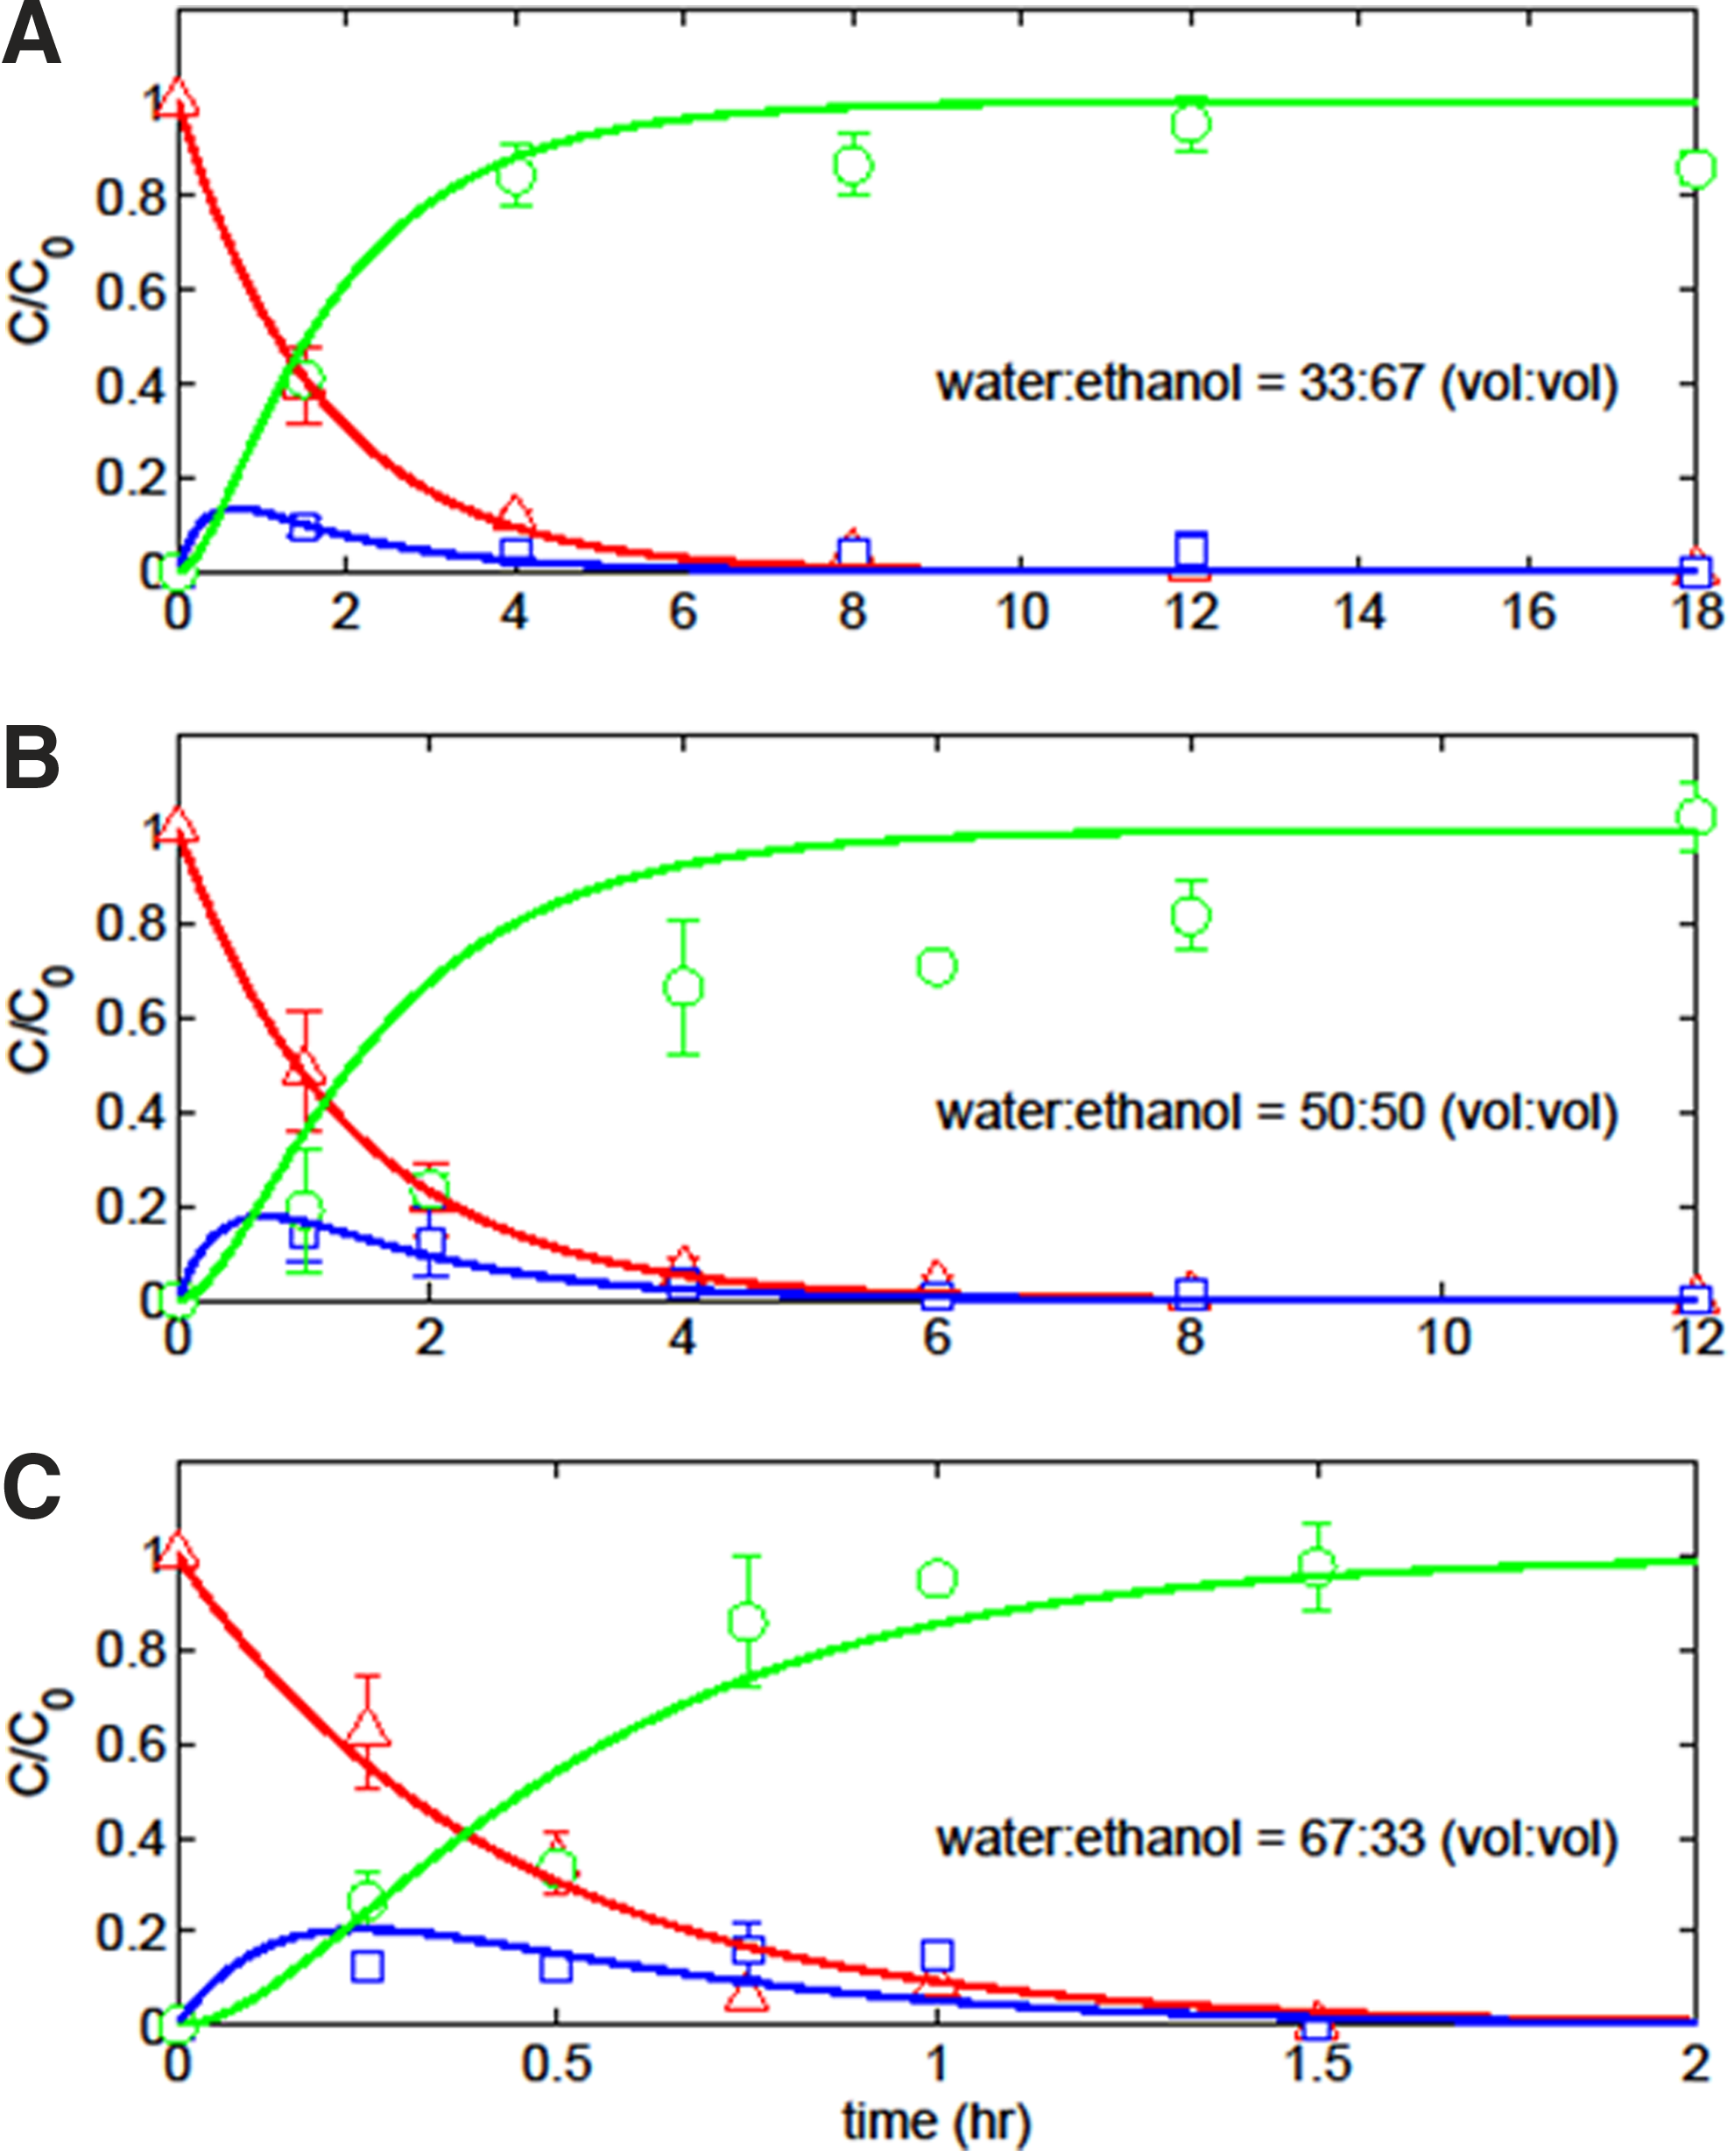
Measured and predicted concentrations of TeCB, benzene, and cyclohexane for three different solvent compositions (all at 345 kPa of H2):
Estimated reaction rate coefficients, reaction completion times, and mass balances for the three solvent composition experiments are summarized in Table 3. Reaction completion time is defined as the required time to reduce TeCB and benzene concentrations below detectable limits (0.1 mg/L). Mass balances were calculated by computing (CT+CB+CC)/C0 for each sample collected, then taking the average (arithmetic mean) over all samples, with each sample given equal weight. Mass balances for the 33:67 and 67:33 solvent experiments were good (101% and 94%). The mass balance for the 50:50 solvent experiment was somewhat low (79%). Figure 2 suggests that the low mass balance might be caused by losses of cyclohexane; that is, measured values of cyclohexane concentration were lower than model predictions. This explanation is consistent with the control experiments, which showed losses of cyclohexane, probably due to volatilization.
As hypothesized, the apparent HDH reaction rate coefficients (k1 values) increased significantly with an increase in the fraction of water in the solvent (Table 3). Hydrogenation rate coefficients (k2 values) appear to follow the same trend, but the breadth of the 95% confidence intervals on k2 estimates means that we cannot be 95% certain that increases in k2 were statistically significant. However, we note that at a solvent composition of 67% water, the conversion of TeCB to cyclohexane was essentially complete within 1.5 h, whereas when the solvent had a lower fraction of water, the reactions took >4 h to reach completion. Thus, overall, the experimental data clearly support the hypothesis that an increase in the solvent's water fraction leads to increases in the reaction rate coefficients for HDH and hydrogenation. In particular, increasing the water fraction from 50% to 67% appears to lead to large increases in both k1 and k2.
Most research groups that have studied catalytic HDH in water/alcohol solvents have also noticed that the addition of water increases HDH reaction rates (Hoke et al., 1992; Benítez and Del Angel, 1999; Xia et al., 2003; Concibido et al., 2006, 2007; Pozan and Boz, 2008; Wee and Cunningham, 2008; Gómez-Quero et al., 2010a). However, some research groups have observed that HDH reaction rates do not increase monotonically with the fraction of water in the solvent (Xia et al., 2003; Concibido et al., 2006, 2007; Pozan and Boz, 2008). Concibido et al. (2005) and Pozan and Boz (2008) actually observed a decrease in the HDH reaction rate when greater than 50% water by volume was used in a water/methanol solvent. However, Concibido et al. (2006) later found that this effect was unique to a water/methanol solvent. The experimental data presented here correspond well with the findings of Concibido et al. (2006), who observed an increase in the HDH rate for tetrachloroethene only when the water/ethanol solvent contained at least 50% water by volume. The general trend of increasing HDH reaction rates with increased water content in the solvent also corresponds well with earlier research on the REACH system conducted by Wee and Cunningham (2008). Several possible explanations have been offered for why the increased fraction of water increases the reaction rates (cf. Concibido et al., 2005, 2006; Xia et al., 2009; Ma et al., 2010; Gómez-Quero et al., 2010b; Navon et al., 2012; Yoneda et al., 2013). Our explanation for the observed effect is that a greater fraction of water in the solvent results in stronger adsorption of hydrophobic TeCB and benzene to the catalyst surfaces and, therefore, in faster reaction rates.
It is worth noting that Equation (18) predicts the cyclohexane behavior without any fitting to the cyclohexane data. That is, k1 and k2 are estimated by fitting Equations (16) and (17) to the TeCB and benzene data, but not the cyclohexane data. Therefore, agreement between the cyclohexane predictions and the cyclohexane data can be considered a check on the estimates of k1 and k2. Overall, Fig. 2 shows good agreement between model and data, suggesting that the estimates of k1 and k2 are reasonable.
Effect of H2 pressure
Measured and predicted concentrations of TeCB, benzene, and cyclohexane are plotted in Fig. 3 for experiments conducted at 345, 207, and 69 kPa (all at 50:50 solvent composition). Figure 3 shows that the complete conversion of TeCB to cyclohexane was achieved at all three H2 pressures tested (345, 207, 69 kPa). Results for the experiment conducted at 345 kPa and 50:50 solvent composition are shown both in Fig. 2B and in Fig. 3A. Estimated reaction rate coefficients, reaction completion times, and mass balances for the three H2 pressure experiments are summarized in Table 4. Mass balances for the 207 kPa experiment and the 69 kPa experiment were 89% and 102%, respectively. As previously noted, mass balances of less than 100% appear to have been caused primarily by loss (presumably volatilization) of cyclohexane.
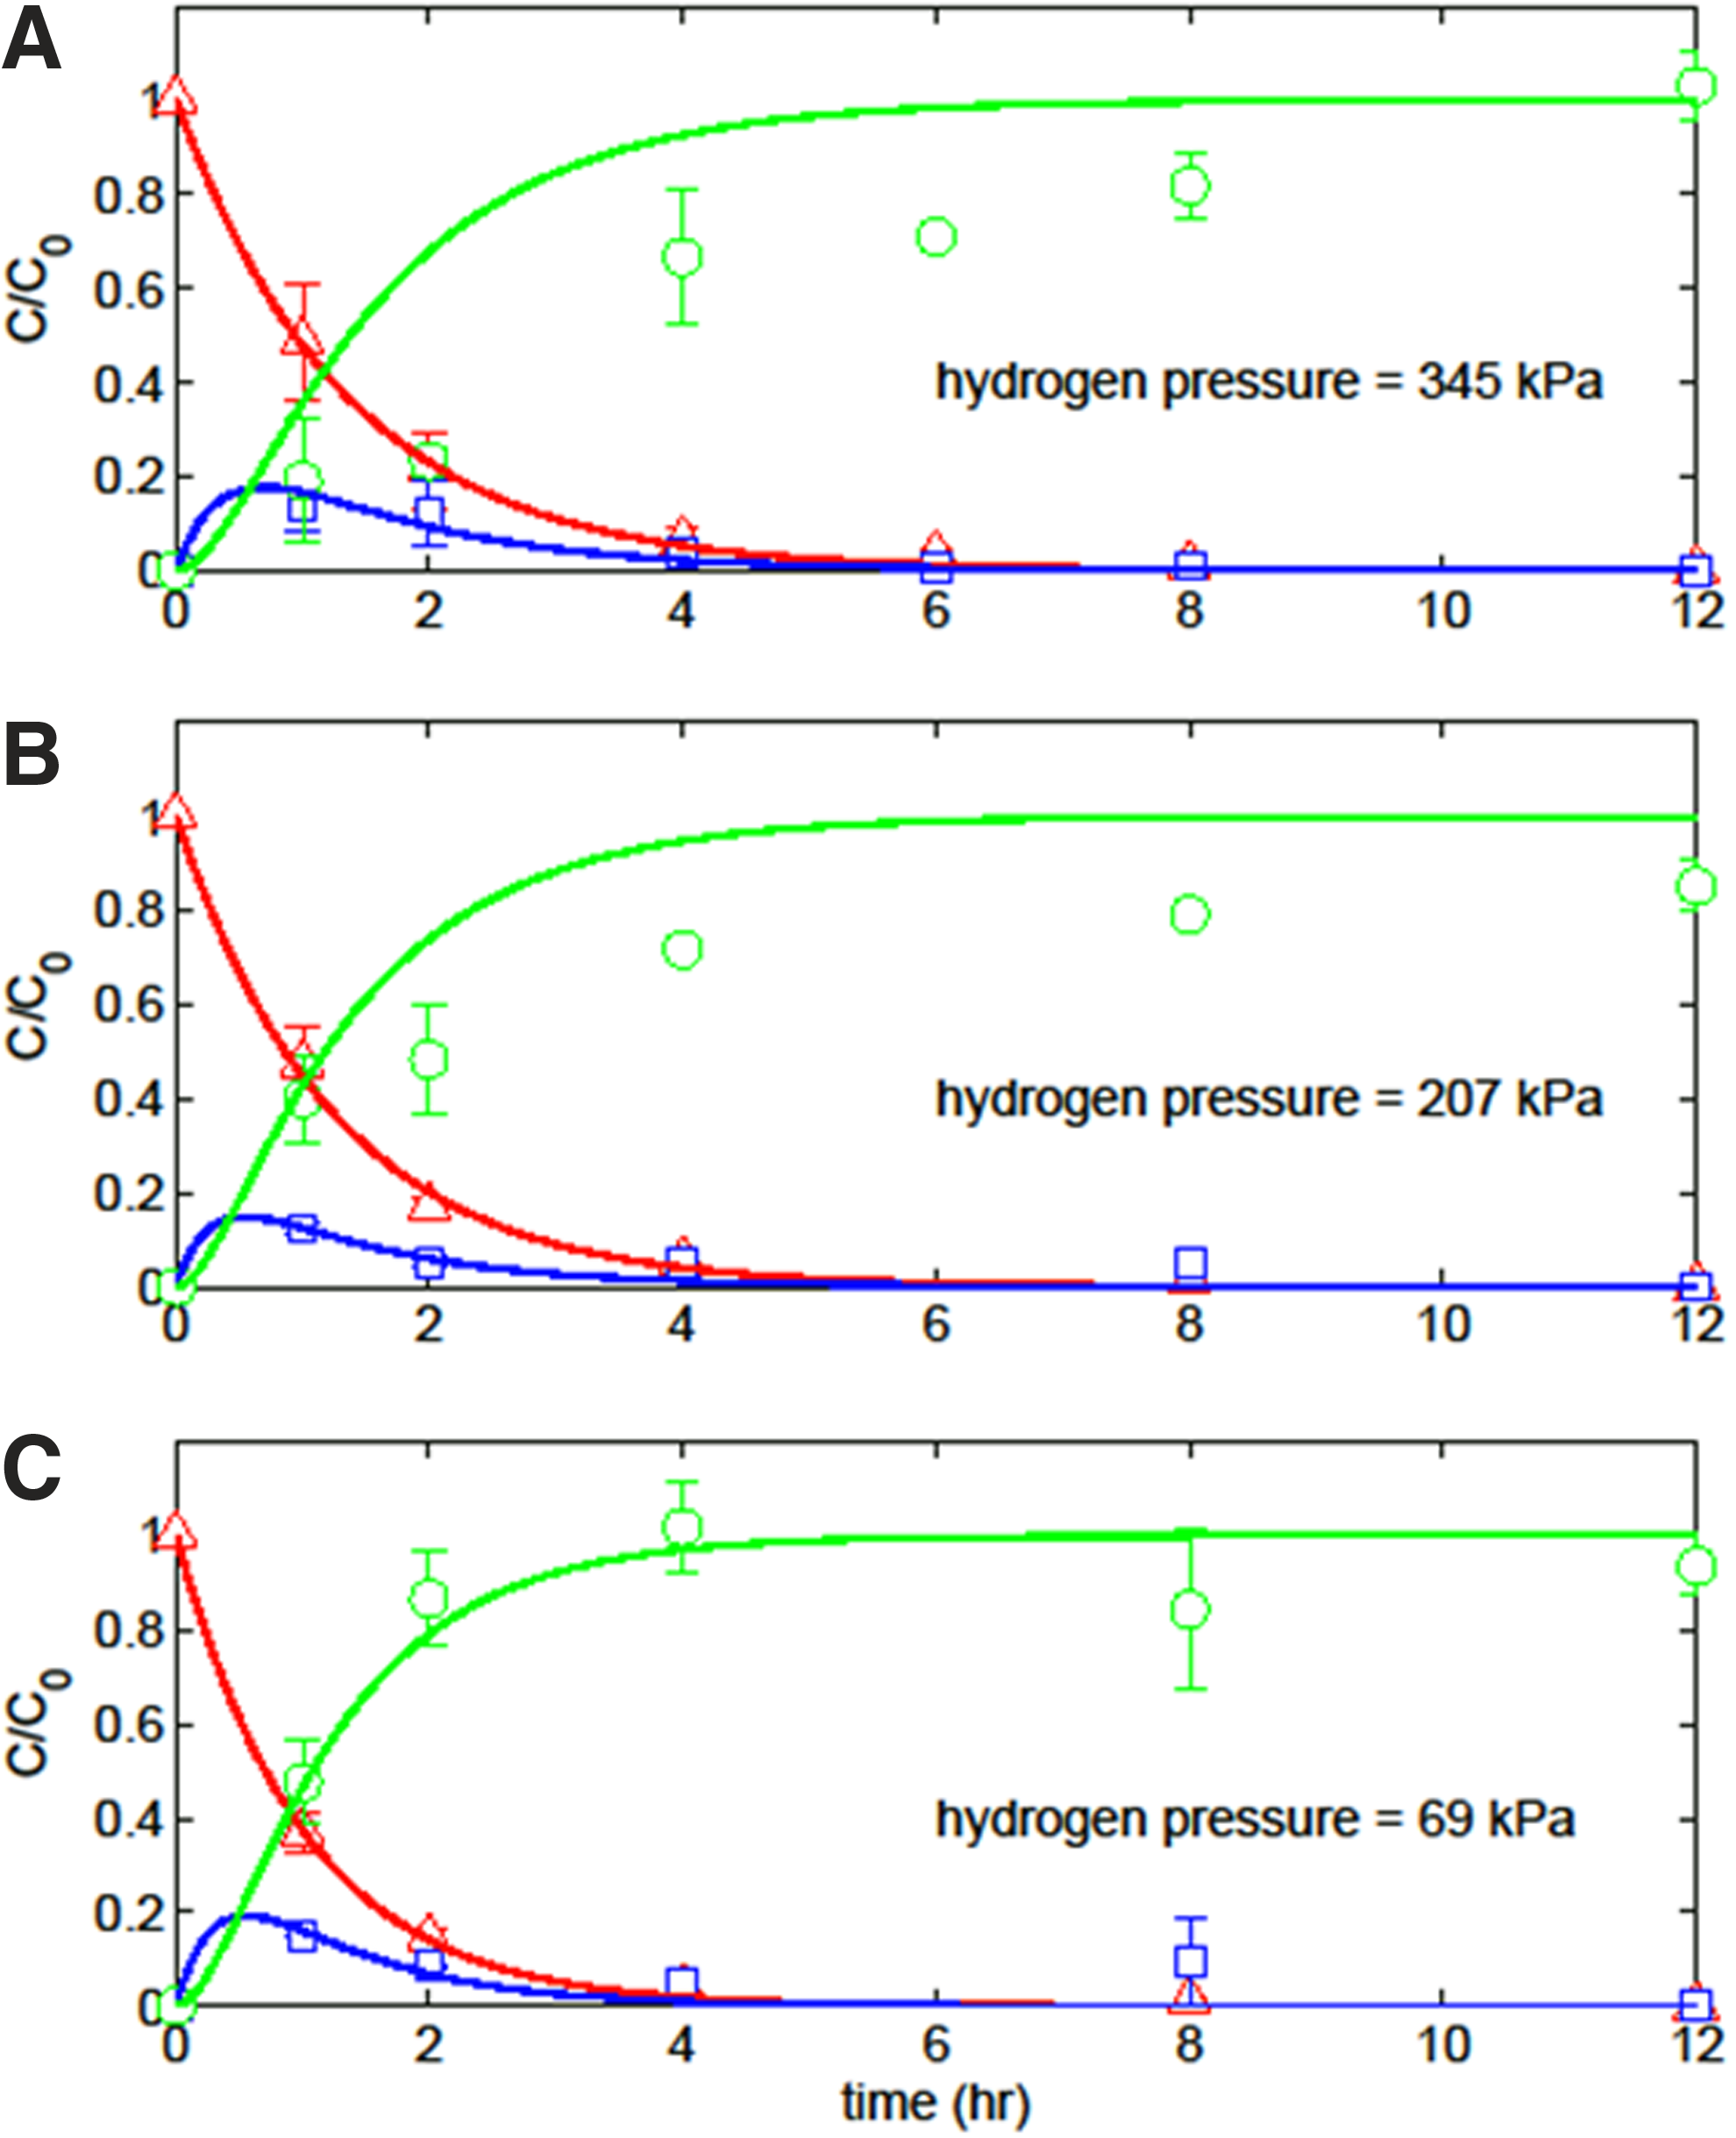
Measured and predicted concentrations of TeCB, benzene, and cyclohexane for three different hydrogen pressures (all at solvent composition of 50:50 water/ethanol):
It was hypothesized that reaction rate coefficients k1 and k2 would not vary with H2 pressure, as long as H2 pressure was above some threshold value for which the adsorption of H2 onto the catalyst surfaces was essentially complete. However, surprisingly, we observed a monotonic decrease in the HDH rate coefficient k1 as the H2 pressure increased (Table 4). The decrease was small, but when pressure increases from 69 to 207 kPa, the effect is statistically significant at the 95% confidence level.
Jujjuri and Keane (2010) similarly observed a slight decrease in HDH reaction rates for chlorinated benzenes with increasing H2 pressures in the range of ∼5–95 kPa. Jujjuri and Keane (2010) proposed that increased H2 pressures can inhibit HDH reactions due to competitive adsorption of H2 onto the catalyst and the displacement of intermediate products from the catalyst surface. Here, it is possible that the observed effect is indicative of a similar competitive adsorption effect between H2 and TeCB on the Pd surface. Hagen (2006) notes that such competitive effects occur in Langmuir–Hinshelwood reaction mechanisms. In contrast, some research groups have found hydrodechlorination reactions to be independent of H2 pressure (Kovenklioglu et al., 1992; Benítez and Del Angel, 1999), in keeping with our original hypothesis. A few research groups have also found increased H2 pressure to be beneficial (Forni et al., 1997; Yuan and Keane, 2003b), which would be expected if H2 adsorption onto the catalyst surface was not yet at its maximum value (Hagen, 2006).
With regard to hydrogenation rate coefficient k2, no statistically significant trend is discernible within the 95% confidence estimates. Although the estimated reaction rate coefficients do not increase monotonically with decreased H2 pressure, the k2 values for both 207 kPa (3.49 h–1) and 69 kPa (2.95 h–1) were higher than the value for 345 kPa (2.50 h–1). This suggests a similar effect to that observed for k1, where increasing H2 pressure above a certain threshold might actually inhibit catalytic hydrogenation, presumably because of competition for adsorption sites on the catalyst surfaces. However, examination of Fig. 3 shows that the conversion of TeCB to cyclohexane was completed within approximately the same time frame for all three pressure conditions. Thus, while the estimated reaction rate coefficients may indicate a slight H2 pressure effect, our overall conclusion is that the reactions are not strongly dependent on H2 pressure in the range of 70–350 kPa.
We had previously hypothesized that, below some threshold, increasing the H2 pressure would increase reaction rate coefficients (cf. Forni et al., 1997; Yuan and Keane, 2003b). If that hypothesis is correct, then the threshold should lie below 70 kPa, because no such effect was observed between 69 and 345 kPa. However, the Parr hydrogenation apparatus does not allow for precise pressure control at very low H2 pressures, and, therefore, a different experimental protocol may be required to identify the hypothesized H2 threshold. We ran a single experiment at a H2 pressure of ∼34 kPa, and observed that TeCB was converted completely to cyclohexane within 8 h, consistent with observations from the higher pressures. Therefore, it may be that the hypothesized pressure threshold is even lower than ∼34 kPa.
Implications for the REACH technology
Most importantly, we observed that TeCB can be fully converted to cyclohexane under all experimental conditions tested. This is an important extension of the previous work by Wee and Cunningham (2008), who converted TeCB only to benzene, which remains a hazardous contaminant. The ability to convert TeCB fully to cyclohexane suggests that the REACH technology may be technically viable as a soil remediation method.
Secondarily, the work presented here allows insights into the effects of important operating conditions. We recognize that the reaction rates observed in well-mixed batch reactor experiments will likely differ from those observed in a fully operational REACH system, which utilizes a stationary catalyst column (Wee and Cunningham, 2011). Nevertheless, the batch reactor data allow for a comparison of HDH and hydrogenation reaction rates with different solvent compositions and H2 pressures, which is useful for advancing the REACH technology.
While a solvent composition of 67% water was found to promote the fastest HDH and hydrogenation reaction rates, it is not necessarily the ideal solvent composition for the REACH technology due to the dual function of the solvent in both the extraction of contaminants from soil and the liquid-phase catalytic treatment of contaminants. Wee and Cunningham (2013) found that TeCB was not fully extracted from soil when the fraction of water in the solvent was greater than 50%. In contrast, pentachlorophenol (PCP) was readily extracted with as high as 67% water by volume in the solvent. The findings presented in this article suggest that a higher fraction of water in the REACH solvent should be utilized when possible to maximize catalytic reaction rates. This conclusion is supported by the general consensus in the literature that adding water to a pure alcohol solvent improves the kinetics of heterogeneous catalytic HDH (Hoke et al., 1992; Benítez and Del Angel, 1999; Xia et al., 2003; Concibido et al., 2006, 2007; Gómez-Quero et al., 2010a).
The TeCB data suggest that the rate of HDH is inversely related to H2 pressure in the range of 69–345 kPa, but that the effect is weak. Complete conversion of TeCB to cyclohexane was achieved at H2 pressures as low as 34 kPa. This finding suggests that a full-scale REACH system could be operated at H2 pressures lower than previously utilized (Wee and Cunningham, 2011). Operation at lower H2 gas pressures would further improve the safety of the REACH technology.
Summary
HHOCs are an important class of soil contaminants, and these include chlorinated benzenes, chlorinated phenols, polychlorinated biphenyls, and halogenated pesticides. Wee and Cunningham (2008, 2011, 2013) previously proposed a technology called REACH for cleaning soil contaminated by HHOCs; they observed that TeCB could be dehalogenated via a Pd catalyst, but produced benzene as an unacceptable end product. The work presented here aims at improving the proposed REACH technology by adding Rh-catalyzed hydrogenation to the Pd-catalyzed HDH process.
We tested three hypotheses: (1) TeCB dissolved in mixtures of water and ethanol can be catalytically converted to cyclohexane at ambient temperature and under mild (<350 kPa) H2 pressure; (2) an increased ratio of water to ethanol in the solvent will increase the reaction rates of both Pd-catalyzed HDH and Rh-catalyzed hydrogenation; and (3) catalytic reaction rate coefficients will remain constant above an H2 pressure threshold, but will decrease with decreasing H2 pressure beneath that threshold. The latter two hypotheses are derived from a Langmuir–Hinshelwood model for the heterogeneous catalytic reactions.
Most importantly, the complete conversion of TeCB to cyclohexane was achieved at all experimental conditions tested, suggesting that the proposed technology may be technically viable. Concentration data were consistent with an apparent first-order kinetic model in which Pd-catalyzed HDH and Rh-catalyzed hydrogenation occur in series. As expected, HDH and hydrogenation rate coefficients increased as the fraction of water in the solvent increased. However, contrary to expectations, HDH rate coefficients decreased when H2 pressure increased from 69 to 207 to 345 kPa. We attribute this to the displacement of TeCB by H2 on the catalyst surface at higher H2 pressures (cf. Hagen, 2006). No statistically significant effect of H2 pressure on hydrogenation rate coefficients was observed. The findings suggest that the proposed REACH technology should be operated with at least 50% water in the solvent and at H2 pressures as low as 30–70 kPa.
Footnotes
Acknowledgments
This material is based on work supported by the National Science Foundation (NSF) under awards 0851910 and 0965743. Any opinions, findings, conclusions, or recommendations are those of the authors and do not necessarily reflect the views of NSF. The authors thank three anonymous reviewers who offered constructive criticism of an earlier version of this article.
Author Disclosure Statement
No competing financial interests exist.