
Abstract
Abstract
Photocatalytic reduction of carbon dioxide (CO2) to hydrocarbons by using nanostructured materials activated by solar energy is a promising approach to recycling CO2 as a fuel feedstock. CO2 photoreduction, however, suffers from low efficiency mainly due to the inherent drawback of fast electron-hole recombination in photocatalysts. This work reports the synthesis of nanostructured composites of titania (TiO2) nanoparticles (NPs) encapsulated by reduced graphene oxide (rGO) nanosheets via an aerosol approach. The role of synthesis temperature and TiO2/GO ratio in CO2 photoreduction was investigated. As-prepared nanocomposites demonstrated enhanced CO2 conversion performance as compared with that of pristine TiO2 NPs due to the strong electron trapping capability of the rGO nanosheets.
Introduction
F
Another effective approach to counter CO2 emissions is to convert them to value-added products, such as hydrocarbon fuels, which not only mitigates CO2 emissions but also recycles it as a fuel feedstock. However, due to the stability of CO2, it is difficult to reduce or convert it to other hydrocarbons. The production of syngas, a mixture of carbon monoxide (CO) and hydrogen (H2), through reforming of methane (CO2+CH4→2CO+H2), provides a potential pathway for large-scale CO2 capture and utilization (Song, 2006). This reaction, however, is endothermic and requires high temperatures (700–900°C) for the reaction to proceed.
Alternately, photocatalysis-based technologies may be a more desirable way to convert CO2 into valuable chemicals, as it utilizes inexpensive co-reactants such as water in conjunction with abundant renewable solar energy. The promise of developments in nanotechnology makes this approach a potentially feasible one. In a typical semiconductor-based photocatalyst system, light with energy equal to or higher than the bandgap of the semiconductor results in photoexcitation and transfer of the electron (e−) to the conduction band, leaving a hole (h + ) in the valence band. Ideally, after photoexcitation, the e−–h + pairs (or excitons) should be separated spatially through built-in potentials and transferred to redox active sites, which involves several critical charge transfer steps (Fujishima et al., 2008). Among them, the e−–h+ recombination is considered one of the major limiting steps, as it is two or three orders of magnitude faster than other electron transfer processes (Indrakanti et al., 2009). Therefore, any process that inhibits e−–h+ recombination would greatly increase the efficiency and improve the rates of CO2 photoreduction.
A widely accepted method that is used to slow down the e−–h+ recombination rate is to deposit metal nanoparticles (NPs), such as platinum, copper, or iron, on semiconductor surfaces (Tseng et al., 2004; Usubharatana et al., 2006; Indrakanti et al., 2009; Wang et al., 2012a). These metal NPs serve as electron sinks and, thus, separate the e−–h+ pair to enhance the photoreduction efficiency. They usually need to be carefully engineered to get a better control over particle size, purity, and distribution, which require additional and often complex synthesis steps. In particular, the continued use of these metal-modified photocatalysts is limited due to photoinduced coagulation of these metal NPs (Eckstein and Kreibig, 1993; Kimura, 1994), resulting in increased particle size and deterioration in performance.
Interestingly, graphene nanosheets have emerged as a promising candidate for this purpose, as they are excellent conductors and can act as electron sinks to increase the lifetime of the photoinduced e−–h+ pairs. Graphene nanosheets also have a large specific surface area that could enhance the absorption of light and adsorption of reactants to further improve the CO2 photoreduction performance. In addition, such nanosheets exhibit high flexibility, enabling the possibility of encapsulation to form composite materials for a variety of applications (Kamat, 2011). However, the flat morphology of graphene sheets can be problematic, as the strong van der Waals attraction between layers can lead to aggregation and reduction of effective surface area (Luo et al., 2011). One possible solution is to turn the two-dimensional (2D) nanosheets into three-dimensional crumpled balls by aerosol techniques (Luo et al., 2011; Wang et al., 2012b). Crumpling the flat morphology of graphene oxide (GO) nanosheets enables the harnessing of the large specific surface area without compromising the desirable electrical properties (Stankovich et al., 2006; Ma et al., 2012). The relationship between the evaporation rate and confinement force in the crumpling process via aerosol routes has been investigated systematically (Wang et al., 2012b).
This work reports the development of crumpled nanocomposites of titania (TiO2) NPs encapsulated by reduced graphene oxide (rGO) nanosheets using a single-step furnace aerosol reactor (FuAR) method, which features short processing time and easy scalability. Effects of synthesis temperature and TiO2/GO ratio on the CO2 photoreduction efficiency were investigated systematically. The reduction mechanisms of GO played an important role in CO2 photoreduction. The comparison between the two reduction methods, thermal reduction and simultaneous photoreduction of GO is reported.
Materials and Methods
GO synthesis
The modified Hummers method was used to make GO from graphite (Hummers, 1958; Wang et al., 2012b). First, graphite powder (45 μm; Sigma-Aldrich) was oxidized with potassium permanganate in the presence of sulfuric acid (H2SO4) at 0°C. The solution was then allowed to slowly warm to room temperature. It was then stirred at 35°C for 2 h, after which the suspension was cooled in an ice bath and diluted with deionized (DI) water. To ensure the complete reduction of residual permanganate to soluble manganese ions, 30% hydrogen peroxide was added until gas evolution ceased. The suspension was finally filtered and washed with DI water until no presence of H2SO4 was detected. The GO was dried at 50°C overnight to obtain a brownish-black powder. To prepare the GO aqueous solution, the GO powder was dissolved in water and sonicated for 1 h. Finally, the solution was centrifuged at 10,000 rpm for 30 min to obtain the supernatant—a stable suspension of GO nanosheets in water (Model 5804, Eppendorf AG, Hamburg, Germany).
GO-TiO2 nanocomposite preparation
Nanocomposites were prepared by using the FuAR method (Fig. 1a). Details of the method are described in our previous reports (Wang et al., 2011, 2012b). The precursor solution was made by mixing TiO2 NPs (Aerodisp® W 740 X, Evonik Degussa Corp.), GO suspension, and DI water at various ratios. The solution was loaded into a collison nebulizer (BGI, Inc.). Compressed nitrogen (N2) gas entered through an inlet valve at a controlled pressure of 96.5 kPa, traveled into the nebulizer, and atomized the solution into micrometer-sized droplets (ddroplet=2.8 μm) (Wang et al., 2012b). The droplets passed through the furnace in which solvent (i.e., water in this work) evaporation, nanosheets crumpling, and composite particle formation occurred. The procedure was repeated by varying the furnace synthesis temperature (200–1000°C, at 5 wt% TiO2) and the weight percentages of TiO2 (relative to GO) in solution (0–20 wt%, at 800°C).
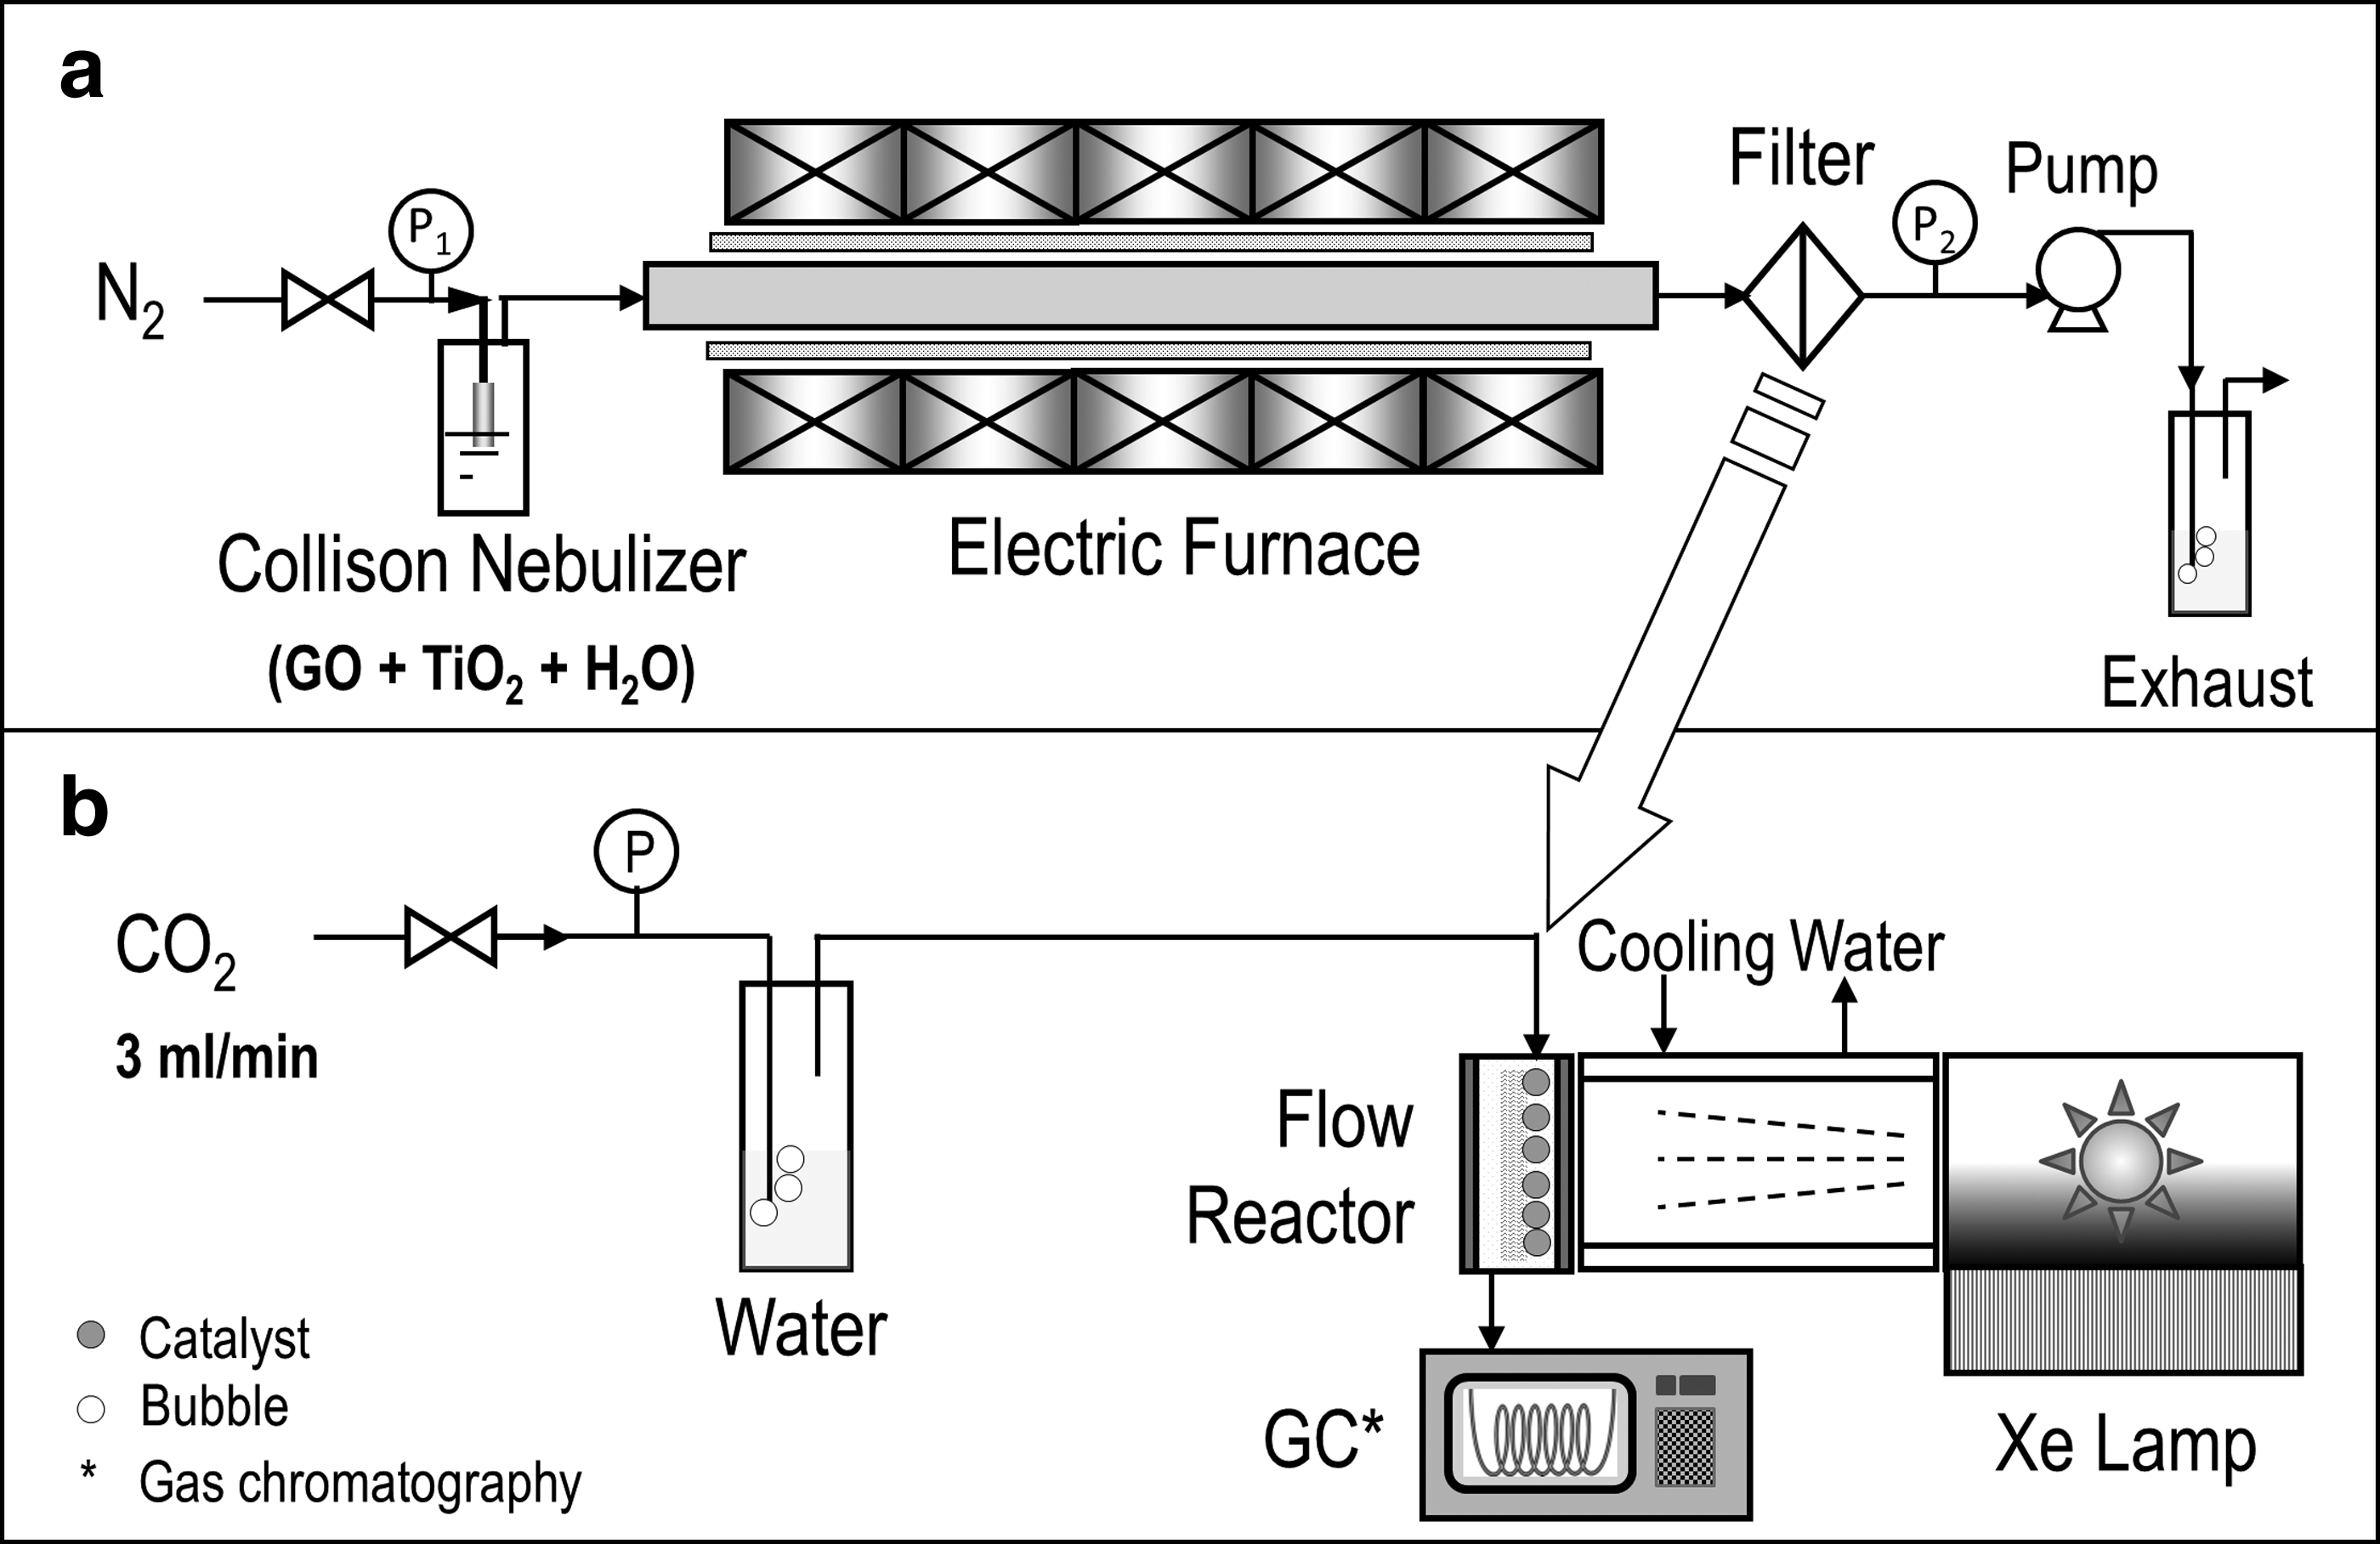
Schematic diagram of experimental setup.
Material characterization
The hydrodynamic particle size and zeta potential of the precursors (aqueous suspensions of TiO2 NPs and GO nanosheets) were measured by a dynamic light scattering (DLS) method using a Zetasizer Nano ZS system (Malvern Instruments Ltd.) with a measurable size range from 0.3 nm to 10 μm. A red laser (λ=633 nm) was used as the light source with a scattering angle of 90°. The morphology of product particles (dry nanocomposites) were examined using field emission scanning electron microscopy (Nova NanoSEM 230, FEI Co.) operated at 10 kV. The inner structure of the films was analyzed by transmission electron microscopy (TEM; Tecnai™ G2 Spirit, FEI Co.). Surface properties were analyzed by a Laser Raman spectrometer (Kaiser HoloLab 5000) with a laser wavelength of 520 nm. Five points of each sample were analyzed, and the average intensities were used as final results.
CO2 photoreduction analysis
The photoreduction analysis system was detailed in our previous papers (Wang et al., 2011, 2012a) and is briefly described here (Fig. 1b). Compressed CO2 gas was used as the carbon source. It passed through a water bubbler and generated a mixture of CO2 and water vapor. The gaseous mixture was then fed into a continuous flow reactor in which the photocatalysts were loaded. The reactor is cylindrical in shape with a quartz window vertically facing the light source, which is a xenon (Xe) lamp operated at 450 W with an accumulated intensity of 19.6 mW/cm2 in the effective UV range (250–388 nm). Before each test, the reactor loaded with samples was first purged with CO2 and water vapor at 100 mL/min for 1 h and then, the flow rate was reduced and maintained at 3 mL/min during the test. The concentrations of effluent gases as a function of irradiation time were recorded automatically by the gas chromatography (GC) through an automated gas valve, using helium as the carrier gas. The GC was equipped with a PLOT capillary column (Supelco Car-boxen-1010) and a thermal conductivity detector. To rule out the possibility of carbon contamination in the system, a series of blank tests were performed under N2 atmosphere (without using CO2 as the source gas), with CO/CH4 detection and CO2 evolution from the nanocomposites with different TiO2 loadings prepared at various synthesis temperatures.
Results and Discussion
As mentioned earlier, the precursors for the described nanocomposites were made by mixing GO nanosheets and TiO2 NPs in DI water at predetermined ratios. The as-prepared mixtures were then characterized by the DLS method to get information of particle size and zeta potential, and the results are summarized in Table 1. From the table, the hydrodynamic size was found to increase significantly with TiO2 percentages, indicating the agglomeration of the two components. This is due to the electrostatic interaction between TiO2 NPs and GO nanosheets, as both of them carry charges. This is also confirmed by the fact that the zeta potential of the mixture slightly decreases with an increase in TiO2 percentage, which could be considered a result of partial neutralization. It is also seen from Table 1 that the polydispersity index fluctuates when the TiO2 percentage increases, indicating the decreased stability of the mixture. However, the absolute values of the zeta potentials are still high enough to ensure the stability of the mixture for several days.
GO mass concentration was fixed at 0.54 mg/mL, which was determined by UV-VIS measurements (Wang et al., 2012b).
PDI, the polydispersity index, a dimensionless measure of the broadness of the size distribution (ISO 13321, 1996); GO, graphene oxide; TiO2, titania.
The precursor was then used for preparation of the GO-TiO2 nanocomposites by the FuAR method. Typical TEM images of the nanocomposites with different TiO2 percentages, that is, 5, 10, and 20 wt%, are shown in Fig. 2. It is apparent that most TiO2 NPs were encapsulated well within the crumpled GO structure when the TiO2 content was low (e.g., 5 wt%; Fig. 2a). More free TiO2 NPs were found outside the crumpled rGO structure when the percentage increased. In the case of 20 wt% TiO2, TiO2 NPs are mostly observed while the GO nanosheets are almost not visible (Fig. 2c). As shown in Table 1 and from our previous research (Wang et al., 2012b), the size of the GO nanosheets is around several 100 nm. It implies that only a certain fraction (upper limit) of TiO2 NPs could be encapsulated into the crumpled ball. To avoid the interference of free TiO2 NPs in the structure, nanocomposites with 5 wt% TiO2 were prepared at different temperatures from 200°C to 1000°C, to investigate the thermal impact on the nanocomposites, in particular the thermal reduction ratios of these nanocomposites, which could significantly influence the subsequent CO2 photoreduction efficiency.

Transmission electron microscopy (TEM) images of reduced graphene oxide (rGO)–titania (TiO2) nanocomposites with different TiO2 weight percentages:
The rGO-TiO2 nanocomposites were then subjected to CO2 photoreduction analysis in the flow reactor as shown in Fig. 1b. To ensure that there is no carbon contamination in the system, two samples with different TiO2 loadings (1 and 5 wt%) prepared at 800°C were irradiated by the Xe lamp for 8 h by using N2, instead of CO2, as the source gas. The results are plotted in Supplementary Figure S1; neither CO nor CH4 was detected, indicating that the system is free of carbon contamination. In addition, CO2 evolution of the rGO-TiO2 samples prepared at lower synthesis temperatures (200°C, 400°C, and 500°C) was also investigated under an N2 atmosphere. As demonstrated in Supplementary Fig. S2, an increase in CO2 concentration for some samples was observed due to the removal of functional groups from the GO surfaces. However, the maximum CO2 concentration was only about 3% of the baseline of CO2 flow (3 mL/min). Further, no CO2 photoreduction product (i.e., CO or CH4) was observed for these samples. This indicates that the CO2 generated from the simultaneous photoreduction of GO nanosheets negligibly contributed to CO2 photoreduction. Therefore, any reduction product in the subsequent photoreduction analyses should be from the CO2 source gas that was converted by the photocatalysts.
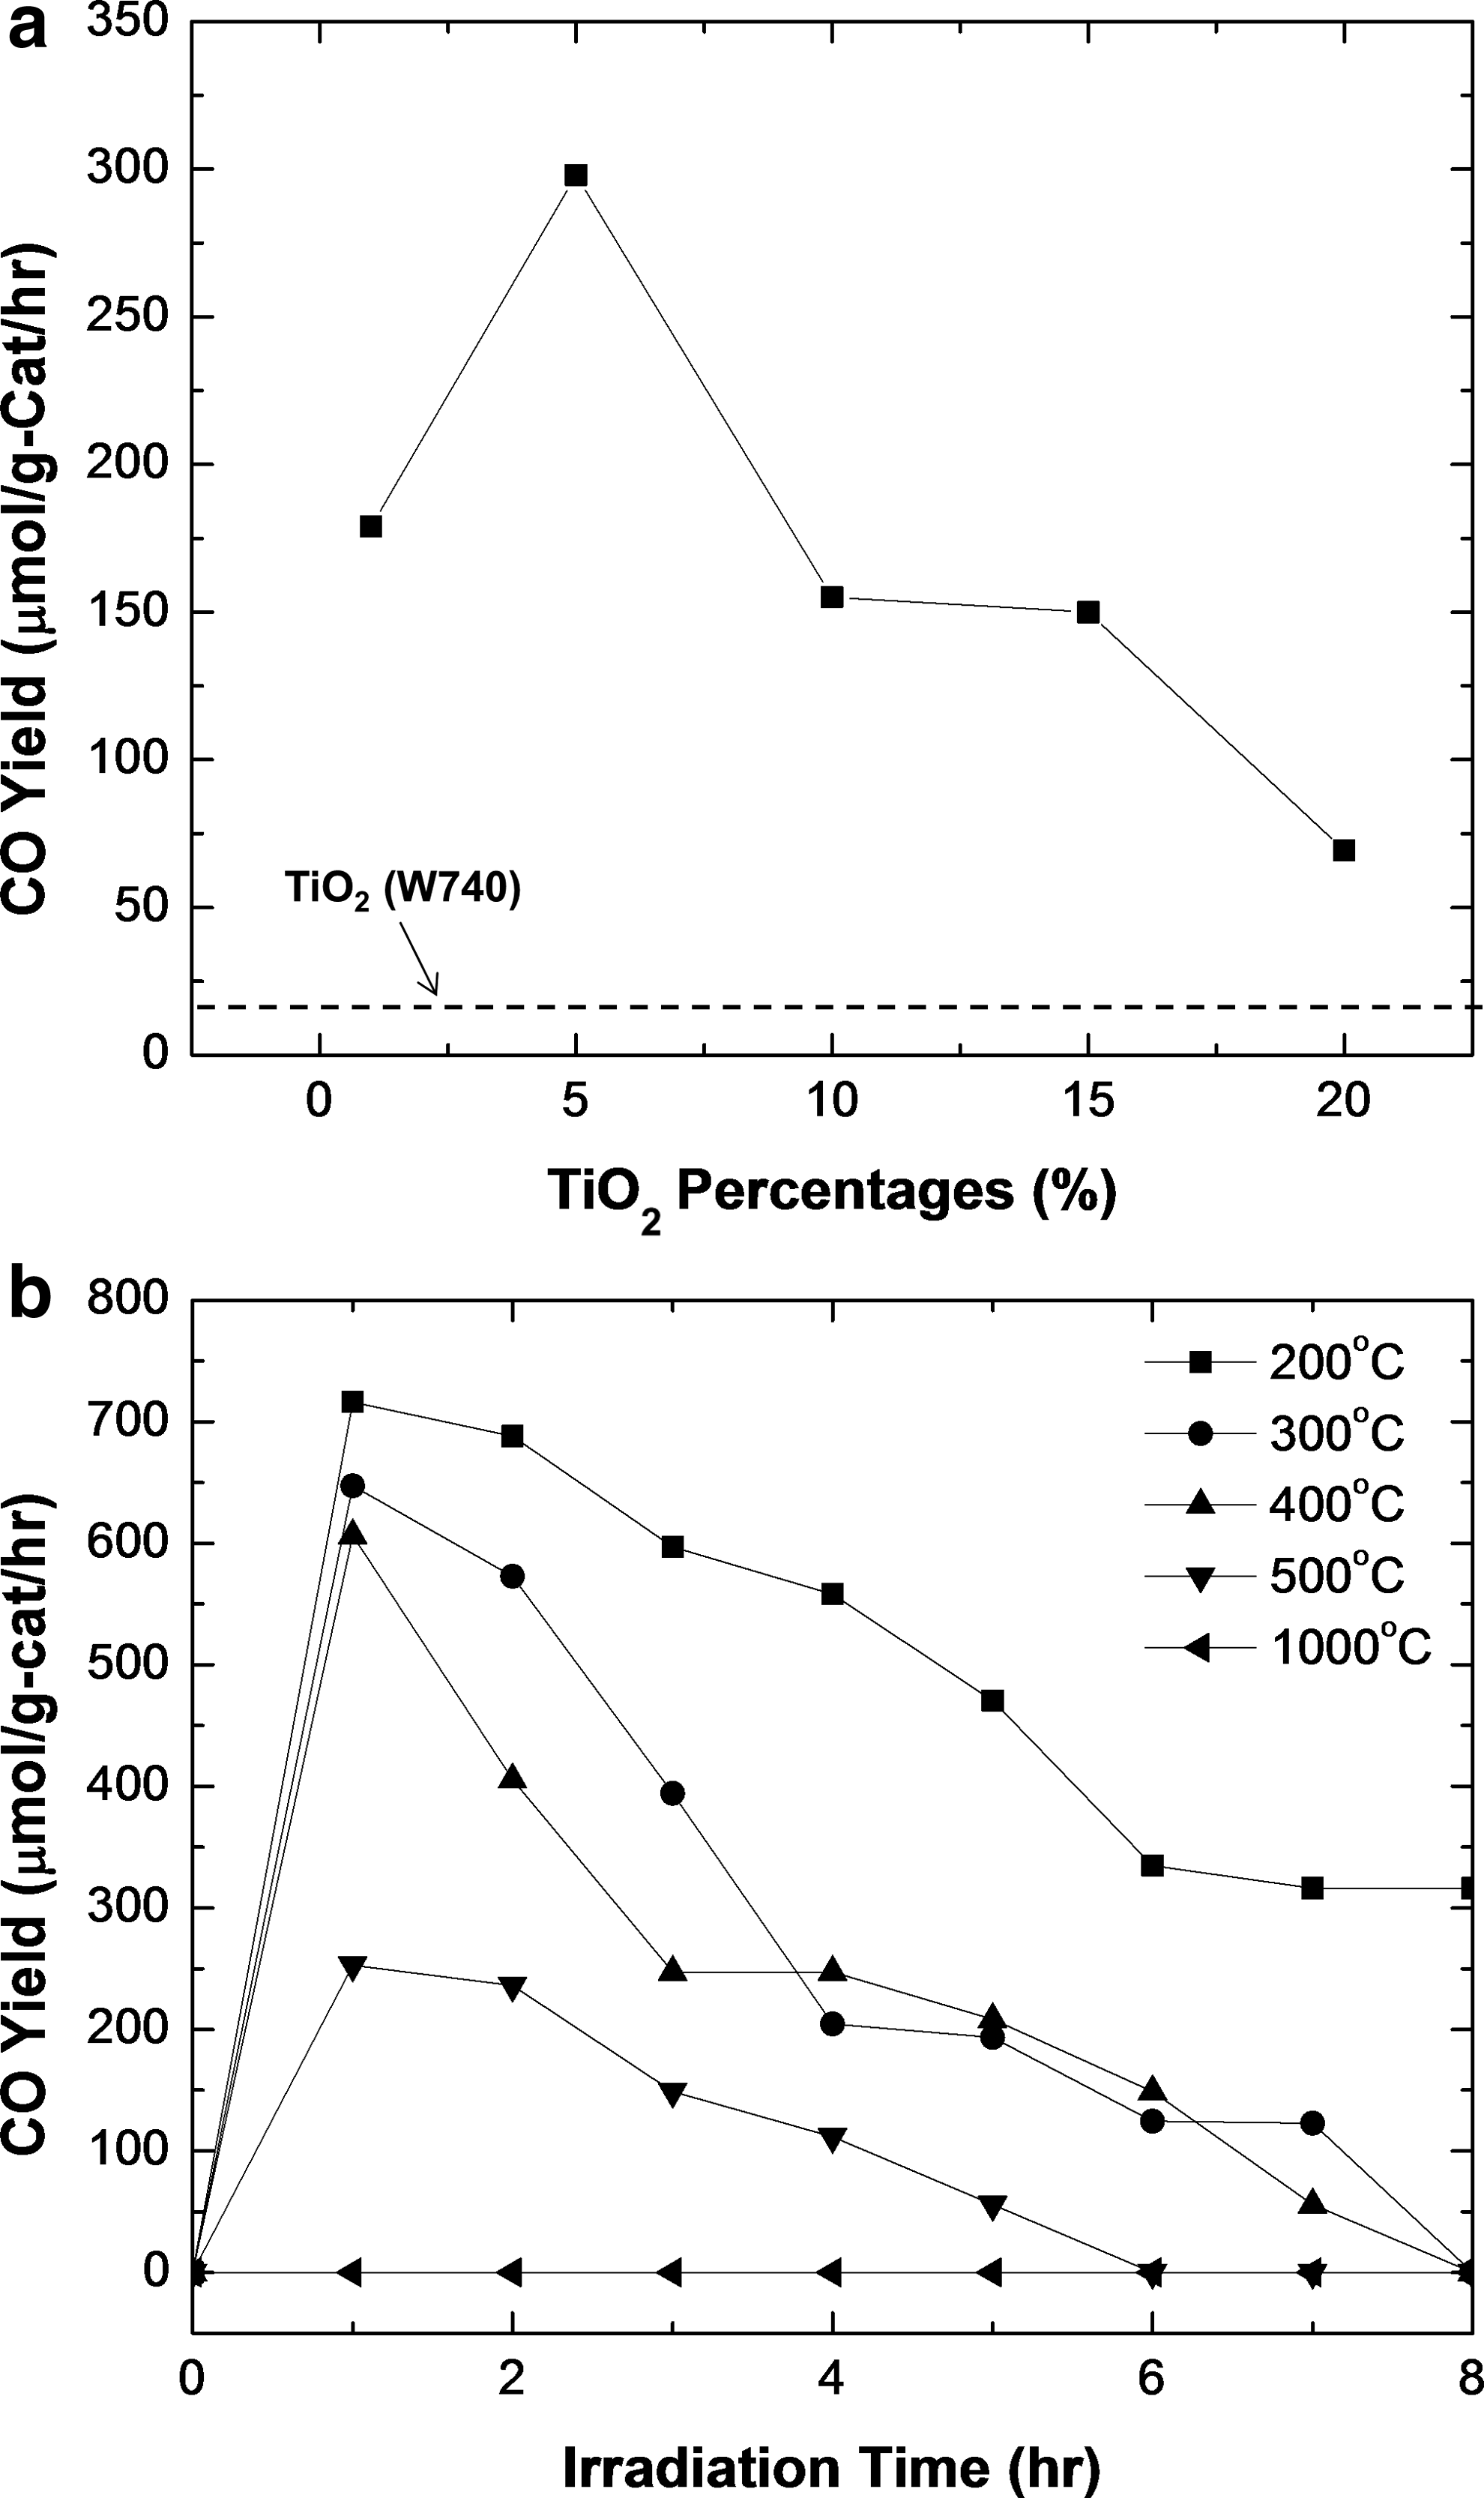
The CO2 photoreduction results for nanocomposites synthesized with different TiO2 percentages and at different temperatures are plotted in Fig. 3. In most cases, CO2 was successfully reduced to CO based on the typical two electron-two proton reaction mechanism (CO2+2e−+2H+→CO+H2O) (Wang et al., 2012b). Figure 3a shows the CO yield as a function of TiO2 percentages, where the optimal CO yield was achieved at 5 wt% TiO2 loading. Lower conversion efficiency was achieved at a lower TiO2 percentage, such as 1 wt%, possibly due to less active catalysts available for photoreduction. After reaching the optimal performance at 5 wt%, the CO yield, however, decreases gradually with an increase in TiO2 loading. This is because the increased TiO2 percentage could increase the possibility of more free TiO2 NPs outside the rGO nanosheets as indicated in Fig. 2. Without direct contact with the rGO nanosheets, the e−–h+ lifetime could not be improved as expected. For a 20 wt% TiO2 sample, the CO yield is very close to that of pristine TiO2 NPs. This could be also attributed to the interparticle e−–h+ recombination, which could significantly decrease the CO2 photoreduction performance. CO2 photoreduction results of nanocomposites prepared at 200–1000°C are shown in Fig. 3b. From the figure, it is apparent that nanocomposites prepared at 200°C have the highest CO yield (716 μmol/g-cat per hour). The performance monotonically decreased with an increase in temperature. The sample prepared at 1000°C has almost no function at all. The results suggest that synthesis temperature played an important role in tailoring rGO surface functionality and electron trapping capability, and hence the enhanced CO2 photoreduction performance.
CO2 photoreduction analysis of rGO-TiO2 nanocomposites prepared at different conditions.
It is obvious that the GO nanosheets are reduced to rGO by thermally removing surface functional groups. This is evident from the color of the samples as indicated in the pictures in Fig. 4. At 200°C, the nanocomposites are yellowish (Fig. 4a). The color turned dark brown when the temperature increased to 300°C, and became even darker at 400°C and higher. Black color was observed for the sample prepared at 1000°C, indicating a substantial removal of the surface groups.
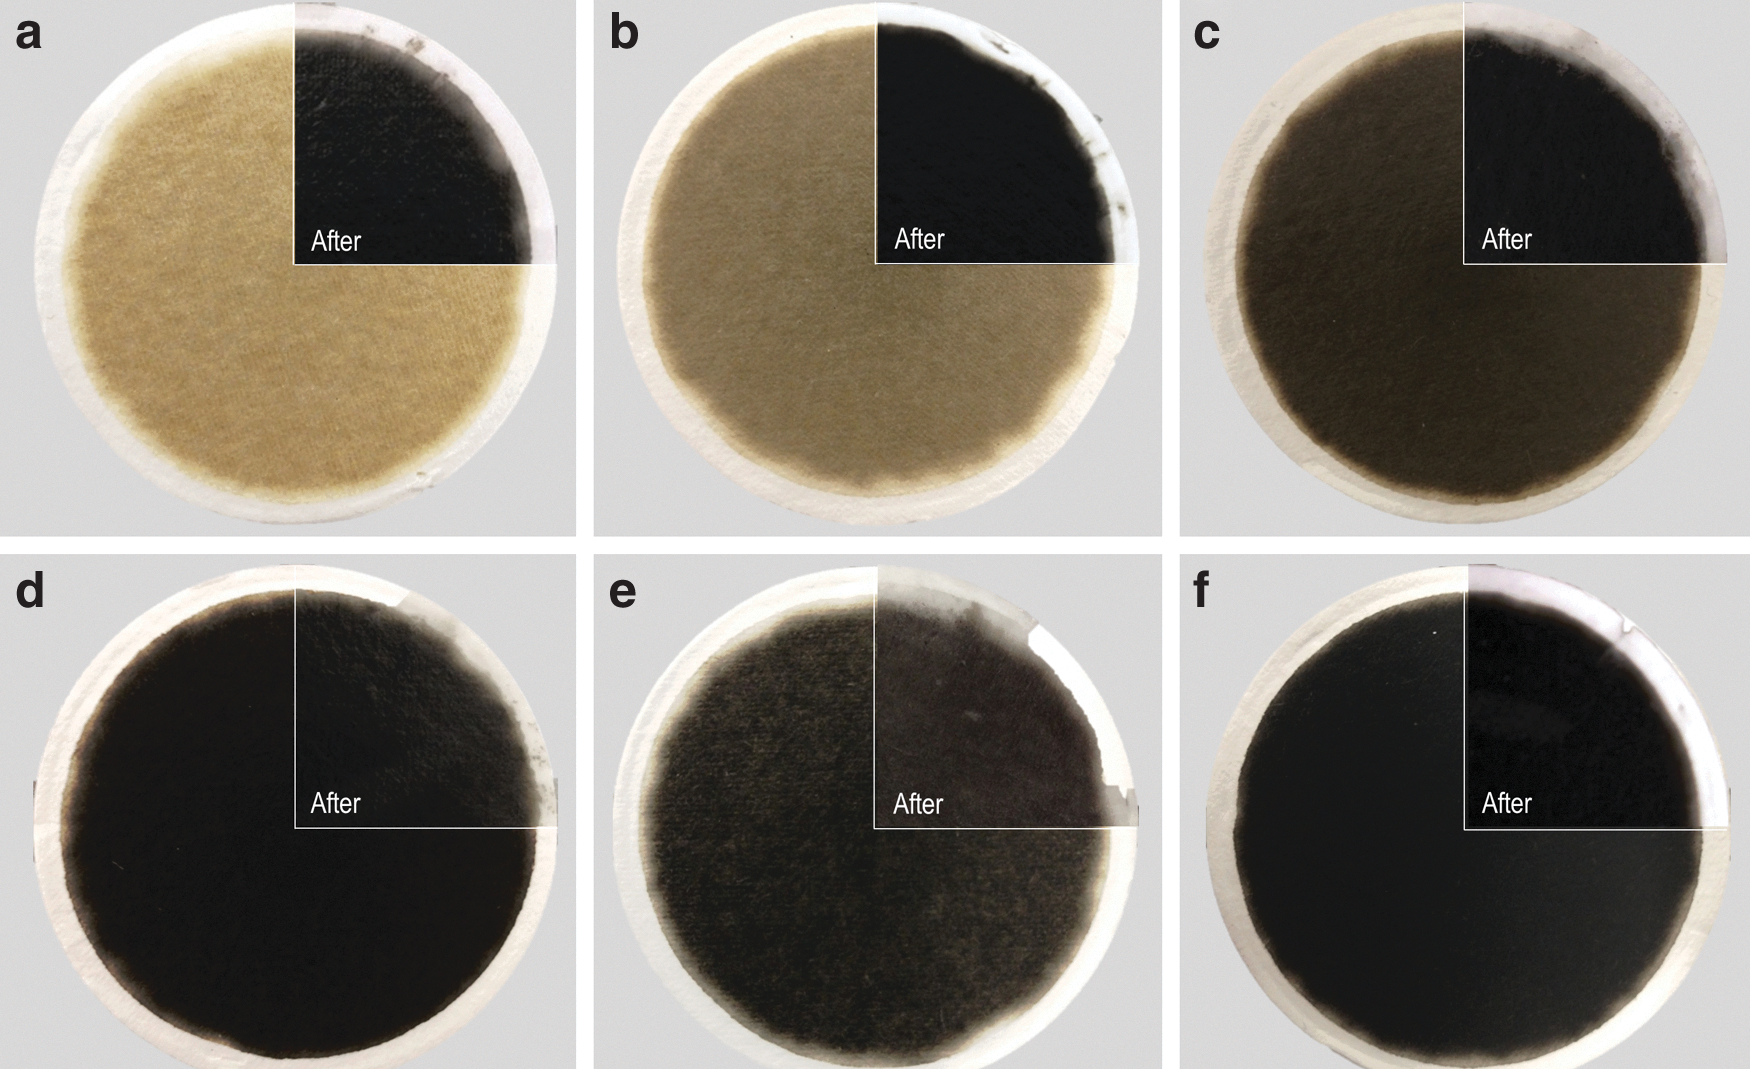
Color change of rGO-TiO2 nanocomposites prepared at different temperatures before and after CO2 photoreduction analysis:
It has been well documented that the conductivity of rGO is much lower than that of pure graphene, as the surface defects created due to the removal of functional groups hindered the charge transfer inside graphene structure (Kamat, 2010, 2011; Ding et al., 2011). This is particularly true for the case of thermal reduction where more surface defects could be created due to violent reactions occurring during thermal removal of surface functional groups, which results in lower conductivity. This could explain why a lower performance was achieved for nanocomposites prepared at higher synthesis temperatures. Meanwhile, an interesting phenomenon of color change after photoreduction was observed. As from Fig. 4, the color of all samples became black after CO2 photoreduction, which implies that the photoreduction of GO to rGO may happen simultaneously with CO2 photoreduction (Kamat, 2010, 2011; Ding et al., 2011).
To test our hypothesis, the CO2 gas was changed to N2 and the three rGO-TiO2 nanocomposites (5 wt% TiO2) prepared at different temperatures were illuminated. The same color change was observed as shown in Fig. 5. All samples turned black after irradiation for 8 h, implying that TiO2 could photoreduce GO nanosheets into rGO. As shown in Supplementary Fig. S2, CO2 evolution was observed but no CO was found from these samples. The simultaneous photoreduction is a softer method as compared with thermal reduction, resulting in less damage and improved performance in conductivity (Ding et al., 2011). Compared with the samples obtained at higher temperatures, the samples prepared at lower temperatures preserved more functional groups and had less surface defects due to thermal reduction. These functional groups were photoreduced and formed rGO, leaving softer surface defects and hence improved electronic conductivity.

Color change of rGO-TiO2 nanocomposites prepared at different temperatures before and after photoreduction analysis under nitrogen:
To verify the surface characteristics of the samples, the nanocomposites before and after CO2 photoreduction were analyzed by Raman spectroscopy, a powerful nondestructive tool to characterize the changes brought about in the electronic structure of GO (Das et al., 2008a, 2008b). Three samples prepared at different temperatures were used, that is, 200, 400, and 800°C. The Raman spectra of these nanocomposites are plotted in Fig. 6. The peaks at 400–650 cm−1 (Liu et al., 2013) can be assigned to TiO2 anatase phase. D and G bands are clearly observed at around 1348 and 1583 cm−1, respectively (Marchand et al., 1982), suggesting that the structure of GO is maintained in the nanocomposites. A small peak at about 2700 cm−1 is also detectable for all three samples, which can be attributed to the 2D band (Das et al., 2008a). The intensities of the Raman spectra of the three samples were normalized at the G band for a comparison of the D/G band ratio. Before photoreduction, it is obvious that 200 and 400°C samples have almost the same spectra and the D and G bands are relatively broad with D/G ratios of 0.967 and 0.987, respectively. The two peaks became more defined at 800°C and the D/G band ratio decreased to 0.924. The decreased D/G ratio indicates the decreased surface functional groups on the rGO surface due to thermal reduction (Marchand et al., 1982; Liu et al., 2013). The same three samples were used for photoreduction by TiO2 NPs as mentioned earlier. The samples prepared at 200 and 400°C demonstrated obvious changes in D band intensity as shown in Fig. 6b. The D/G band ratios of the two samples increased to 1.163 and 1.083, respectively. This is possibly due to the presence of dangling bonds of the sp2 carbon or soft defects created due to photoreduction (Zhang et al., 2013), as more surface functional groups were presented in the lower temperature samples. Both D and G peaks become more defined than those in the 800°C sample, suggesting that the GO has been photocatalytically reduced to rGO and possibly possesses better electronic properties. The 800°C sample did not show obvious changes after photoreduction (D/G ratio=0.938), indicating that the thermal reduction has completely removed its surface functional groups. The defects created due to thermal reduction are permanently present in the structure, which may adversely affect the charge transfer and hence the photocatalytic performance.

Raman spectra of rGO-TiO2 nanocomposites prepared at different temperatures before
Conclusions
rGO-TiO2 nanocomposites were prepared by a single-step aerosol technique. Effects of synthesis temperature and TiO2 percentage were investigated systematically. An optimal TiO2 percentage of 5 wt% was achieved with a maximal CO yield of more than 700 μmol/g-cat/h, which is much higher than that of pristine TiO2 due to the enhanced electron-trapping capability of rGO nanosheets. Nanocomposites synthesized at a lower temperature demonstrate better performance, which indicates that simultaneous photoreduction of GO nanosheets in the CO2 photoreduction process contributes to the enhancement of the CO2 photoreduction performance. It should also be noted that the preparation of these nanocomposites was realized by means of a single-step aerosol method, requiring much less time and energy as compared with traditional thermal or chemical processes. The continuous and scalable manner of this process also ensures the mass production of these nanocomposites for industrial applications.
Footnotes
Acknowledgments
This work was supported by funds from the Lopata Endowment at Washington University in St. Louis. Partial support from the Consortium for Clean Coal Utilization at Washington University in St. Louis is gratefully acknowledged. Electron microscopy work was performed at the Nano Research Facility (NRF) at Washington University in St. Louis, a member of the National Nanotechnology Infrastructure Network (NNIN), supported by the National Science Foundation under Grant no. ECS-0335765.
Author Disclosure Statement
No competing financial interests exist.
References
Supplementary Material
Please find the following supplemental material available below.
For Open Access articles published under a Creative Commons License, all supplemental material carries the same license as the article it is associated with.
For non-Open Access articles published, all supplemental material carries a non-exclusive license, and permission requests for re-use of supplemental material or any part of supplemental material shall be sent directly to the copyright owner as specified in the copyright notice associated with the article.