
Abstract
Abstract
Balancing the risk between microbial and disinfection by-product exposures in potable water through optimization of disinfectant (chlorine) dosing often proves a difficult task in aging urban drinking-water distribution systems (UDWDS). We hypothesized that geocoded pipe characteristics could improve our understanding of chlorine consumption in a city of a geographic region (Eastern Mediterranean) that has been poorly studied. The main objectives of this study were to (1) determine the UDWDS characteristics (household distance from chlorination tank and pipe leaks) that could explain the spatial variability of residual free chlorine, and (2) investigate the association between water microbial counts and residual chlorine in two areas with contrasting pipe network characteristics (low-risk and high-risk; LRA and HRA). We collected water samples from 150 households in two areas of Nicosia, Cyprus, during winter (air temperatures 0–15°C). Household addresses were linked with geocoded pipe network data, on-site residual chlorine levels, trihalomethanes (THM), and microbiological measurements. No significant difference (p>0.05) in the average free residual chlorine levels was observed between the two areas, despite their documented differences in water age. However, the mean THM concentration in HRA (76 μg/L) was significantly (p<0.001) higher than that in LRA (56 μg/L). Each household's distance from the chlorination tank could explain up to 29% of the variability in free residual chlorine levels for LRA, after adjusting for confounders, such as, total bacterial count (TBC) 22°C/37°C, THM, and pipe leaking incidences; this strength of association did not hold for HRA. Pooling data from both areas, a significant (p<0.05) multivariate model of residual chlorine was constructed, with TBC 37°C being the only significant predictor. Water boards with historically low water microbial counts could apply area-specific residual chlorine monitoring and management schemes within their UDWDS to ensure minimization of total THM formation.
Introduction
T
There are a few studies on the association between deficiencies in finished tap water quality and incidences of gastrointestinal (GI) illness. This may be attributed to the fact that GI symptoms (nausea, diarrhea, vomiting, and abdominal pain) are usually mild and last for a few days and only a small percentage of those affected will visit a doctor (Medema et al. 2003; Malm et al. 2013). The famous Payment studies (Payment et al. 1991; 1997) linked GI incidences to the UDWDS of a Canadian city that routinely met all the microbiological water quality standards and did not report water-related outbreaks. Thus, the classical notion that finished water quality in UDWDS is conserved between the point of entry and the point of use has received much consideration. Pipe scales and biofilms coexist in UDWDS serving as sources of chemical release to finished water through poorly understood mechanisms, posing an unaccounted so far risk to consumer health. Pipe-anchored biofilms may also act as sources of microbial release to finished water or as scavengers of added disinfectant chlorine (Edwards et al., 2009; Makris et al., 2013).
The issue of optimizing chlorine dosing to tap water is constrained by confounders, such as season, water age, and pipe characteristics of UDWDS. As a result, residual chlorine levels within the pipe network of an urban center may not be homogeneously distributed across all network points. We hypothesized that spatially resolved, geocoded pipe characteristics and leaking incidences linked with biofilm-induced corrosion events (Makris et al., 2013) and an enhanced DBP formation (Wang et al., 2013b) could improve our understanding of chlorine consumption dynamics. Studies have already demonstrated the influence of water residence time on chlorine demand and the subsequent increase in planktonic microbial counts within the UDWDS (Mahto and Goel, 2008; Srinivasan et al., 2008; Shamsaei et al., 2013).
However, no previous reports exist about the spatially resolved variability of residual chlorine between households and between areas of the same UDWDS in the Eastern Mediterranean region. A cross-sectional study in households of the capital of Cyprus (Nicosia) was initiated, being part of a larger project on human exposure assessment of DBPs (Charisiadis et al., 2014). The present study considered differences in pipe network characteristics, such as the frequency of occurrence of leaking incidences and the household distance from the water chlorination tank, as factors that would partially determine an area's susceptibility to altered chlorine consumption dynamics and formed total THM (TTHM) levels.
The classical notion calls for the development of prediction models of planktonic microbial counts in tap water as a function of residual chlorine; this work embarked on a different approach with the development of a prediction model for residual free chlorine, because a multifaceted role of an added disinfectant is anticipated: (1) often considered a proper indicator of the functional status of a UDWDS (Van Briesen et al., 2012), (2) charged with deteriorated organoleptic properties of tap water (odor and smell), and (3) as one of the main precursors of DBP formation. The main objectives of this study were to (1) determine the UDWDS characteristics (household distance from chlorination tank and pipe leaks) that could explain the spatial variability of residual free chlorine concentrations, and (2) investigate the association between microbial counts and residual chlorine concentrations in tap water within households of two areas with contrasting pipe network characteristics.
Methods
Study area
This cross-sectional study focused on two, out of 24 district-metered areas (DMAs) of the city of Nicosia, Cyprus, based on their score of increased risk of elevated pipe leaking incidences (Supplementary Fig. S1). Mains were made out of asbestos cement, while a majority of service lines were made out of PVC or rubber. A hierarchical-based approach was undertaken for evaluating all 24 areas, using selected UDWDS variables that eventually dictated the overall leaking score for each area. Data were collected by the Water Board of Nicosia (WBN) staff during the first half (6 months) of 2011 for the following UDWDS network variables: (1) the pipe length, (2) the number of pipe leaking incidences per 6 months that resulted in observed water loss or reduced water flow/pressure reported by consumers, (3) the number of water meters by district, (4) the average minimum night flow, and (5) the average daily demand (Supplementary Table S1). Sampling was conducted during winter with low air temperatures (average values ranged between 0°C and 15°C) (January to early April 2013).
Two DMAs were selected: a high-risk (HRA) and a low-risk area (LRA). The HRA was named after its higher frequency of pipe leaking incidences and higher average night water flow (indicative of pipe leaking-induced water losses and pipe age) than those for the LRA (Supplementary Table S1). The HRA is an area located in the old city of Nicosia with an older pipe network system compared with the LRA. These two areas received surface water in dams that underwent the same conventional water treatment and chlorination before distribution. The same finished water quality (NOM, pH, etc.) arrives at both water booster chlorination stations, each serving a different area.
Residential addresses were geocoded on GIS maps with a portable geographic position system unit and then linked to digitized boundary maps supplied by the WBN. Water pipe network characteristics coupled with census-based street classification were overlaid by the shape files of households. A common location reference unit was used for all shape files. Shape files for the water THM concentrations for each household were also inserted in the map as a distinct shape file (Supplementary Fig. S2). Using geoprocessing functions of the ArcMap software version 10.0., such as the near distance, proximity, and buffering, we were able to calculate the distances between (1) the sampling point (household) and the nearest water supply tank, where the last dose of chlorination occurs before delivery to the city and (2) the sampling point (household) and the nearest road (considered equivalent to the nearest water distribution service pipe line). Computed distances were further used in the multivariable regression analyses.
Chemical quality of household tap water
Free residual chlorine and general chemical properties
Tap water samples were collected from the kitchen faucet of each one of the 75 participating households in each area. The study was approved by the National Bioethics Committee of Cyprus and written informed consents were obtained for all participating households by their owners/renters. Measurements of free residual chlorine were conducted on-site during our visit at each household using a portable colorimetric meter (photometer MaxiDirect, Lovibond) just before microbiological sampling. The water aliquot was collected after flushing the tap for 1 min and analyzed for free residual chlorine using the DPD, N,N-diethyl-p-phenylenediamine method (APHA, AWWA, and WEF, 2005). The general water quality chemical parameters of the study households are presented in Supplementary Table S2.
Water THM analysis
A modified EPA method 551.1-1 was used for THM analysis in water samples (Charisiadis and Makris, 2014). Briefly, a liquid–liquid extraction was adopted by mixing 15 mL of water sample (spiked with a surrogate solution at a final concentration of 10 μg/L) with 2 mL of t-butyl methyl ether (MTBE), adding 6.0 g of sodium sulfate to saturate the water sample and shaking gently for 5 min in a laboratory shaker at 100 rpm. About 0.5 mL of the organic phase was transferred in a vial, containing an internal standard solution at a final concentration of 200 μg/L. Gas chromatography (Agilent 7890A) coupled with an Agilent 7000B triple quadruple (GC-MS/MS) system was used, while analyte separation was achieved with a 30 m×0.25 mm×0.25 μm HP 5MS (5%-phenyl-methylpolysiloxane) column from Agilent. The sample injection volume was 1 μL. Electron impact (EI) ionization was performed at electron energy of 70 eV. MS/MS was performed in the MRM mode and the quadruple mass detector was operated at 150°C. The ion source temperature was set to 250°C, and the transfer line was set to 250°C. The column oven temperature program was set to 30°C for 5 min, 150°C for 2 min with 60°C/min, 180°C for 0.1 min with 30°C/min, and 300°C for 1.0 min with 50°C/min. The carrier gas was helium at 1 mL/min. The peaks were identified on the basis of their fragmentation patterns using the NIST Mass Spectral search program.
Microbiological quality of household tap water
Allowing for 1-min flushing that was proven adequate for sampling water from the distribution system with respect to THM analyses, water sampling for microbiological analyses at the main faucet was conducted using clean sterile plastic (sodium thiosulfate containing) bottles. Attached devices and inserts were removed from the tap before sampling and disinfected with ethanol and flaming. Samples were immediately cooled at 5°C±3°C (using ice packs) and protected from sunlight during transportation. The time between sampling and analysis in the laboratory was as short as possible as the samples should be analyzed within 24 h after sampling.
Total bacteria counts
Water samples were mixed well by hand and one mL of each was dispensed onto an empty Petri dish to conduct the total bacterial count (TBC) analysis. About 20 mL of yeast extract agar (set at 45°C) was added to each Petri dish and carefully mixed (ISO 6222, 1999). The agar was incubated at 37°C for 44±4 h and 22°C for 68±4 h (ISO 6222, 1999), followed by colony counting.
Enumeration of Escherichia coli and coliform bacteria
Coliform bacteria and E. coli are indicators of fecal contamination. The kit of Colilert®-18/Quanti-Tray® (IDEXX) was employed here, growing target organisms in a liquid medium and calculating the most probable number of organisms (ISO 9308/2, 2012). The Colilert medium was added to a 100 mL sample, mixed, and stood still for a few minutes. Then, the sample was added to the sterile tray and incubated at 35°C±0.5°C for 18–22 h. After incubation, yellow wells were counted as coliforms and yellow fluorescing wells as E. coli. A number was determined from the related MPN tables (ISO 9308/2, 2012).
Membrane filtration method
The membrane filtration method for the detection of fecal streptococci and Pseudomonas aeruginosa is conducted using a Millipore apparatus for the filtration of 100 mL of water sample (using a 0.45 μm membrane and a sterile funnel). Using sterile forceps, the membrane filter was placed onto a Slanetz and Bartley (S&B) Petri medium and incubated for 48 h at 37°C. We did not have any samples positive for fecal streptococci with typical maroon colored colonies, so we did not transfer any membrane with the suspected colonies on a Bile-aesculin-azide agar medium (ISO 7899/2, 2000).
After membrane filtration, the membrane filter was placed onto the Pseudomonas CN agar containing centrimide and nalidixic acid (for incubation for 44±4 h at 37°C). After incubation, all colonies that produced blue/green (pyocyanin) color and fluorescent under the UV light were counted as confirmed P. aeruginosa and all nonpyocyanin-producing colonies that fluoresce were classified as suspected P. aeruginosa. Their identity was confirmed using the oxidase test, using an acetamide broth. Positive samples gave production of ammonia and a brick red precipitate. In addition, all other reddish brown pigmented colonies that do not fluoresce were counted as suspected P. aeruginosa and their identity was confirmed using the oxidase test, acetamide broth, and King's B media (ISO 16266, 2006).
Statistical analyses
According to the Shapiro–Wilk's W-test, free residual chlorine and water THM concentrations were normally distributed for both areas, while the rest of the variables were logarithmically transformed before proceeding with correlation and regression analyses. Based on the normality of the tested variables, correlations were calculated using either Pearson's or Spearman's correlation coefficients. The relationship between microbiological indicators, geocoding indicators of distance metrics between houses and the chlorination tank, and free residual chlorine levels was modeled with the use of linear multivariate regression. Multivariate regression models (stepwise backward elimination of selected variables) were constructed for free residual chlorine levels as a dependent and continuous variable. Significant associations of UDWDS variables with residual chlorine were identified and adjusted in deriving at a final multivariate model accounting for possible confounders. Statistical analyses were performed using JMP (SAS, Inc.) and all tests were two sided with p<0.05 considered statistically significant.
Results
Water distribution pipe network characteristics
After the conventional treatment and chlorination at the water treatment plant, the finished water arrives at both water booster chlorination stations, each serving a different area, but characterized by the same water quality with respect to pH, NOM, and anionic composition (halogens) (Supplementary Table S2). Within each water booster chlorination tank, the finished water is dosed again with sodium hypochlorite before its distribution to the two areas (HRA and LRA). The mean age of water traveling from the outflow of each chlorination tank to the entrance of the distribution network of LRA and HRA was measured with EPANET software to be 4 and 14 h, respectively. Household distances to their respective water chlorination tank varied widely in the two areas with a median distance of 5.8 km in HRA versus 3.5 km in LRA, corroborating the estimates of water age (Table 1). Nearly three times higher number of household water meters was present in LRA than HRA, while leaking incidences were higher in service lines than in main pipes for both areas (Supplementary Figs. S1 and S2). The reported number of pipe leaking incidences to the nearest pipe for each household during a monitoring period of 6 months ranged from none to 30 in HRA, being significantly (p<0.001) higher than those observed for LRA (ranging from 0 to 1) (Table 1).
Numbers in parentheses denote the number of households corresponding to the percentile values of a respective variable.
Refers to a period of 6 months of reporting.
LRA, low-risk area; HRA, high-risk area; TC, total coliforms; EC, Escherichia coli; FS, Enterococcus faecalis; PA, Pseudomonas aeruginosa; TBC, total bacteria count (at 22°C or 37°C); THM, trihalomethanes; TTHM, total THM.
Microbial and chemical quality of household tap water
A total of eight and five households exhibited total bacteria counts (TBC) at 22°C being >100 CFU/mL for HRA and LRA, respectively, while ten and six samples showed TBC at 37°C >100 CFU/mL for HRA and LRA, respectively (Table 1). No significant (p>0.05) difference in the mean TBC 22°C and TBC 37°C was observed between the two studied areas (Table 2). No enterococci (FS) or E. coli (EC) were detected in tap water of participating households, indicating the absence of external contamination (Table 1). Six samples/households in the HRA (out of 75) and four households in the LRA (out of 75) contained total coliforms (TC) in their tap water. Much higher TC counts were observed in the HRA (up to 53 counts/100 mL) than those of LRA (up to 1 count/100 mL), although of no significant difference (p>0.05) (Table 2). Similarly, tap water from seven households in the HRA and two households in the LRA contained P. aeruginosa (PA), although much higher PA counts were observed in the HRA (up to 100 counts/100 mL) than those of LRA (up to 2 counts/100 mL).
Values are presented as mean (standard deviation).
p<0.1; ***p<0.001.
Residual chlorine and water TTHM concentrations were also measured in the same water samples (n=150 for both areas) where the above-mentioned microbiological analyses were performed. About 10% of households in both areas were characterized by high residual chlorine concentrations (>0.6 mg/L). No significant difference (p>0.05) in the average free residual chlorine levels was observed between the two areas (Table 2), despite their documented differences in water age. A total of 13 and 36 households (equivalent to 10th and 25th percentile, respectively) had residual chlorine levels <0.08 mg/L and 0.22 mg/L, and proportionally higher TBC 37°C counts (p<0.001 and p<0.01, respectively); this trend remained significant at the 90% confidence level (p<0.1) for 71 households with residual chlorine <0.3 mg/L (<50th percentile) and nonsignificant (p>0.1) at higher percentiles. However, the mean TTHM concentration in HRA (76 μg/L) was significantly (p<0.001) higher than that in LRA (56 μg/L), suggesting that residual chlorine levels alone cannot be solely held responsible for the formation of THM. The TTHM levels for most households were well within the maximum contaminant level of 100 μg/L, according to the EU 98/83 directive (European Council Directive 98/83/EC, 1998). A small number of households deviated from the maximum permitted value (3 households in LRA and 13 households in HRA had TTHM levels >100 μg/L).
Fluctuations in residual free chlorine: associations and variability
Significant (p<0.05) negative associations were observed between the free residual chlorine levels and distances to the chlorination tank (Fig. 1), water TTHM (Supplementary Table S3), TBC 37°C (Supplementary Table S3) for households in LRA, but no correlation between the same variables was shown for HRA households (Fig. 1 and Supplementary Table S3). Pooling data from both areas, TBC 37°C showed a negative significant (p<0.001) association with residual chlorine levels (Fig. 2). However, no such association was observed with TBC 22°C (Supplementary Table S3). Positive significant (p<0.001) correlations were observed between the water TTHM levels and distance from the chlorination tank and also with the number of leaking incidences (data not shown). No significant (p>0.05) correlation was observed between free residual chlorine levels and various physical (distance from chlorination tank), chemical (TTHM), or microbiological variables (TBC) for water samples collected from the HRA (Figs. 1 and 2; Supplementary Table S3).
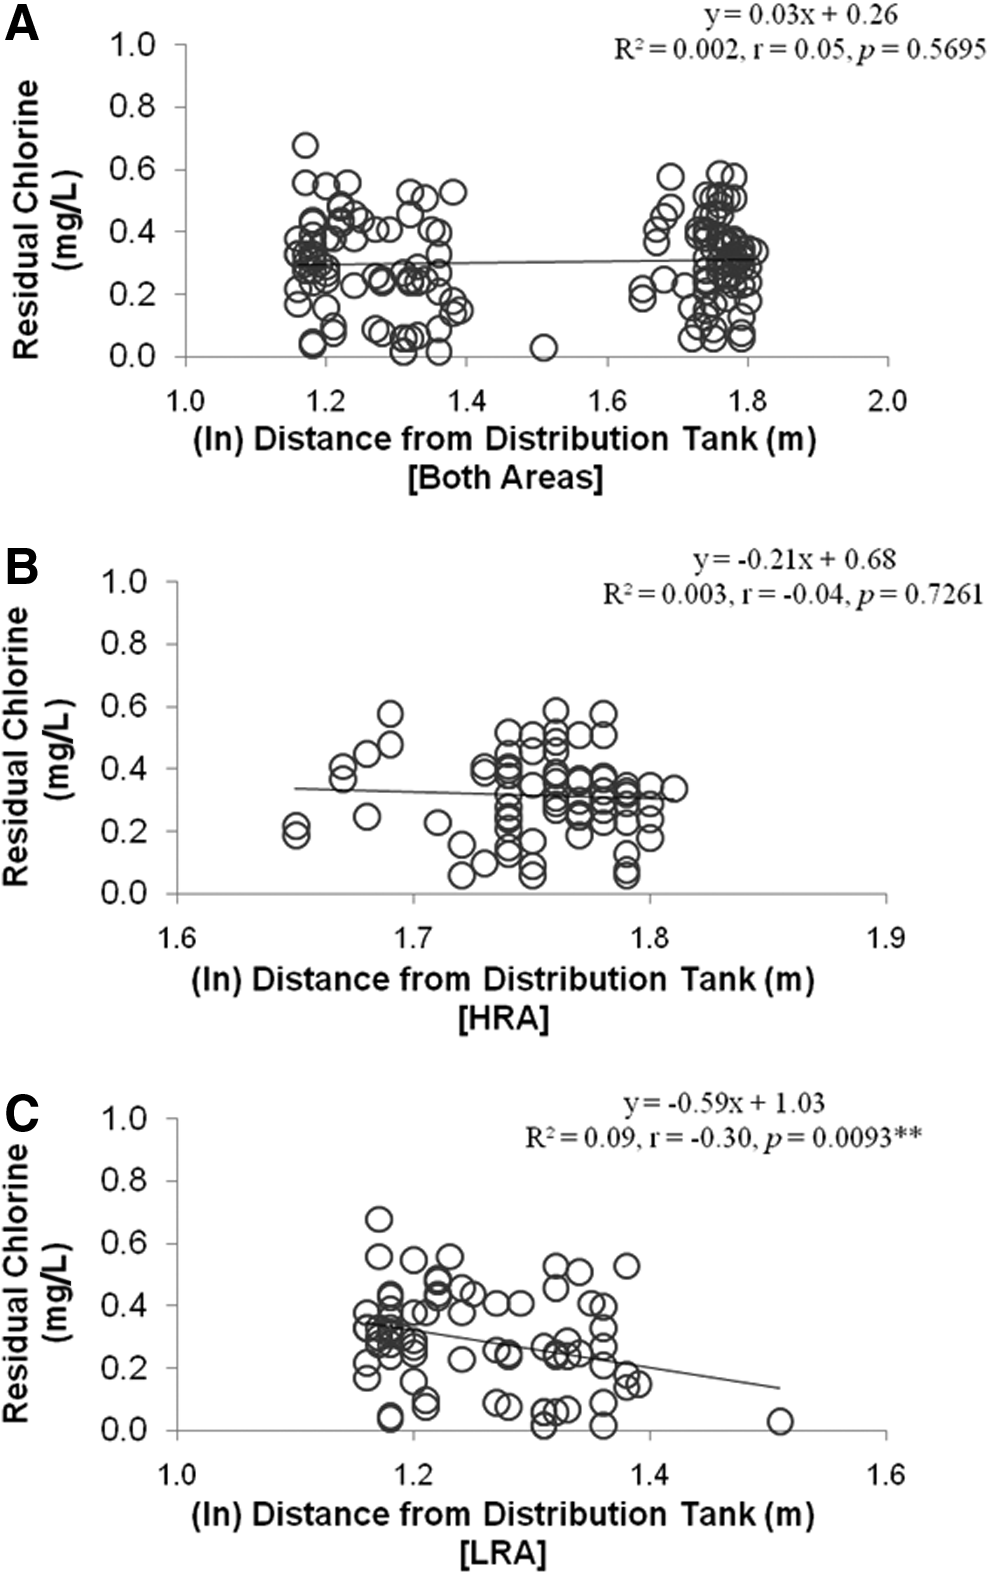
Relationship between household distances from the water storage tank and residual chlorine levels in the kitchen tap water of each household:
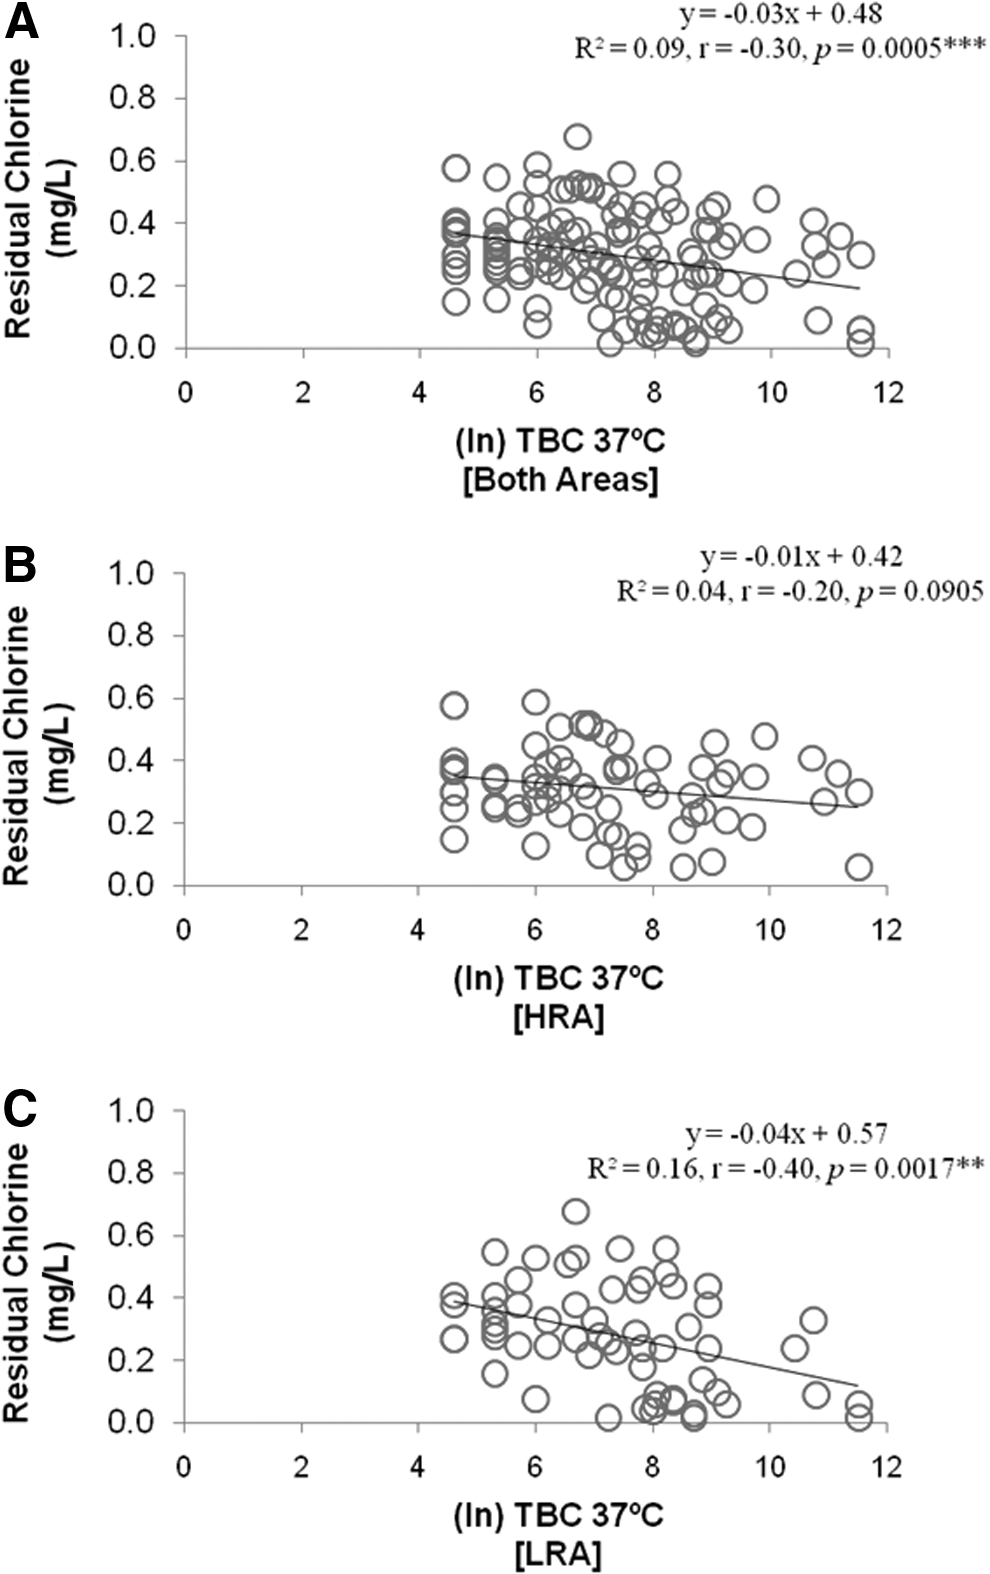
Relationship between TBC 37°C and residual chlorine levels in the kitchen tap water of each participating household:
A set of microbiological, chemical, and physical predictors was considered to model fluctuations in free residual chlorine levels for both areas (Table 3). The household distance from the chlorination tank could explain up to 29% of the variability in free residual chlorine levels for the LRA, even after adjusting for possible confounders, such as TBC 22°C, 37°C, water TTHM levels, and pipe leaking incidences; this strength of association did not hold for HRA households. Another significant (p<0.001) model composed of both TBC 37°C and the distance from chlorination tank could explain 21% of the variability in residual chlorine levels for LRA-only households. In the case of pooling data from both areas, a significant (p<0.05) linear multivariate model of free residual chlorine was constructed with TBC 37°C being the only significant predictor. No significant multivariate model of free residual chlorine was developed for HRA, despite that TBC 37°C was a marginally significant predictor of residual chlorine (Model 1: p=0.08; Model 2: p=0.04).
“-” denotes variables excluded from models.
p<0.1; *p<0.05; **p<0.01; ***p<0.001.
Discussion
This study was out to improve our understanding of the spatial variability in residual free chlorine concentrations within DMAs of a single UDWDS in a city of a geographic region (Eastern Mediterranean) that has been poorly studied. A spatially resolved large dataset (n=150 household-sampling points) scattered within a UDWDS was used in our experimental design, and it is the first reported study in an Eastern Mediterranean city that attempts to predict residual free chlorine dynamics based on pipe leaking incidences and distance of geocoded households from water chlorination tanks. As expected, a wide range of free residual chlorine levels was indeed observed in both study areas.
The total bacterial count at 37°C was a significant (p<0.001) predictor of residual free chlorine levels in both areas of the studied UDWDS, even after adjusting for several covariates, such as water THM and pipe structural characteristics (leaking incidences and distance from the chlorination tank). This trend was primarily evident in LRA, explaining ∼30% of the variability in free chlorine levels of LRA households, and only 11% in HRA households. Egorov et al. (2002) demonstrated an association between low levels of residual chlorine, higher total plate counts at 37°C, and increased risk of GI illness after adjusting for potential confounders such as socioeconomic, demographic, and behavioral characteristics. Such a use of TBC 37°C as a predictor of disinfectant consumption could be of value in the UDWDS with routinely low microbial counts, allowing for optimization of residual disinfectant to the benefit of controlling the TTHM formation potential and chlorine-related odors. Indeed, TBC 37°C data are usually considered as an early indicator of microbiological water quality deterioration in an UDWDS, before observing noticeable changes in coliform bacteria (for a review, see Chowdhury, 2012). Fluctuations in TBC 37°C may also provide information about the spatiotemporal patterns of microbiological risks in tap water (WHO, 2003). No similar associations and trends between TBC 22°C and residual chlorine were observed in this study. The significant association between residual chlorine and TBC 37°C and not with TBC 22°C may not be the result of sampling water from the premise plumbing piped system during our sampling campaign, because the water sampled was proven to be the water from the distribution network; in effect, experiments conducted in different kitchen faucets consistently showed that TTHM levels in tap water remained unchanged with flushing time increased up to 15 min at high flow rates (Supplementary Fig. S4).
Within LRA, a highly (p<0.01) significant association of the distance from the chlorination tank and residual free chlorine levels was observed even after adjusting for important confounder variables (Table 3), while a weak significant (p=0.069) increase in TBC 37°C was observed with the distance of households from the chlorination tank (Supplementary Fig. S3). In parallel, TBC 37°C was inversely correlated (p<0.001) with residual chlorine in tap water sampled from LRA households. This could be partially attributed to the fact that chlorine use is influenced by the distance water travels in a distribution network (Al-Jasser, 2007) and by the pipe age (Al-Jasser, 2011). Differences in the reaction time of free chlorine with numerous moieties of natural organic matter during water transit could result in spatial variations in water quality variables of microbial (Gagnon et al., 2004) and chemical nature (Brown et al., 2011). Upon reaching the outskirts of LRA, chlorinated water is of little age (about 4h), allowing for adequate disinfectant contact with mains and service pipes near each participating household, because of its frequent replenishment with residual chlorine (little time spent between chlorination tank outflow and the receiving LRA households). The three times larger population residing in LRA (Supplementary Table S1) hints toward a higher water consumption per capita rate that additionally provides for a reduced water residence time within LRA, minimizing water stagnation phenomena and reducing the TTHM water formation potential. On average, the pipe system in LRA is newer compared with HRA, since LRA residences were built during the last couple of decades, while the majority of HRA households were built during the 1950s (personal communication, WBN authorities). The average distance of households in HRA to their chlorination tank was significantly higher (p<0.001) than that for LRA households (Table 2). However, the distance between households was much smaller in HRA compared with LRA, and thus prevented residual chlorine levels from dissipating to a similar LRA fashion. We noticed that the randomly selected HRA households easier formed homogeneous geographic clusters than those in LRA for the following two reasons: (1) the longest distance between households of HRA and LRA was 880 and 1350 meters, respectively, and (2) the coefficient of variation in distance between households was 3.5% and 8.0% for HRA and LRA, respectively. As a result, the effect of residence time or the distance of a household from the chlorination tank on residual chlorine was much dissipated in HRA.
HRA's water age was about 14 h, being about three times higher compared with LRA. No spatial patterns were observed for either residual chlorine or TBC 37°C in the HRA district of this study, suggesting a role of distribution pipe characteristics on water quality. Residual disinfectant within the UDWDS may be consumed upon reaction with either suspended or dissolved natural organic matter or through reactions with pipe materials and biofilm components (Berry et al., 2006). Although nonsignificant, the mean TBC 37°C counts, total coliforms, and P. aeruginosa were higher in tap water from HRA compared with LRA. Compromised structural features of UDWDS promote corrosion and biofilm spread (for a review, see Makris et al., 2013), while the presence of corrosion and biofilm affects chlorine demand and residual chlorine levels (Hu et al., 2005). Chlorine contact with bacterial exo-polymeric biomass of biofilm colonies (Pseudomonas strains) could promote DBP production (Wang et al., 2012). Planktonic cells formed 7–11 times greater mass of TTHM per carbon than that solely attributed to biofilms (Wang et al., 2013a). Moreover, extracellular biopolymeric moieties of pipe-anchored biofilms that typically comprise mixed bacterial species have been recently associated with an elevated TTHM formation potential (Wang et al., 2013b). These reports support our findings on the significantly (p<0.001) higher THM levels in water from HRA households (76 μg/L) compared with those in LRA (56 μg/L). It was further observed that the household distance from the chlorination tank was positively correlated with THM levels (p<0.0001). This is in agreement with a previous water quality study in a UDWDS reporting a positive association between water residence time, free chlorine consumption, and THM levels (Reckhow and Singer, 1990). The higher free chlorine demand due to structural deficits in the UDWDS of HRA could be held responsible for higher TTHM levels, which in turn might have skewed the spatial association between residual chlorine and TBC 37°C counts.
Typical limitations of our cross-sectional study were the following: (1) different water chlorination tanks for each area, resulting in differences in the initial disinfectant concentrations at the outflow of each chlorination tank. Mean measured residual free chlorine concentrations at the outflow of each chlorination tank of LRA and HRA were 0.45 and 0.33 mg/L, respectively. Therefore, the measured residual chlorine concentrations in each sampled household were also a function of the outflow disinfectant concentration, among other variables. It was speculated that the temporal variability observed during the sampling period (January to early April) could have confounded associations between residual chlorine at the household taps and the distance to the chlorination tank. In effect, water temperature could also vary during the relatively long sampling period. The use of microbial indicators as dependent variables in multivariate regression and residual chlorine as a predictor has been typically practiced in the literature; instead, we used free residual chlorine as the dependent variable, because the focus of this study was to evaluate the contribution of chemical, microbiological, and pipe structural characteristics on the management and optimization of disinfectant dosing that often serves as a precursor of DBP. Our unconventional approach in using residual disinfectant as the dependent variable in a multivariate regression model may be valid for the low microbial count-based UDWDS, where local water boards face challenges in maintaining residual disinfectant at distant sites and sites impacted by seasonal climatic variations due to climate change; this is the case for cities of the Eastern Mediterranean region. Optimization of an added disinfectant to finished water and the management of disinfectant-level fluctuations within the UDWDS is of utmost importance, because free residual disinfectant (chlorine) is (1) often considered a proper indicator of the functional status of a UDWDS (Van Briesen et al., 2012), (2) charged with deteriorated organoleptic properties of tap water (odor and smell), and (3) one of the main precursors of DBP formation.
Conclusions
Chlorine consumption dynamics are highly variable either as a function of time or space within a single UDWDS. Two DMA within the same UDWDS presented us with contrasting behavior with respect to the interplay between added disinfectant (chlorine), formed DBPs (THM), and measurements of microbial indicators at 150 households from both areas. Residual chlorine levels declined with distance from the chlorination tank in LRA, but not in the HRA households, where >80% of free residual chlorine values was >0.1 mg/L. Generated THM levels were significantly higher in point of use faucets of HRA households, suggesting an enhanced THM formation potential due to deteriorated pipe network conditions.
An important finding of this study is that TBC at 37°C was significantly negatively associated with residual chlorine dynamics even after adjusting for variation in the sampling point distance from the chlorination tank and number of pipe leaking incidences of the nearest pipe line to the sampling point. Water boards in need of optimizing the disinfectant dose in DMAs with different pipe structural properties will greatly benefit from this study's findings. Furthermore, our spatially resolved study using the geocoded pipe system and participating households of two DMAs will also help to better understand the factors that contribute to the observed variability in free residual chlorine levels. Optimization of added disinfectant to finished water and the management of disinfectant level fluctuations within pipe networks is of utmost importance to local water boards.
Future work should entail the assessment of both chemical (both chlorine and THM) and microbiological water quality monitoring at homes during the summer period when microbiological burden is higher and chlorine demand is at its peak. Inclusion of additional DMAs from a single UDWDS is deemed necessary to better capture the influence of pipe structural features and water residence time on the residual disinfectant demand and consumption.
Footnotes
Acknowledgments and Disclaimer
K.C.M. thanks the Cyprus Research Promotion Foundation for funding this study with Structural Funds of the European Commission. The authors are grateful to the Cypriot Operational Program “Sustainable Development and Competitiveness” under the project “Supporting Long-Term Integrity of Finished Water Quality with respect to DBPs Formation in Urban Drinking-Water Distribution Systems” [Project Protocol Number: AEIFORIA/ASTI/0311(BIE)/20]. The authors thank the State General Laboratory of Cyprus for providing their laboratory equipment to fulfill the microbiological analyses. We appreciate help from Dr. Dimitrios Skarlatos and Mr. Vasilis Vamvakousis with GIS analyses (Department of Civil Engineering and Geomatics, Cyprus University of Technology). The observations and speculations in this article represent those of the authors, and do not necessarily reflect the views of the participating organizations, namely, the Cyprus University of Technology and the Water Board of Nicosia.
Author Disclosure Statement
No competing financial interests exist.
References
Supplementary Material
Please find the following supplemental material available below.
For Open Access articles published under a Creative Commons License, all supplemental material carries the same license as the article it is associated with.
For non-Open Access articles published, all supplemental material carries a non-exclusive license, and permission requests for re-use of supplemental material or any part of supplemental material shall be sent directly to the copyright owner as specified in the copyright notice associated with the article.