
Abstract
Abstract
In two-stage anaerobic expanded granular sludge bed (EGSB) reactors, up to one-third of the chemical oxygen demand (COD) content is naturally preacidified in a first stage preacidification (PA) tank and then fed to a second stage digester for conversion to methane. Hydrogen, an intermediate product of the first stage, could be theoretically captured escaping from the PA tank and sent to the digester to biologically convert the carbon dioxide to methane for biogas enhancement. Pilot-scale tests were conducted to assess the impact of introducing hydrogen gas on biogas quality enhancement and substrate removal efficiency in an EGSB digester fed with distillery wastewater at mesophilic temperature (35°C). The amount of hydrogen introduced, 0.15 or 0.30 L/(Lbiogas·day), was less than what could be theoretically captured escaping from the PA tank. Biogas quality was enhanced by ∼10% to 20% and the energy yield increased by ∼33–42% depending on the hydrogen injection rate. COD removal efficiency remained constant at about ∼98% with and without hydrogen. The Monod model maximum substrate removal rate constant slightly increased, while the half-saturation coefficient slightly decreased with the added hydrogen, both indicating that hydrogen injection did not negatively affect substrate removal efficiency or biomass culture stability.
Introduction
A
A more advantageous approach is to enhance the biogas in situ by introducing supplemental gaseous hydrogen into the AD reactor to biologically convert the carbon dioxide to methane, as has been demonstrated by Luo and Angelidaki (2012, 2013). This method is effective as long as the consumption rate by the hydrogen-consuming methanogens is equal to or greater than the combined hydrogen production and injection rate. Otherwise, the reversible equation (1) may shift to the direction of hydrogen consumption and, therefore, lead to the inhibition of volatile fatty acid (VFA) degradation (Siriwongrungson et al., 2007). Equations (1)–(4) show a simple example mechanism for the digestion of a simple and known substrate, ethanol to methane and carbon dioxide.
Luo and Angelidaki (2013) studied in situ hydrogen utilization to enhance the biogas quality in a 1-L continuously stirred tank reactor (CSTR) codigesting solid waste at thermophilic temperature (55°C). They used manure with acidic whey (low pH: 4.5 or lower) to control the increase in pH during the process and found that biogas quality was enhanced up to ∼20% by hydrogen injection. However, further investigation and studies are required for different configurations (such as up-flow reactors) and operational conditions (such as mesophilic) digesting various types of wastes, to employ this idea in scale-up and industrial AD designs. Furthermore, the effect of in situ hydrogen injection on reactor stability and substrate removal efficiency needs to be examined.
Expanded granular sludge bed (EGSB) reactors are modern AD systems becoming extensively employed by industry (Scully et al., 2006; Zhang et al., 2008; Fang et al., 2011a; Fang et al., 2011b; Liu et al., 2012; Zupančič et al., 2012). EGSBs can be considered as a plug-flow reactor (Bhattacharyya and Singh, 2010) designed for low retention times using granular biomass, where soluble substrates diffuse into the granules for digestion. Two-stage EGSBs consist of (1) a fermentation and acidification stage and (2) an acetogenesis and methanogenesis stage. About 20% to 40% of the wastewater will be desirably preacidified in the first stage, and is then transferred to the main reactor for AD.
Hydrogen, an intermediate product of the acidification process [(eq. 1)], may escape from the preacidification (PA) tank (Fig. 1) during stage one, leading to a deficiency of hydrogen gas to react with the carbon dioxide in the main reactor [(eq. 2)]. Capturing the intermediate hydrogen and feeding it into the stage-two digester, along with the liquid recirculation line employed by EGSBs that allow for longer contact between hydrogen and carbon dioxide, should be advantageous over the single stage CSTR employed by Luo and Angelidaki (2012, 2013). The purpose of this study was to investigate the impact of hydrogen addition to a pilot-scale (EGSB) reactor digesting distillery wastewaters at mesophilic temperature (35°C) to enhance the biogas quality. Hydrogen was supplemented to the EGSB in an amount less than could be theoretically captured from the PA tank. Tests were conducted to examine biogas composition for various organic loading rates (OLR) when the reactor operated with either no supplemental hydrogen or with two different flow rates of supplemental hydrogen. Substrate removal kinetics was also compared for each case using the Monod model to assess the impact of hydrogen injection on substrate removal efficiency and biomass culture stability.
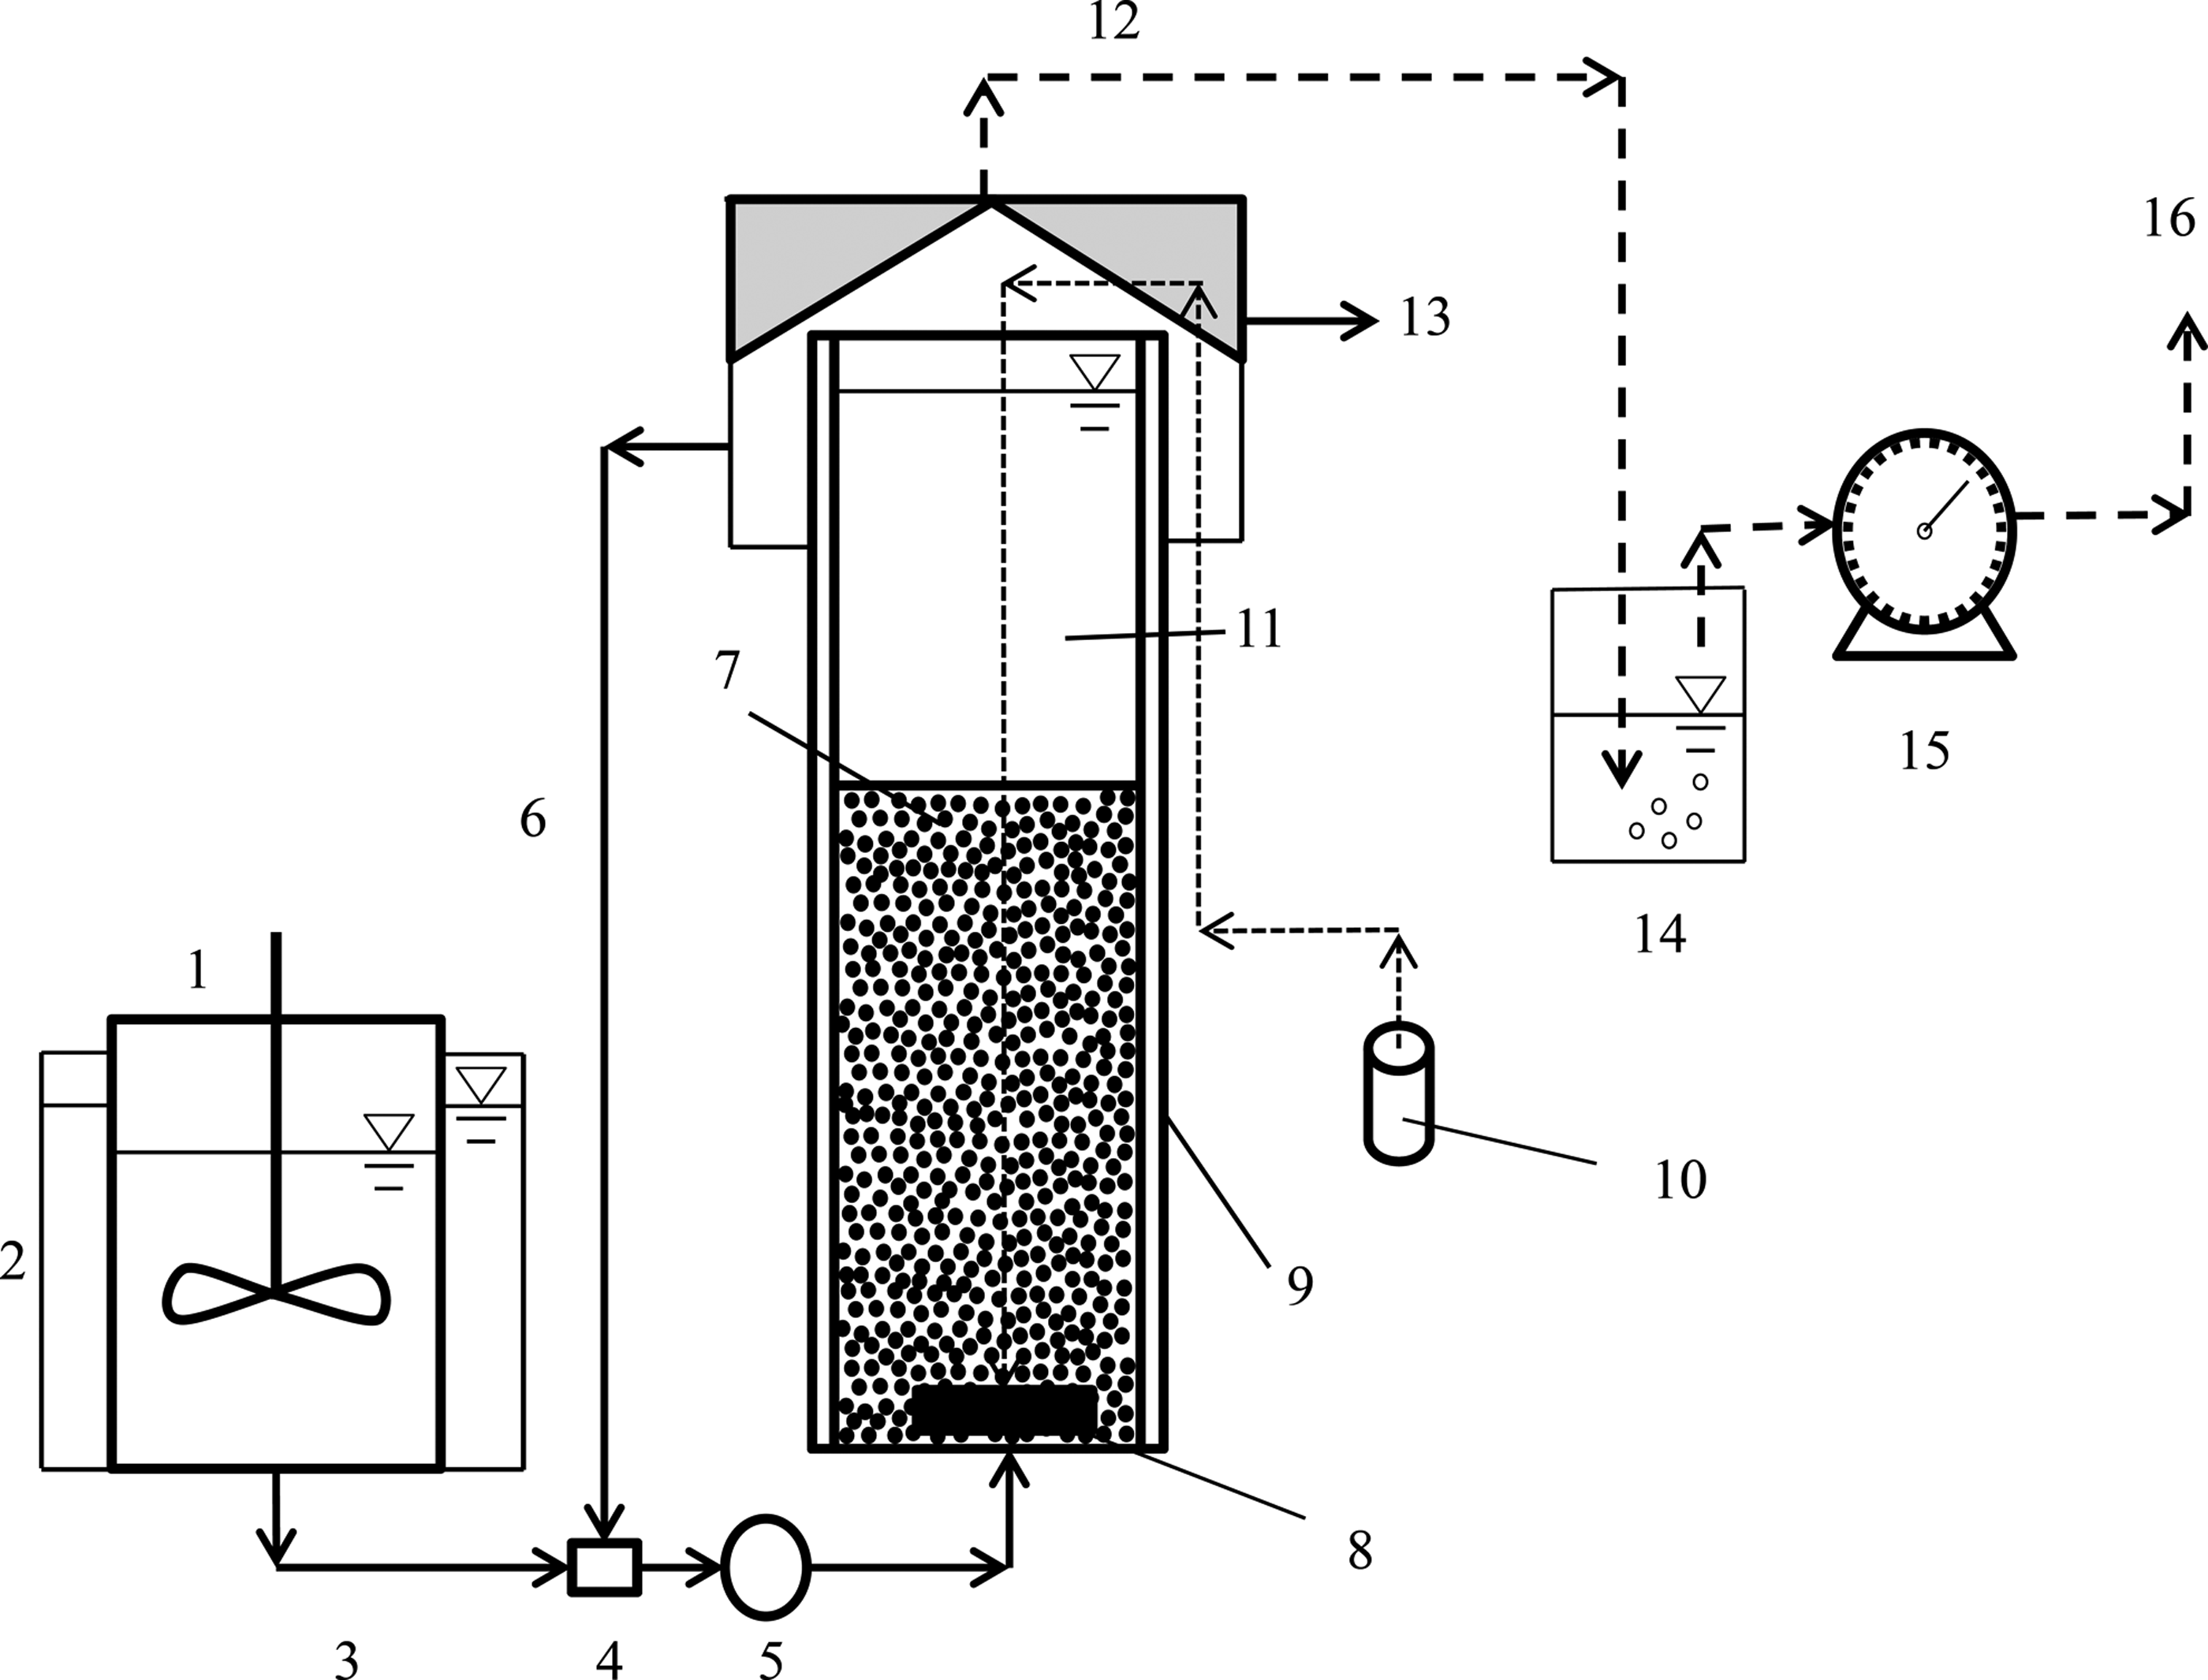
Simple schematic diagram of the two-stage anaerobic expanded granular sludge bed reactor system: 1, Stage-One preacidification tank; 2, heating tank/jacket; 3, feeding line; 4, connection block; 5, pump; 6, recirculation line; 7, granular biomass; 8, gas diffuser; 9, heating jacket; 10, hydrogen gas tank; 11, Stage-Two expanded granular sludge bed (EGSB) digester; 12, produced biogas line; 13, effluent; 14, gas tank transparent; 15, gas meter; 16, exhaust gas.
Materials and Methods
Equipment
AD tests were performed in a two-stage pilot-scale EGSB system (Voith Paper Environmental Solutions GmbH & Co. KG) which has a target chemical oxygen demand (COD) loading of ∼10 g/(L·day). This system processes the wastewater in two stages using two different vessels. During the first stage, the wastewater was loaded in a 45-L (total and working volume) batch PA tank where 20–40% of the COD of the wastewater was preacidified naturally (without adding any reactants). While in the PA tank, the temperature, pH, and nutrient concentrations (nitrogen and phosphorus) were adjusted to the desired mesophilic conditions (temperature of ∼35°C, pH of ∼5.5–7.5, and COD:N:P ratio no more than 350:5:1) (Speece, 1983). The preacidified wastewater from the stage-one PA tank was transferred under anaerobic conditions to the stage-two 60-L (total and working volume) EGSB AD reactor (schematic shown in Fig. 1).
Distillery wastewater samples were characterized before testing for pH, COD, VFA, ammonia, sulfate, phosphorus, and solid content. pH was measured using an Accumet portable meter, model no. AP85. Concentrations of COD, VFA, ammonia, sulfide, and phosphorus were measured by colorimetry using a spectrophotometer (Hach; model no. DR 3900), and test vials preloaded with analytic reagents (Hach; TNT vials: 823, 832, 845, 864, 880, and 872). Total solids (TS), total dissolved solids (TDS), and total suspended solids (TSS) were measured using standard methods from the U.S. Geological Survey (USGS, 1989). The main components and fractions of the influent distillery wastewater such as proteins, fats, and carbohydrates were reported by the wastewater supplier (Table 1).
COD, chemical oxygen demand.
Gas analysis was performed using a SRI 8610C Gas Chromatograph (SRI Instruments, Inc.) with a HayeSep D column (Restek Corporation) and thermal conductivity detector for methane and carbon dioxide detection.
Inoculum and substrate
Active methanogenic biomass supplied by Cargill, Inc. was inoculated in the stage-two EGSB (main 60-L reactor). The characteristics of the biomass were pH=∼7; TSS=61 g/L; and volatile suspended solid (VSS)=52 g/L. The substrate was provided from a production line by a distillery plant located in Louisville, KY. The characteristics of the distillery wastewater are summarized in Table 1. All tests were run with the supernatant substrate (distillery wastewater) after settling.
TSS in the wastewater were not a concern since the amount was less than 150 mg/L, which has been reported as the upper limit that is not harmful to biomass granules (Mulder and Thomas, 2003). The COD:N:P ratio present in the substrate here was ∼226:5:1, which is sufficient to treat this wastewater anaerobically. The sulfate concentration of the raw wastewater was below 150 mg/L of unionized H2S, corresponding to ∼300 mg/L sulfate (SO42−), which is below the toxic level reported for anaerobic biomass (Speece, 1983).
Experimental procedure
The supernatant from settled distillery wastewater was loaded into the PA tank for preacidifying the wastewater and for pH, temperature, and nutrient adjustment. The wastewater remained in the PA tank for ∼24 h, where 20–40% of the initial COD was converted to VFAs, an intermediate product before methane formation. Temperature was maintained between 32 and 38°C, and the pH was adjusted to the required range of 5 or greater, which was based on the acclimation behavior of this specific (distillery) wastewater, by adding caustic (NaOH) in the PA tank. For this particular wastewater, there was a sufficient amount of nitrogen and phosphate (Table 1), so these did not require adjustments.
The main 60-L EGSB AD reactor was seeded with 45 L of the active fresh biomass. The wastewater (with no dilution) was fed to the AD reactor with a constant flow rate (∼0.2–0.3 L/h) for ∼20 days to stabilize and adapt the biomass to the substrate. Subsequently, testing was run with and without hydrogen with various wastewater volumetric flow rates and the OLR that varied from ∼3 to 9 g COD/(L·day) for a duration of ∼1–2 HRT (Table 2). To enhance the mixing and conversion efficiency, 30% of the feed passing through the main reactor was recycled through the recirculation line. For the purpose of this study, supplemental hydrogen was injected in lieu of actually capturing hydrogen from the PA tank. Two conservative hydrogen inflow rates (0.15 and 0.30 L/[Lbiogas·day]) were employed, which were less than the theoretical amount of hydrogen generated in the PA tank. The hydrogen was injected through a ceramic diffuser to assist the gas–liquid mass transfer. During testing, gas production, COD, and VFA concentrations were measured every 24–48 h. Approximately 15 to 20 data points were collected per test case.
The final hydrogen injection rate (L/h) is based on the hydrogen flow rate (L/[Lbiogas
OLR, organic loading rates.
Results and Discussion
Reactor stability
For all cases, temperatures remained within the range of 32–38°C in the PA tank and 31–33°C in the effluent of the EGSB reactor. pH in the PA tank was ∼5.5 for all cases; pH in the effluent from the EGSB was ∼7.0 for case no. 1 and ∼7.3 for cases no. 2A and 2B. The slight pH increase (in the effluent during hydrogen gas injection) conforms with the results reported by Luo and Angelidaki (2013) who attributed the slight increase to the reduction of the carbon dioxide in the biogas reactor. The temperature and pH indicate that the EGSB reactor was operating normally within the desired mesophilic range.
PA during stage one, where ideally ∼20–40% of the COD is converted to VFAs, increases the stability of the stage-two EGSB reactor, where a sudden increase in OLR would cause an accumulation of VFAs since acetogens grow at a slower rate than acidogens (Wang et al., 2010). The degree of PA in the PA is quantified using the following:
or
where CODPA (mg/L) is the COD concentration leaving the PA tank, CODin (mg/L) is the initial COD concentration of the wastewater loaded into the PA tank, VFAin (mg/L) is the VFA concentration of the wastewater loaded into the PA tank, and VFAPA (mg/L) is the VFA concentration leaving the PA tank. (PA degree)1 and (PA degree)2 were both always between 26% and 32% (Table 3) for all cases, which were within the desirable 20–40% range as stated by the manufacturer. The difference between (PA degree)1 and (PA degree)2 remained within 0–3% for all cases. Means, standard deviations, and coefficients of variation (the ratio of the standard deviation to the mean) are calculated for each column in Table 3.
PA, preacidification; VFA, volatile fatty acid.
Another important stability characteristic is the VFA concentration of the effluent from the EGSB, which reflects the acidity and the VFA consumption by acetogenesis and methanogenesis bacteria in that reactor. For all cases, the VFA concentrations of the effluent ranged from 90 to 130 mg/L yielding VFA removal between 94% and 96%, indicating stability and normal operation of the reactor. COD removal efficiency was consistent and similar for all cases at ∼98%±0.3% (Table 3). Coefficient of variations were just 1% for VFA removal in the EGSB and 0.2% for overall COD removal from the combined PA and EGSB tanks.
Theoretical intermediate hydrogen
A significant amount of intermediate hydrogen gas is produced during PA and likely escapes the PA tank, but could theoretically be captured and sent to the second stage EGSB to react with the carbon dioxide. The amount of supplemental hydrogen injected is based on an estimate of the intermediate hydrogen gas produced in the PA tank. Since exact compositions of the industrial waste streams tested here are unknown, ethanol was used as a simple example. Incorporating equation (1), an average PA degree obtained here of 29%, an average COD concentration of 30 g/L organics, the molecular weights of ethanol and hydrogen (46 and 2 g/g-mol), and the density of hydrogen (0.09 g/L), the volume of hydrogen produced in the PA tank was on the order of ∼17 L/h. The actual amount of hydrogen injected here was kept to a conservatively low rate to account for inefficiencies such as the possibility of an unknown nonbiodegradable fraction, some of the hydrogen remaining dissolved in the liquid, and an inability to capture all of the escaping hydrogen gas. The two rates of hydrogen injection used here (0.15 and 0.30 L/[Lbiogas·day]) correspond to 1 and 3.2 L/h.
Enhanced reactor performance with hydrogen
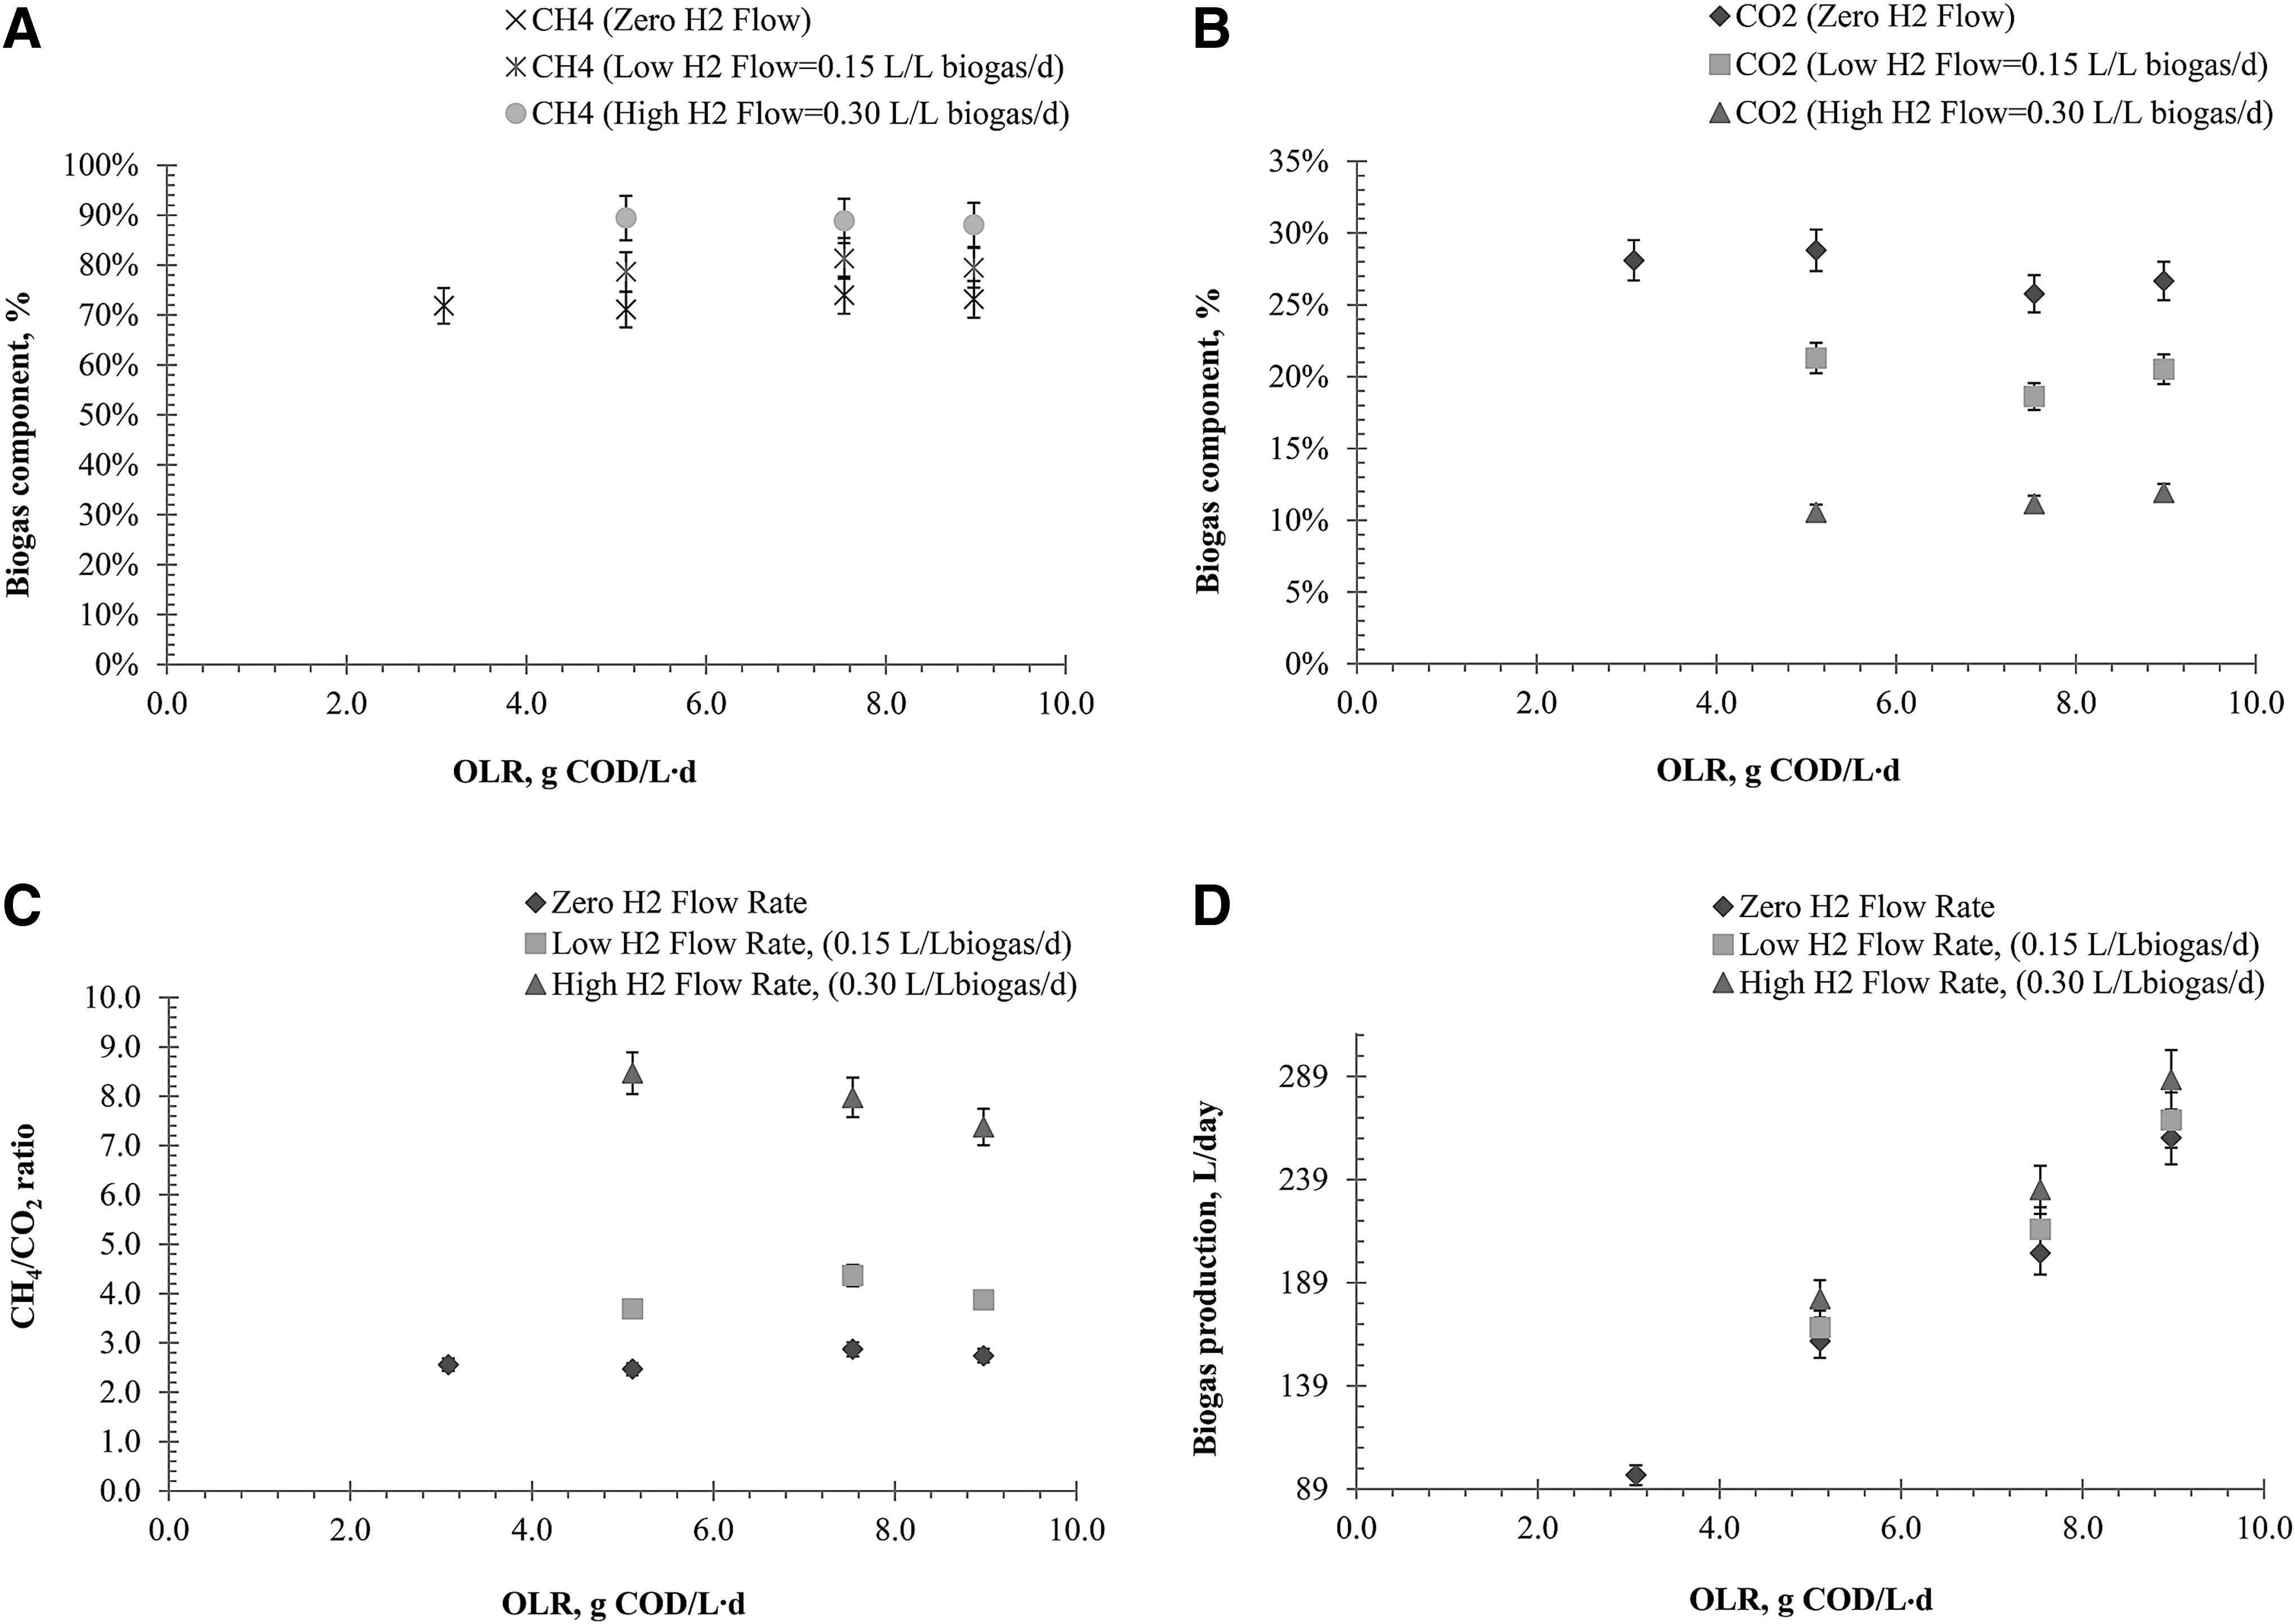
Methane percentage increased from ∼71% to 89%, carbon dioxide percentage decreased from 29% to 11%, and methane to carbon dioxide ratio increased from 2.5 to 8.5 when hydrogen was injected at 0.30 L/(Lbiogas·day) compared to no hydrogen injection (Fig. 2A–C). Improvements from no hydrogen to the lower hydrogen rate and from the lower hydrogen rate to the higher hydrogen rate were all outside the range of error bars. The biogas component percentages and methane-to-carbon dioxide ratios remained relatively unchanged as the wastewater (feed) flow rate increased, indicating that biogas enhancement kept up with the increasing feed rates. In the case of no hydrogen injection, the methane, carbon dioxide percentages, and methane-to-carbon dioxide ratio remained ∼71–74%, ∼26–29%, and ∼2.5–2.9, respectively; for the low hydrogen injection case (∼0.15 L/[Lbiogas·day]), the methane, carbon dioxide percentages, and methane-to-carbon dioxide ratio ranged ∼79–81%, ∼19–21%, and 3.7 to 4.4, respectively; for the high hydrogen injection case (∼0.30 L/[Lbiogas·day]), the methane, carbon dioxide percentages, and methane-to-carbon dioxide ratio ranged ∼88–89%, ∼11–12%, and 7.4–8.5, respectively. The methane content reached a higher percentage (89%) than Luo and Angelidaki (2013) reported equal to 78.4%, which is attributed to the 30% ratio of recirculation to fresh feed in the EGSB system that kept the hydrogen in the system longer, giving it a better chance to react with the carbon dioxide.
Biogas composition of
For each OLR, the volume of biogas produced increased by ∼10–15% when hydrogen was injected at 0.30 L/(Lbiogas·day) compared to no hydrogen injection (Fig. 2D). For the ∼5 g COD/(L·day) OLR, biogas production increased from 161 to 181 L/day; for ∼7 g COD/(L·day), biogas production increased from 203 to 234 L/day; for ∼9 g COD/(L·day), biogas production increased from 259 to 287 L/day. The volume of biogas increased since methane has a specific volume nearly three times larger than the carbon dioxide it replaced.
Biogas energy yield
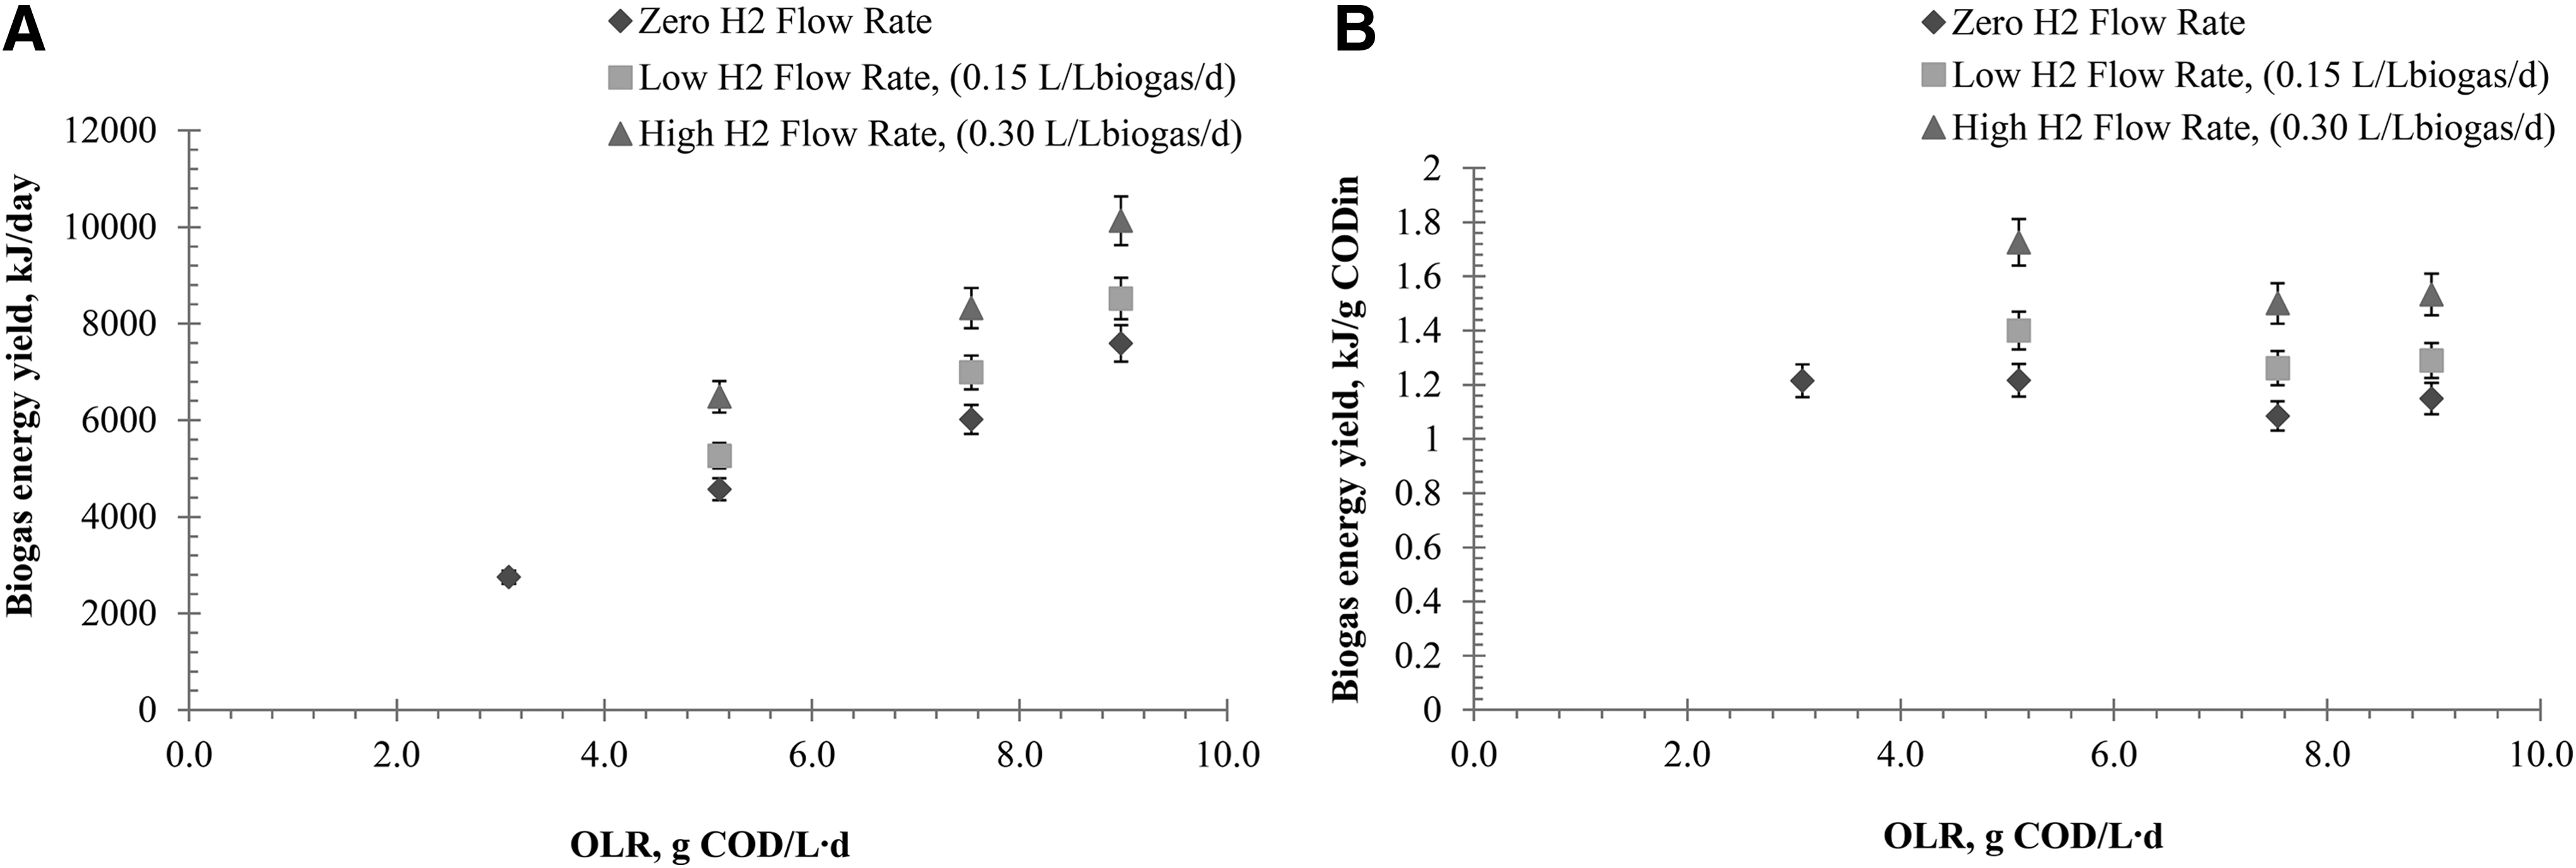
Biogas energy yields in terms of both kJ/day (Fig. 3A) and kJ/g CODin (Fig. 3B) were calculated for each test case using the volumetric energy content of methane, 40 kJ/L (Zhu et al., 2008). For each OLR in Fig. 3A, the energy yield increased by ∼33–42% when hydrogen was injected at 0.30 L/(Lbiogas·day) compared to no hydrogen injection (Fig. 3A). Again, improvements from no hydrogen to the lower hydrogen rate and from the lower hydrogen rate to the higher hydrogen rate were all outside the range of error bars. For an OLR of ∼5 g COD/(L·day), the energy yield increased from 4560 to 6440 kJ/day; for ∼7 g COD/(L·day), the energy yield increased from 6019 to 8324 kJ/day; for ∼9 g COD/(L·day), the energy yield increased from 7592 to 10,131 kJ/day.
Biogas energy yield
The energy yield per gram of substrate added increased by ∼34–42% when hydrogen was injected at 0.30 L/(Lbiogas·day) compared to no hydrogen injection (Fig. 3B). However, the energy yield per gram of substrate added decreased slightly (by 7–12%) as the OLR increased. In the case of no hydrogen injection, the energy yield decreased from ∼1.2 to 1.1 kJ/g CODin as the OLR increased from ∼3 to 9 g COD/(L·day). For the low hydrogen injection case (∼0.15 L/[Lbiogas·day]), the energy yield decreased from ∼1.4 to 1.3 kJ/g CODin as the OLR increased from ∼5 to 9 g COD/(L·day). For the high hydrogen injection case (∼0.30 L/[Lbiogas·day]), the energy yield decreased from ∼1.7 to 1.5 kJ/g CODin as the OLR increased from ∼5 to 9 g COD/(L·day). Decreasing energy yield per gram substrate added may be attributed to the gradual saturation of the biomass by the organics as the feeding rate increases. Theoretically, the energy yield per gram COD added would slightly decrease until it becomes completely saturated, at which time the biomass could not digest additional organics, and therefore, the yield would decrease drastically.
The overall net energy benefit increased by reacting the hydrogen to methane: (1) this hydrogen would have otherwise been lost and (2) hydrogen has a lower volumetric energy content than methane, 12.78 kJ/L (0.09 g/L density and 142 kJ/g heating value) versus 40 kJ/L (0.72 g/L density and 55.6 kJ/g heating value). For example, for the ∼5 g COD/(L·day) OLR, 48 L/day of hydrogen was introduced (Table 3) that resulted in an increase of methane generated from 114 (71% methane×161 L/day biogas) to 161 L/day (89% methane×181 L/day biogas), so the net energy content increased by 1267 kJ/day from 4560 (114 L/day×40 kJ/L) to 6440 kJ/day (163 L/day×40 kJ/L) by introducing 613 kJ/day (48 L/day×12.78 kJ/L) hydrogen. Supplemental hydrogen can also be potentially obtained and used to upgrade the biogas quality from external sources such as hydrogen producing AD reactors, coal gasification, petroleum refinery, petrochemical plants, and soda manufacture as other authors have stated (Ni et al., 2011; Luo and Angelidaki, 2012, 2013; Luo et al., 2012).
Impact of hydrogen injection on substrate removal efficiency and kinetics
COD removal efficiency remained constant, 98%±0.3%, for all cases with and without hydrogen (Table 3), indicating that hydrogen injection did not negatively affect overall substrate removal. Comparing kinetic parameters with and without hydrogen injection will further signify if biomass performance and stability were affected by the hydrogen injection. For an up-flow sludge bed reactor, the rate of change of biomass in the system can be expressed as follows (Hu et al., 2002; Sponza and Uluköy, 2008):
where Q is the flow rate (L/day); V is the volume of the reactor (L); X0 and X are the concentrations (g VSS/L) of the biomass in the influent and the effluent of the reactor, respectively; k and Kd are the specific growth rate (per day) and death rate constant (per day), respectively. By assuming that the concentration of the biomass in the reactor remains constant at steady state, dX/dt=0, and defining the HRT (θ) as the ratio of reactor volume (V) to the flow rate of the influent (Q), Equation (7) reduces to the following:
The specific growth rate can be expressed by the Monod model for AD (Hu et al., 2002; Young and Cowan, 2004; Sponza and Uluköy, 2008) as follows:
where S is the COD concentration (g/L) in the effluent, km is the maximum substrate removal rate (per day), and Ks is the half-saturation coefficient (g/L). Setting Equation (8) equal to Equation (9) as follows:
which can be inverted and linearized to give the following:
The rate of change in substrate concentration in the system can be expressed as follows:
where Y is the yield coefficient (g VSS/g COD) and S0 is the influent COD concentration (g COD/L). Under a steady-state condition (−dS/dt=0), substituting Equation (8) into Equation (12), and rearranging gives the following:
First, Y and Kd were determined from the slope and intercept of a plot of (S0−S)/θX versus 1/θ in Equation (13). Then, Kd was used in Equation (11) where km and Ks were determined from the slope and intercept of a plot of θ/(1+θKd) versus 1/S. The maximum substrate removal rate, qm (g COD/[g VSS·day]), is related to the maximum specific growth rate by the yield coefficient.
The R2 values ranged from ∼0.96 to 0.99 for obtaining all constants from the plots. All kinetic constants are summarized in Table 4.
VSS, volatile suspended solid.
The values of qm were 0.025 and 0.028 g VSS/(g COD·day) for the low and high hydrogen rates, which were slightly higher than qm=0.020 without hydrogen. The values of Ks were 0.682 and 0.642 g COD/L for the low and high hydrogen rates, which were slightly lower than Ks=0.686 without hydrogen. Both constants from the Monod model, qm and Ks, slightly favored the cases where hydrogen was added, indicating that at the very least, hydrogen injection did not adversely affect the performance or stability of the biomass.
Conclusion
Hydrogen gas, an intermediate product generated during PA (stage one), can be theoretically captured escaping from the PA tank and sent to the second stage EGSB reactor, where methane and carbon dioxide are formed, to enhance the biogas quality by biologically converting the carbon dioxide to methane. Pilot-scale tests were conducted by introducing supplemental hydrogen gas, in amounts less than theoretically generated in the PA tank, directly into the EGSB reactor operating at mesophilic temperature (35°C). The experimental data demonstrated that biogas quality was enhanced by ∼10% to 20% depending on the hydrogen injection rate. In addition, the energy yield increased by ∼33–42% with hydrogen injection at 0.30 L/(Lbiogas·day) compared to no hydrogen injection. COD removal efficiency remained constant at about ∼98%, both with and without hydrogen, indicating that hydrogen injection did not negatively affect the overall substrate removal. Then, the Monod model was employed to determine if the hydrogen impacted the reactor performance or stability. The maximum substrate removal rate, qm, increased slightly, while the half-saturation coefficient, Ks, decreased slightly when hydrogen was injected compared to no hydrogen, both indicating that hydrogen injection did not negatively affect substrate removal efficiency or stability of the biomass.
Footnotes
Acknowledgments
The authors acknowledge the financial support from the University of Louisville and Conn Center for Renewable Energy Research, as well as the material support from Brown-Forman (Louisville, KY). The authors also want to thank Dr. Mahendra Sunkara of Conn Center for Renewable Energy Research, University of Louisville for his support during this project.
Author Disclosure Statement
No competing financial interests exist.