
Abstract
Abstract
Activated sludge samples collected from 20 full-scale wastewater treatment plants were investigated to determine the effects of floc size (D50) on sludge settling characteristics. Results indicated that no simple and apparent relationship was found between D50 and sludge volume indices (SVIs) because of the complicated affecting mechanism of various parameters. Effects of D50 on the Vesilind settling model parameters were evaluated. Results indicated that no apparent relationship was found between D50 and V0. However, in the case of activated sludge with higher V0 (>5 m/h), there was a power function type correlation (V0 = 67.368·D50−0.4298, R2 = 0.5304) between V0 and D50. Furthermore, the parameter k decreased with increasing D50 through the relationship of k = 11.37·D50−0.5273 (R2 = 0.5593), except for samples with D50 < 100 μm and k < 1.0 m3/kg. V0 and k sludge were negatively correlated with sludge concentration because higher sludge concentrations contributed more resistance to settling velocities and their change rates. Results obtained in this study could provide scientific information for effective separation of activated sludge.
Introduction
S
Floc size is an important parameter influencing the separation of sludge in the final clarifier (Bitton, 2005) and has evident impact on the sludge separation process, such as sedimentation, flocculation, and filtration (Stevenson, 1997). Normally, the settling rate of particles is proportional to the square of particle diameter, and inversely proportional to the viscosity of liquid under gravitational settling situation. However, the settling of activated sludge is different with the gravitational sedimentation due to the effects of Brownian motion, consistency, and nonspherical particles. However, the floc size can differ substantially as a result of the difference or changes in operational conditions (Wilén et al., 2003). Particles in activated sludge vary from a single microorganism cell, the size of a few microns or less, to a large number of cells up to several hundred microns in size (Jin et al., 2003; Han et al., 2012).
In terms of the simulation of sludge settling velocity, most of the research was conducted based on empirical models (Guo et al., 2009). Many mathematical relationships between the zone settling velocity (ZSV) and the sludge concentration have been proposed (Hultman et al., 1991). Constraints limiting the applicability of these expressions have also been well documented (Giokas et al., 2003). The greatest challenge is the difficulty in developing the relationship between the activated sludge properties (such as floc size, structure, and morphology) and the settling characteristics, V0 and k in the Vesilind expression:
Here, V0 is the initial settling velocity (m/h), and k is the empirical settling parameter (m3/kg). Flocs of different sizes show different physical and chemical characteristics including density, surface area, reflocculation ability, component of filamentous organisms and so on, which in turn influence their settleability. Therefore, the floc size could be expected to exert some direct or indirect influence on sludge settling. However, many researchers have been conducted focusing on the settling characteristics of sludge floc, and a number of studies have evaluated the effects of various factors on the ZSV. Even though floc size distribution is one of the major factors associated with activated sludge settling properties, its effects on the sludge settling have neither been fully understood nor evaluated effectively (Jin et al., 2003; Wilén et al., 2003). The increasing concern for higher effluent quality of wastewater treatment systems has created the requirement for an in-depth and systematic understanding of the effects of floc properties on the ZSV, whereas floc separation could be improved through understanding how this process is associated with the particle size distribution of activated sludge. Consequently, the objectives of this study were to characterize the activated sludge floc size distribution and to investigate its effects on zone settling characteristics in full-scale WWTPs.
Materials and Methods
Sampling description
Activated sludge samples were collected from the aeration tank of 20 different full-scale activated sludge WWTPs in South Korea. With the exception of Seosan WWTP (sampled twice), each plant was sampled once during the 4-month sampling period (November 2010 to February 2011). The sludge samples were collected from the aeration basins and kept in plastic containers. The specific information for sampling trips is listed in Table 1.
Plant was sampled two times.
MLSS, mixed liquor suspended solids; RAS, return activated sludge.
Sample analysis
Sample testing was carried out immediately after sampling. The particle size distribution was analyzed using an AccuSizer™ 780A particle analyzer, which enables the measurement of particles in the range of 0.5–499 μm. This instrument is equipped with an autodilution system, which measures the size of particles by means of light scattering using the sensor (Model: LE400-0.5 EXT). Between the analyses of each sample, the system was flushed through three cycles, which reduced the background particle concentration to less than 10 count/mL.
Determination of the sludge volume index (SVI) and ZSV were conducted based on the methods documented in previous studies (Schuler and Jang, 2007; Jassby et al., 2014). Specifically, a 1,000 mL well-mixed mixed liquor suspended solids (MLSS) sample was put into a 1,000 mL graduated cylinder for 30 min settling, the settled sludge volume was set as SV30, and the SVI was the result of SV30 divided by the MLSS concentration. The ZSV measurements were conducted using 6.5 cm diameter and 110 cm high cylinders. A range of biomass concentrations were prepared by diluting activated sludge samples (MLSS and return activated sludge [RAS]) with secondary effluent. The concentrations of the MLSS samples were set as 50% MLSS and 100% MLSS, respectively, whereas the concentrations of RAS were set as 50% RAS, 70% RAS, and 100% RAS, respectively. One thousand milliliters of well-mixed prepared samples were put into cylinders, and the settled sludge volumes were determined at 0, 2, 5, 10, 15, 20, and 30 min, respectively, during a 30-min settling period. The relationship between settling time and the settled sludge height was expressed as a sedimentation curve, where the slope of the constant part of the curve was obtained as the ZSV, which means the rates of “hindered” settling. Then the relationship between the ZSVs and sludge concentrations of samples (including 50% MLSS, 100% MLSS, 50% RAS, 70% RAS, and 100% RAS) for each WWTP was simulated using the exponential function, and the values of V0 and k could be read from the simulation results (Vanderhasselt and Vanrolleghem, 2000). The size distribution and some other settling properties of the sludge samples are summarized in Table 2.
SVI, sludge volume index.
Results and Discussion
Effects of particle size on sludge settleability were investigated using the size of D10, D50, and D60 (the values of the particle diameter at 10%, 50%, and 60%, respectively, of the cumulative volume fraction). The results indicate that D10, D50, and D60 showed similar effects on the parameters (SVI, V0, and k). Thus, D50 was selected to show the relationship between particle size and these parameters as an example factor in this study.
Particle size distribution
The particle size distribution of the sludge samples is shown in Fig. 1. The particles varying from around 10 to 200 μm contributed 26–98% (average 79%) of the particle volume for the 21 WWTP samples (Fig. 1a). Thus, it can be concluded that particles in this range contributed to most of the particle volume for the activated sludge. On the other hand, it can be noted that most of the particles were within the range of 0.5–100 μm based on the particle number concentration. The particles smaller than 100 μm were predominant and contributed to most of the particle population (Fig. 1b).
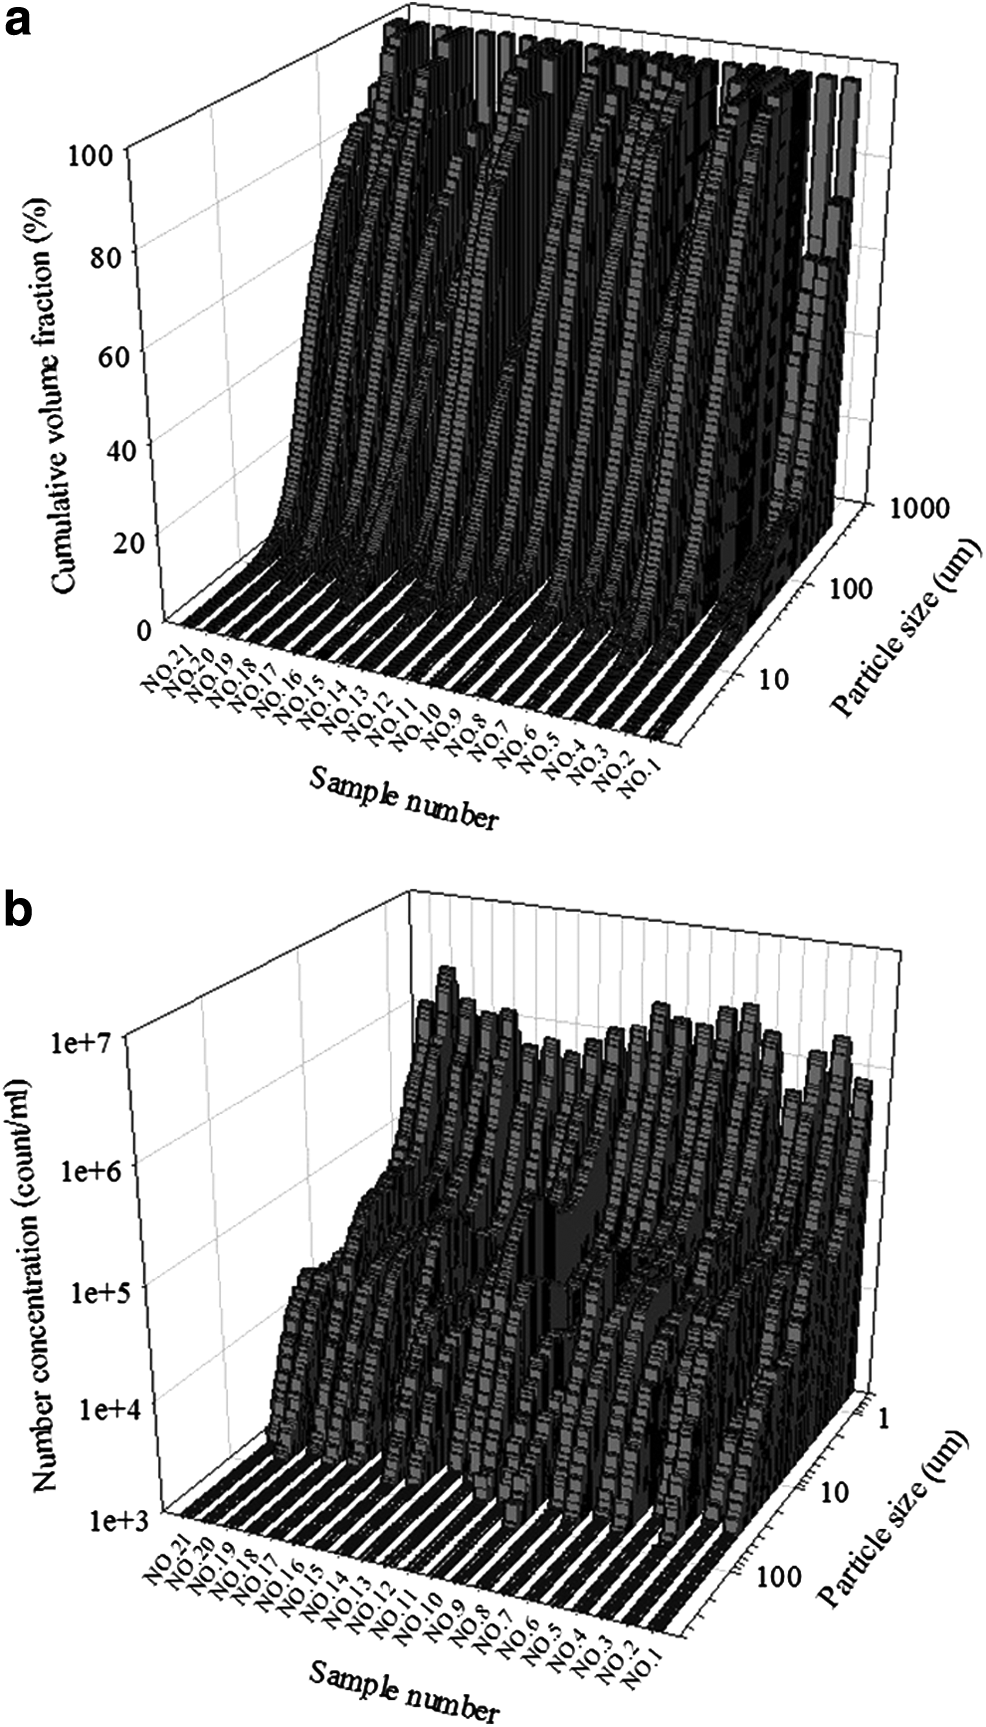
Particle size distribution of sludge flocs.
Floc size of activated sludge reported by various workers varies between 0.5 μm and 1,000 μm, but most of the flocs are smaller than 100 μm (Stypka, 1998). Normally, the floc size was considered larger than 20 μm (Finstein and Heukelekian, 1967). The size distribution of particles is the result of the dynamic equilibrium state between formation, transformation, and breakage of the microbial aggregates in the treatment plants. Furthermore, they are affected by many parameters, including aeration, sludge retention time, sludge loading, pumping, and dewatering (Das et al., 1993; Wilén et al., 2003; Govoreanu et al., 2009). Govoreanu et al. (2003), suggesting that the floc size and size distribution were different due to the presence of different microorganisms at the different operational stages. As an important parameter affecting sludge settleability, particle size and distribution have been increasingly gaining acceptance in the design and assessment of the water treatment process (Wu and He, 2010).
Effects of particle size on SVI
SVI is a basic measure of the physical properties of MLSS. It is typically used to evaluate the settling characteristics of activated sludge (Janczukowicz et al., 2001). The effects of particle size on SVI are shown in Fig. 2. Overall, no apparent relationship was found between the particle size and SVIs. Especially for the samples with SVIs less than 200 mL/g and D50 less than 75 μm, the SVIs were comparable for these samples. Jin et al. (2003) revealed the relationship between the floc size and SVI of sludge collected from three WWTPs. Their results indicated that SVI correlated positively with the floc size in two plants, whereas no correlation was found between floc size and SVI for another plant. It was reported that the effect of floc size on SVI was determined by the sludge characteristics. Larger floc size could lead to a larger SVI due to the fact that the larger flocs have lower density and larger surface area than the smaller ones (Andreadakis, 1993). On the other hand, when the sludge is filament-free and has a granule-like structure, these flocs could compact well and give a low SVI due to their relatively dense and round morphology, even though they are large (Jin et al., 2003).
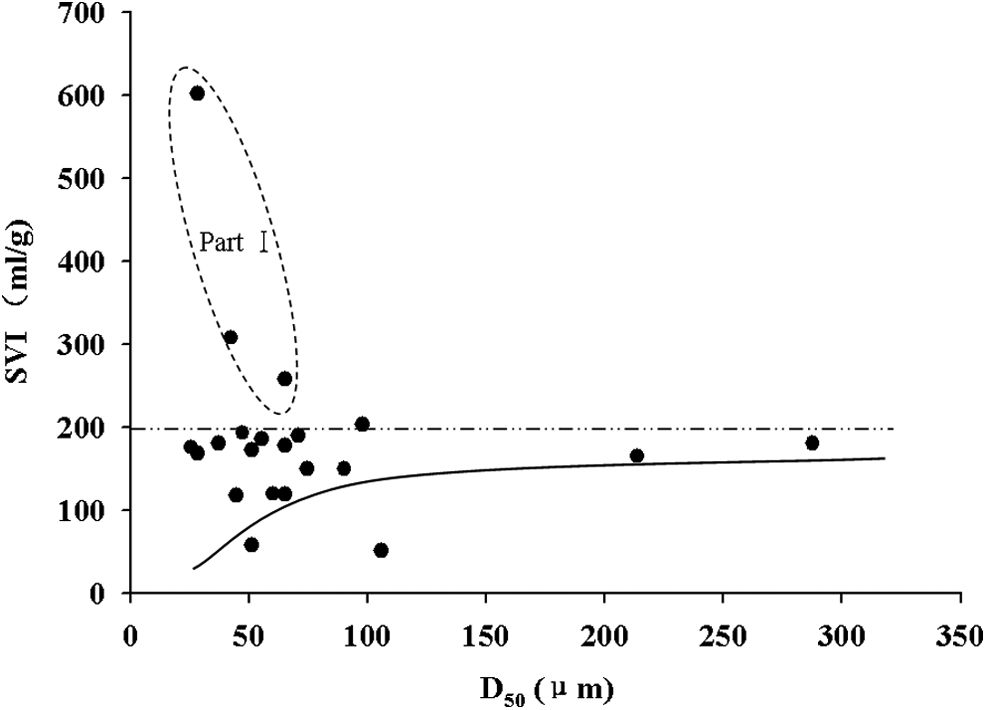
Effects of particle size on sludge volume index.
In addition, the SVI comparison is most unpredictable when the MLSS samples were collected from different plants with different concentrations (Ekama et al., 1986), especially when the sludge settlement was poor (Berktay, 1998). This explains from another aspect why no correlation was found between floc size and SVI in our study. Moreover, it is well known that SVI is influenced by the concentration of sludge, the sludge volume, the temperature, and the floc structure (Jin et al., 2003); this means that the SVI is a rather nonspecific measurement of floc size. Therefore, it can be concluded that no simple and apparent relationship was found between floc size and SVI due to the fact that the SVIs were governed by a number of different factors.
It should be noted that some samples with D50 less than around 75 μm (part I in Fig. 2) showed a higher SVI (>200 mL/g). This could be caused by the overgrowth of microorganisms, and the microorganisms in turn lead to poor flocculation properties and low density of the activated sludge, which resulted in the higher SVI (Wilén et al., 2003).
Effects of particle size on V0
The calculated V0 as a function of floc size for the studied plants are shown in Fig. 3. The activated sludge had a very different ZSV with the floc size (D50) varying from 25 to 288 μm. For the activated sludge with a higher V0 (>5 m/h), there was a power function correlation found between V0 and D50:
This relationship can be explained as follows. The larger flocs were recognized to have lower fractal dimensions and higher drag force, which correspond to more loose aggregates (Winkler et al., 2012). These loose agglomerates and aggregates have rather low density, which makes the sludge settle and compact poorly (Wilén et al., 2003; Zhao et al., 2004). The floc particles adhere together and the interparticle forces are sufficient to hinder the settling of neighboring particles. The flocs could be described as flocculated floc–floc or floc–filament aggregates for zone settling in the present study. The highly viscous aggregates are more affected by each other. This interpretation was supported by the data presented in Fig. 3, where the V0 showed a decreased trend with floc size in this study.

Effect of floc size on calculated maximum settling velocity (V0).
For samples with V0 lower than 5 m/h, the sludge demonstrated no apparent trend between D50 and V0. The samples in this range showed a comparable floc size (25–75 μm). The relatively lower ZSV of these sludge samples was probably caused by the occurrence of pinpoint bulking, which is a common problem for activated sludge and can lead to a hardly settleable state for small particles. It also might be due to the breakup of larger flocs, which is caused by shear forces during aeration, pumping, and dewatering processes (Das et al., 1993), and these broken flocs contain more microorganisms and show lower density (Andreadakis, 1993). Normally, the number concentration of suspended solids will increase, whereas the above two situations occur in the treatment plants. It should be pointed out that the settling velocity for a majority of sludge samples was lower than 5 m/h in the present study. It has been reported that the settling velocity of activated sludge is generally variable in a wide range depending on the sludge nature and environmental conditions (Schuler and Jang, 2007; Zodi et al., 2009; Yan et al., 2014). Then, the variability of settling velocity resulted in the complexity regarding the effect of floc size on sludge settling ability.
The discussion above indicates that the settling is governed by different sludge characteristics, and no simple and consistent relationship exists between floc size and sludge settling. When the sludge is collected from different treatment plants, it is complicated to find the trend between the settling and sludge's physical characteristics, since the variations in settling properties result from different factors (e.g., presence of filamentous microorganisms, floc size, and components). Comparison between SVI and V0 indicated that samples relating to higher SVI values normally had lower V0 values. The statistical analysis indicated that the correlation coefficient was −0.339 (p > 0.05) between these two factors.
Effects of particle size on k
Figure 4 gives the relationship between the floc size and the calculated sludge settling characteristic constant (k). It can be seen that no apparent correlation was found for the samples with D50 less than 100 μm and k less than 1.0 m3/kg (part I in Fig. 4). The values of k were comparable and constant for these samples. For other samples, k decreased with the increasing floc size with the following power function relationship:
This indicated that the effect of floc size on the settling velocity becomes weaker as the floc size increases, and the change of settling velocity is somewhat more sensitive for the smaller flocs than the larger ones. The effect of floc size on sludge settling characteristic constant (k) can be explained as follows. Increase of floc size affects the floc structure and pore space (Wilén et al., 2003), which are related to k because of the fact that they contribute resistance to sludge settling (Schuler and Jang, 2007).
Effects of sludge concentration on k and V0
In this study, the relationship between the raw sludge concentration (including MLSS and particle number concentration) and zone settling characteristic parameters, k and V0, were analyzed. Sludge concentration was negatively related to the parameter k. Especially for MLSS and particles less than 10 μm, the significant correlation was found with the relation coefficient as −0.473 (p < 0.05) and −0.486 (p < 0.05), respectively (Table 3). It is known that the constant, k, indicates how fast the velocity will decrease per unit increase of sludge concentration. Thus, the negative relationship between k and sludge concentrations (including MLSS and particle number concentration) can be interpreted as the degree to which the settling velocity decreases with increasing sludge concentrations. Zhang et al. (2006) documented that the variability rates of zone settling velocities decrease as the sludge concentration increases; this is in agreement with the result obtained in this study. Furthermore, it was reported that the parameter k could be described as a factor that is related to resistance caused by activated sludge flocs (Schuler and Jang, 2007). Thus, it could be expected that floc with high sludge concentration will provide more resistance to the change rate of settling velocity.
p < 0.05.
In addition, V0 was also found to negatively relate with the MLSS and particle number concentration (Table 3). In terms of effects on V0, previous studies also reported similar results. Research conducted by Rasmussen and Larsen (1996) and Guo et al. (2009) suggested that sludge settling velocity indicates a negative exponential-type relation with sludge concentration under turbulent conditions. The negative correlation between sludge concentration and V0 can be interpreted as follows. The higher sludge concentration results in higher interparticle action probability, which contributes more resistance to particles settling. Hence, it could be expected as a negative correlation between sludge concentration and zone setting velocity. It was also reported that the increase of sludge concentration decreases sedimentation velocity because settling is hindered by the high quantity of flocs (Janczukowicz et al., 2001; Schuler and Jang, 2007). However, the negative relationship between sludge concentration and sludge settling is not true for all sludge concentrations, because zone settling does not occur with low sludge concentrations (Renko, 1998). Guo et al. (2009) also reported that the sludge concentration presented a dual effect on settling velocity: settling velocity decreased with sludge concentration only, whereas the sludge concentration was much higher.
Furthermore, the smaller particles showed more close correlation than larger ones to k and V0 (Table 3). The correlation coefficients between k and particle number concentration in the range of smaller than 10 μm, 10–60 μm, and bigger than 60 μm were −0.486 (p < 0.05), −0.074 (p > 0.05), and −0.020 (p > 0.05), respectively. The corresponding values were −0.525 (p < 0.05), −0.329, and −0.188, respectively for V0. This indicates that the smaller particles are more sensitive to the sludge zone settling process, which is in agreement with the results indicated in Figs. 3 and 4. This is due to the fact that smaller particles indicate higher surface area and smaller density than the larger ones. Thus, they could contribute more resistance to settling down than the larger ones (Schuler and Jang, 2007). In addition, the smaller particles, such as the particles less than 10 μm, are mainly from dispersed bacterial growth and erosion or breakup of large particles owing to the turbulent shearing. These particles should be more sensitive to sludge settling due to their buoyant nature and mobility (Wu et al., 2009). The discussion above might explain why the smaller flocs indicated more close negative relationships with settling characteristics.
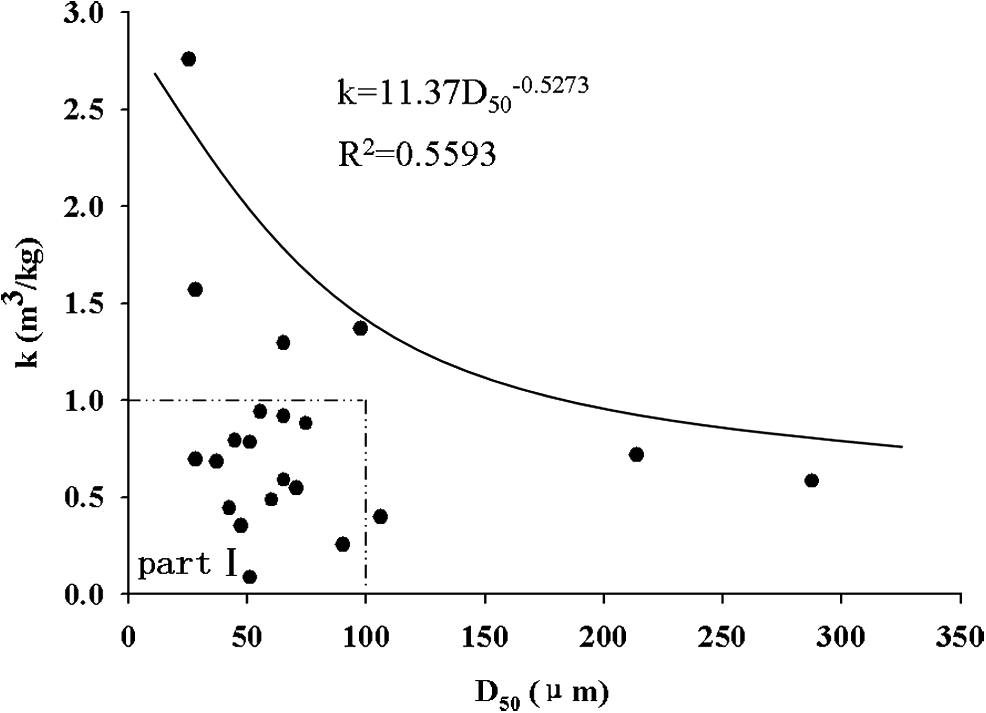
Effect of floc size on calculated sludge characteristics constant (k).
The limitation of this study is that the value of D50 was measured with the assumption that the sludge flocs were spherical. However, because of the irregular shapes of the activated sludge flocs, D50 cannot accurately describe the floc size. Accordingly, the relationships between the floc size and the sludge zone settling characteristics obtained in this work were somewhat inaccurate. Another inadequacy is that some important affecting factors, such as hydraulic/solid retention time, mixed liquor volatile suspended solids, and ratio of food to microorganisms, were not analyzed due to their unavailability.
Conclusions
This work examined the size and distribution of activated sludge and revealed the effects of floc size on ZSV. The main results can be summarized as follows:
(1) The sludge floc size and distribution varied greatly for the samples from different treatment plants. D50 ranged from 25 to 288 μm, and most samples had a D50 smaller than 100 μm. Particles in the range of 10 μm to around 200 μm contributed most of the sludge volume, whereas the particles less than 100 μm were dominant in the particle population. (2) The relationship between floc size and SVI was complicated. Overall, no apparent relationship was found between the particle size and SVIs. Especially for the samples with SVIs less than 200 mL/g and D50 less than 75 μm, the SVIs were comparable for these samples. (3) For the activated sludge with the higher V0 (>5 m/h), there was a power function correlation (V0 = 67.368·D50−0.4298, R2 = 0.5304) found between V0 and floc size. For the samples with V0 lower than 5 m/h, the sludge demonstrated no apparent trend between floc size and settling velocity. Furthermore, the floc size indicated no apparent effect on the settling characteristic constant, k, for samples with D50 less than 100 μm and k less than 1.0 m3/kg. For the other samples, k decreased with increasing floc size through the power exponent relationship of k = 11.37·D50−0.5273 (R2 = 0.5593). (4) In terms of the effect of sludge concentration on ZSV, a negative correlation was observed between the sludge concentration (including MLSS and particle number concentration) and k and V0 due to the fact that higher sludge concentration contributed more resistance to settling and the change rate. Furthermore, the smaller particles showed closer correlation to k and V0 than the larger ones.
Footnotes
Acknowledgments
The data collection of this article was originally supported by the Republic of Korea Ministry of Environment as the Eco-Innovation Project and the postgraduate research project of Hanseo University in South Korea. The preparation of this article was funded by the National Natural Science Foundation of China (Grant No.: 41401546), and a project funded by the Priority Academic Program Development (PAPD) of Jiangsu Higher Education Institutions.
Author Disclosure Statement
No competing financial interests exist.