
Abstract
Abstract
Over the past 30 years of rapid development, industrial parks have been an important sustained resource for economic development in China. However, due to economic yield-oriented policy and deficient scientific planning, excessive resource consumption and environmental pollution caused by industrial activities in industrial parks has led to ecological degradation and loss in the local areas. To respond to this issue, many researchers have focused on studying the overall efficiency of industrial parks from the perspective of metabolism of material and energy and have proposed some methods such as life cycle assessment, system of environmental economic accounting (SEEA), material flow analysis, and emergy synthesis, which indeed have improved the methods of evaluating industrial activities shift from only an economic perspective to a more comprehensive direction. However, these approaches have only focused on the efficiency of industrial activities while ignoring ecological conditions of the local areas. This article addressed this issue by proposing an emergy-ecological footprint hybrid model to show how this method could be applied to demonstrate both the energy metabolism of industrial parks' activities and ecological capacity of the local areas. We took the Shenyang economic technological development area (SETDA) and the Fuzhou Qingkou investment zone (FZQKIZ) as case studies to validate this method. Results showed that although the environmental burden of SETDA was heavier than FZQKIZ, the ecological capacity of surplus for SETDA was also stronger than FZQKIZ, which caused ecological surplus of SETDA compared with FZQKIZ. This study indicated that we should pay more attention to ecological capacity of the local areas surrounding industrial parks rather than only focusing on environmental impacts caused by industrial activities.
Introduction
A
In recent years, evaluation methods for industrial parks have been developed as well and some methods have been proposed in evaluating the efficiency of industrial parks such as life cycle assessment (LCA), material flow analysis (MFA), exergy, emergy, and the system of environmental economic accounting (SEEA). However, the proposed methods have some disadvantages for evaluating industrial parks. For instance, LCA focuses on individual aspects of resource use and system metabolism such as commercial energy demand and emissions often disregarding other parameters and driving forces; besides, LCA does not account for local ecosystem services or the value of existing natural capital with incomplete assessments leading officials to pay less heed to protecting local ecosystems (Geng et al., 2013). SEEA mostly deals with environmental stock caused by industrial activities. Other factors affected by the natural environment and society are not considered to a large extent. MFA accords to the quality constant, which only takes consideration of material flow but excludes ecological contributions. Emergy analysis has its advantages in analyzing industrial systems. It could not only tell us the whole system's energy metabolism, environmental load, etc. but also inform us the emergy flow of the elements in a system. That means through discrepancy of elements' emergy flow, we could see emergy flow of some resource flow in the system. Emergy analysis has been applied in evaluating in the industrial park in 2010 (Geng et al., 2010). The advantage of emergy analysis is that it considers all systems to be networks of energy flow and determines the emergy value of the streams and systems involved (Jorge and Hau, 2004), including ecological contribution, labor, and even services. However, the methods mentioned above concern only energy metabolism of industrial system, while ignoring the capability of local area of industrial parks.
Industrial park is a mid-industrial system, which takes a very important position in driving the national economic development. Meanwhile, it is also the place for frequent environmental pollution and ecological degradation. Accurate evaluation on industrial park will be helpful for policy makers to amend effective policy and deter environmental pollution and ecological degradation for some local areas. The emergy-ecological footprint (EF) hybrid method was applied in a macroscale system like a region or a city level (Liu et al., 2008, 2011a; Zhao et al., 2008). Its advantage is that it could inform us about the local ecological environment to the material and energy metabolism caused by industrial activities. The indicators of emergy-EF hybrid method could show the connection between an industrial system and its local environment. The emergy-EF hybrid method was never applied in evaluating a midscale industrial system like industrial parks. This article would fill this gap to demonstrate how this hybrid method could be applied in evaluating the local capacity of an industrial park and highlighting the connection between energy metabolism of industrial parks and its regional ecological capacity with emergy synthesis through the case studies of Shenyang economic technological development area (SETDA) and FZQKIZ. To achieve this goal, we will introduce the Background of Emergy, Ecological Footprint, and Emergy-EF Hybrid Method in the following section. Then, the methodology will be proposed in the Methodology and Data Sources section. In the Case Studies of SETDA and FZQKIZ section and Results section, the results of case studies and feasibility of this method are also presented. Finally, a critical analysis, including discussion of benefits, advantages, and limitations of this emergy method, is detailed in the Discussion section.
Emergy-EF Hybrid Method
Emergy background
Emergy theory was initially proposed by H.T. Odum in the late 1980s. Emergy analysis is a type of embodied energy analysis that can provide common units (solar emergy joules [seJ]) for comparison between environmental and economic goods, by summing the energy of one type required directly or indirectly for production of goods (Odum, 1988), the advantage of which is that this method records ecological contributions to the formation of materials. Emergy theory has developed over the last three decades (Odum, 1996) as a tool for environmental policy and to evaluate the quality of resources in the dynamics of complex systems. For example, emergy evaluation has been successfully applied in multilevels such as national level, regional level, coastal systems, forest systems, farm systems, and industrial systems (Pulselli et al., 2007, 2011; Lu et al., 2011). However, some indicators have caused concerns and needed to be improved such as the environmental load ratio because it could not demonstrate the connection between a targeted system and its local ecological capacity.
Ecological footprint
The EF method has been proposed as a standard methodology to evaluate the environmental implications of alternative development models (Wackernagel and Rees, 1996). This aggregate indicator permits the estimation of the equivalent land/sea area or biosphere required to support productive activities. Its unique attribute is that it accounts for the demand upon natural resources, in terms of an equivalent land/sea area, or global hectares (Roberto and Pedro, 2010). The most comprehensive EF applications so far include the use of six different resources: crop land and pasture land (for production of food and goods), built-up land (to support infrastructure), forest (for the production of wood products), fish (food production), and carbon assimilating capacity (for carbon dioxide emissions from fossil fuels). In the EF defined by Wackernagel and Rees (1996), these different types of resources are aggregated in terms of the amount of land (Van Vuuren and Smeets, 2000). The advantages of EF are that it is a widely used tool, which has a didactic way of showing results and normalizes different types of productive areas and then allows categories within footprint and biocapacity to be compared. The disadvantages of EF are that equivalence factors are based only on agricultural production and account for each type of area only once, even if the area supplies more ecosystem services. Moreover, it does not consider aspects such as top soil loss, water use, and embodied energy and excludes areas with low biomass productivity (energy footprint is entirely based on forest carbon sequestration rates). Besides, there is no difference drawn between renewable and nonrenewable land use. In addition, equivalence factors and yield factors are not easily available, even for researchers, and they do not incorporate the work done by nature in the production of natural and human resources (Wackernagel and Rees, 1996).
Emergy-EF hybrid method
Emergy-EF hybrid is a new approach based on EF and emergy analysis that was originally proposed by Zhao et al. (2005). Zhao et al. (2005) introduced concepts of emergy analysis into the EF framework. Afterward, the emergy-EF hybrid method was modified by Chen and Chen (2006, 2007) to investigate the resource consumption of the Chinese society from 1981 to 2001 and by Siche et al. (2006) to make a diagnosis of Peruvian resource problems using the 2004 data. In recent years, Convergence of EF and emergy analysis was improved as a sustainability indicator such as investigations in Peru as a case study adding soil loss and water consumption (Siche et al., 2010). They considered biocapacity based on natural renewable external flows. The conversion of energy and/or mass flows to emergy flows is made using the emergy intensity factors: emergy (seJ)=energy or mass flow (J or kg)*emergy intensity factor (seJ/J or seJ/kg). After that, emergy per capita is calculated through the division of each emergy flow by the population of the country under study, resulting in seJ/person units. To obtain the biocapacity per capita in units of area, the emergy of biocapacity per capita of each flow is divided by global empower density. According to Odum (2000), the average of global empower density is 3.1E+10 seJ/[m2·a]. The advantages of emergy-EF hybrid method are as follows: first, it improves the accuracy of results because it replaces the parameter from the average global yield of land proposed by the EF method instead of emergy, which is grounded in thermal theory. Second, compared to the EF method, the hybrid method broadens the scale of evaluation target, which includes water, soil loss, and even labor and service, which could give us a more complete picture of the target system. Third, the hybrid method records the ecological contribution to the formation of material.
Methodology and Data Sources
Data collection and treatment
First, we defined the physical boundary of an industrial park region. Second, the relevant data were collected such as information on renewable resources, nonrenewable resources, the amount of imported materials, and the cost of labor and services. Renewable resources refer to the natural resources of the targeted area such as sunlight energy, rain energy, wind energy, and even tidal or geothermal heat energy. Nonrenewable resources usually refer to the non-natural material of the local area such as ore, which involves in industrial production or soil erosion during the industrial process. Imported materials refer to the input from the outside to be part of raw materials for industrial production. Third, transformities and other emergy per unit values (UEV), which are the coefficients used to transform raw units, for example, joules and grams into solar energy, were obtained. The relevant research materials on UEV were reviewed and where suitable transformities were not available, they were recalculated. The units of the UEV are most often solar emjoules per joule (seJ/J) or solar emjoules per gram (seJ/g). The last step was the calculation of emergy indicators.
There are several approaches to collect data for the system, including direct field surveys, literature reviews, key informant interviews, and informal meetings. However, data availability and reliability are very important. Therefore, several data acquisition approaches are performed, in parallel, to validate the quality of data and information. To further validate the collected data information, informal meetings with local stakeholders or some other kinds of actions should be held to validate the accuracy of the gathered information.
The next step after data acquisition was data categorization, which separates the collected data into different groups, such as economic inputs, renewable resources, nonrenewable resources, and economic yields. These groups should be reviewed and revised, if necessary. An analytical table should be constructed to gather and organize the information acquired from the different sources such as reference to the source of data or from field survey. Invalid or inaccurate data are deleted after further analysis and validation is performed to ensure that the data are accurate. Other data could be added or deleted based on thermodynamic and chemical evaluation of the processes or based on direct measurement of the variables. The table, once completed, would describe the actual flow of materials, labor, and energy. To convert various inputs into a common base in solar emergy units, the different units for each flow are multiplied by suitable transformities or specific emergies.
Finally, an energy system diagram of the whole system is necessary. The diagram would help identify input and output flows, system components, interactions among components, etc. In this diagram, flows are described as clockwise from left to right in order of their increasing transformity. Therefore, this flow would help simplify the material and energy flows so that the existing hierarchy of components and flows in this diagram can be easily understood.
Traditional indicators of emergy method
During nearly 30 years of development, many indicators of emergy analysis have been invented and improved. However, some typical indicators are still usually quoted by scientists such as the emergy yield ratio (EYR), the environmental loading ratio (ELR), and the emergy sustainability index (ESI). Generally, emergy analysis indicators could be categorized as structural indicators, functional indicators, and systematic indicators. Structural indicators are renewable resources emergy (R), nonrenewable resources emergy (N), purchased input emergy (F), labor and service emergy (L&S), and the total emergy (U), which could be expressed as (U=R+N+F+L&S). These structural indicators are the composition indicators of functional indicators. Functional indicators could be applied to demonstrate the targeted system's certain functions like EYR and ELR, as well as the systematic indicator like ESI mentioned above.
EYR is the ratio of the emergy yield of a process to the larger system to the nonrenewable economic inputs purchased or received from the larger system. Considering that the total emergy is the sum of all local and external emergy inputs, the higher the ratio the higher is the relative contribution of the local sources of emergy to the system products. This index therefore shows how efficiently the system uses the available local resources (Vassallo et al., 2007).
ELR is the ratio of the sum of nonrenewable and purchased emergy to the renewable emergy inputs in a process. This indicator represents the load burden to the local environment.
ESI was first proposed by Brown (1996), the formula of which was
Although some concerns emerged for its weakness of only considering efficiency of resource consumption while disregarding other impacts on the sustainability of an industrial park, this indicator was also modified and improved (Lu et al., 2003), as this indicator was often quoted.
Emergy-EF hybrid method
The above three mentioned functional indicators were frequently applied by relevant researchers. However, these indicators do not consider the connection between a targeted system and its surrounding environment. Based on this, we proposed the emergy-EF hybrid method so as to give a whole picture of the reaction of local area to the energy metabolism caused by industrial activities.
According to Zhao et al. (2005), emergy ecological capacity (Ec) could be expressed by Equation (4), where R represents renewable emergy consumed in the area of an industrial park such as the sunlight emergy, wind emergy, rain emergy, geothermal heat emergy, and even tidal emergy. We would apply global average emergy density [Pg]=3.1E+10 seJ/[m2·a] as the parameter for this study.
As for the emergy ecological footprint (E), it is expressed by Equation (5), where N and F have been defined earlier. Pl represents regional average emergy density, which is expressed by Equation (6). U is the total emergy that happened in the area of an industrial park, while S is the area of an industrial park.
Ecological surplus or ecological deficit (Q) could be expressed by the Equation (7), which represents the reaction of local ecological environment to the industrial activities. If Q is positive, it would mean that the local area of an industrial park could sustain the development of the industrial activities. If Q is negative, it would mean that the local area could not afford the ecological loss by industrial activities.
Case Studies of SETDA and FZQKIZ
SETDA is located in the western part of Shenyang city (Figure 1), which is well known as an important heavy industrial base in China. SETDA is an inland area and the average annual rainfall is 0.68 m. The area's average annual wind velocity is 3.92 m/s. SETDA was founded in 1988, which occupied an area of 144 km2. Through nearly the last 30 years of development, SETDA has formed some main industrial clusters such as medical and chemical industrial clusters, metal product industrial clusters, electric equipment and electronic manufacturing industrial clusters, and modern construction industrial clusters. In 2010, the GDP of SETDA was 13.5 billion USD ranking seventh among the 90 national-level EDTAS (MPRC's Statistics). The material flow and energy flow are shown in Figure 2.
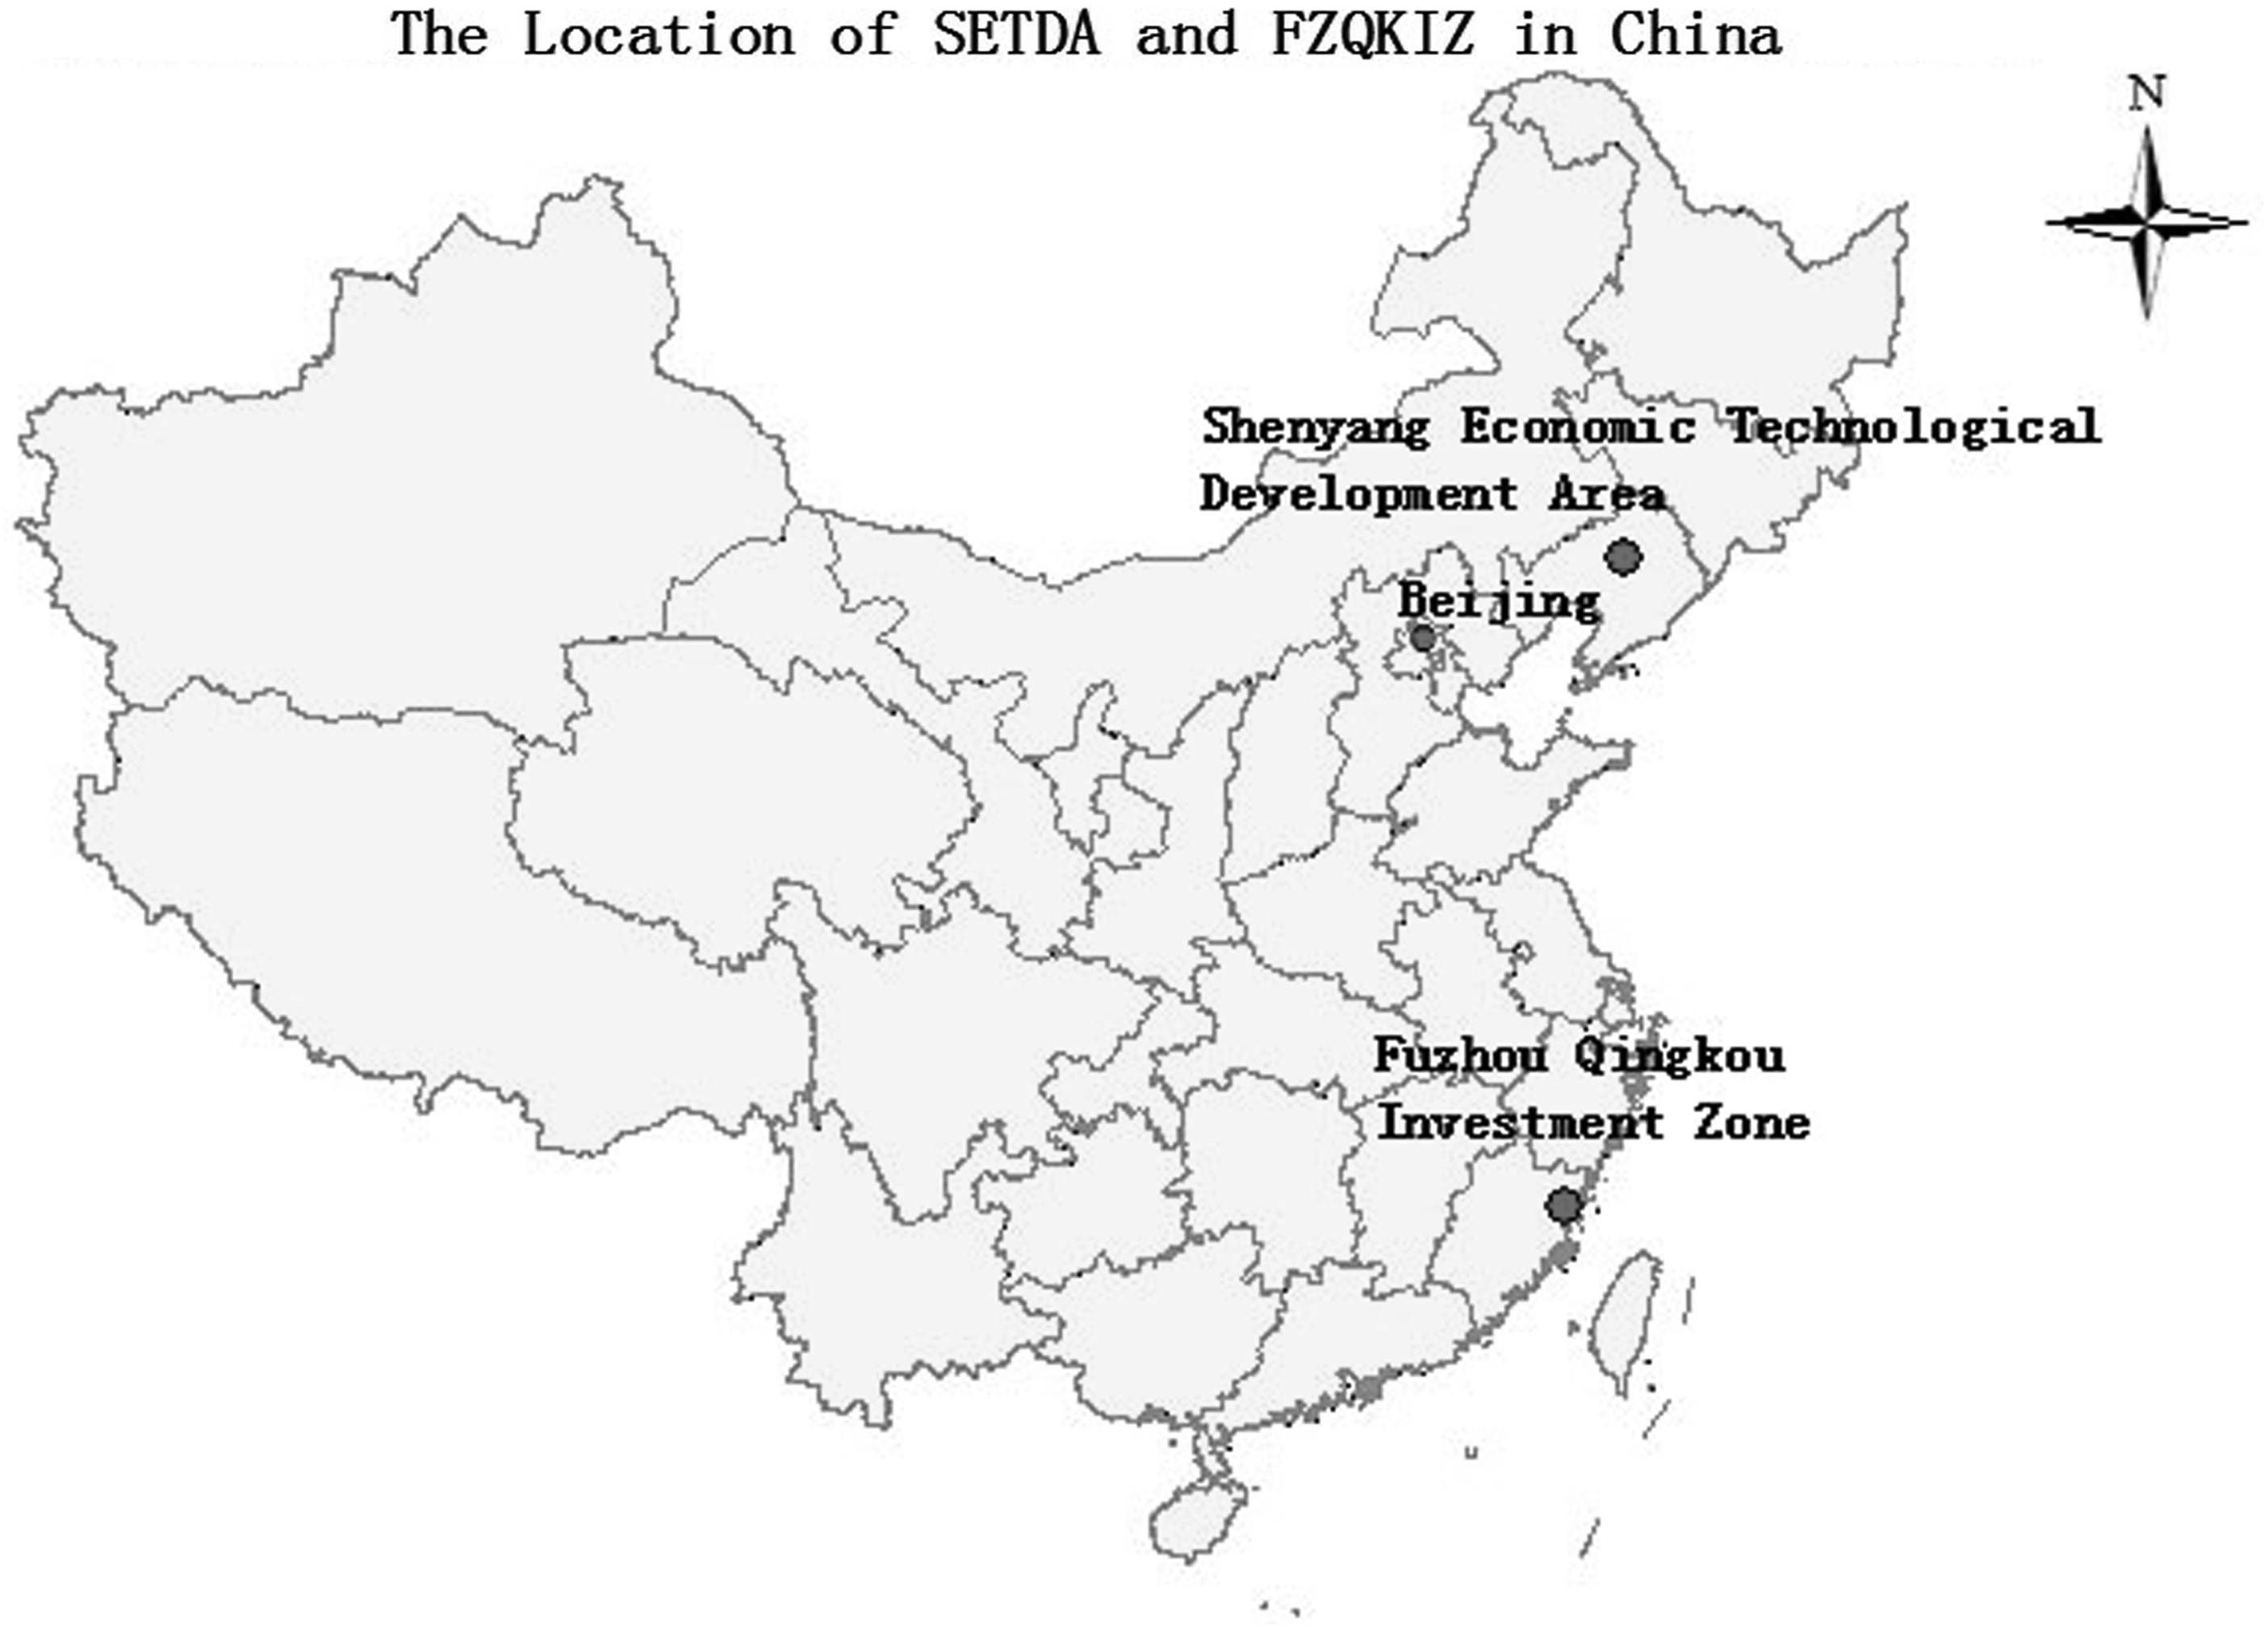
Location of Shenyang economic technological development area (SETDA) and Fuzhou Qingkou investment zone (FZQKIZ).
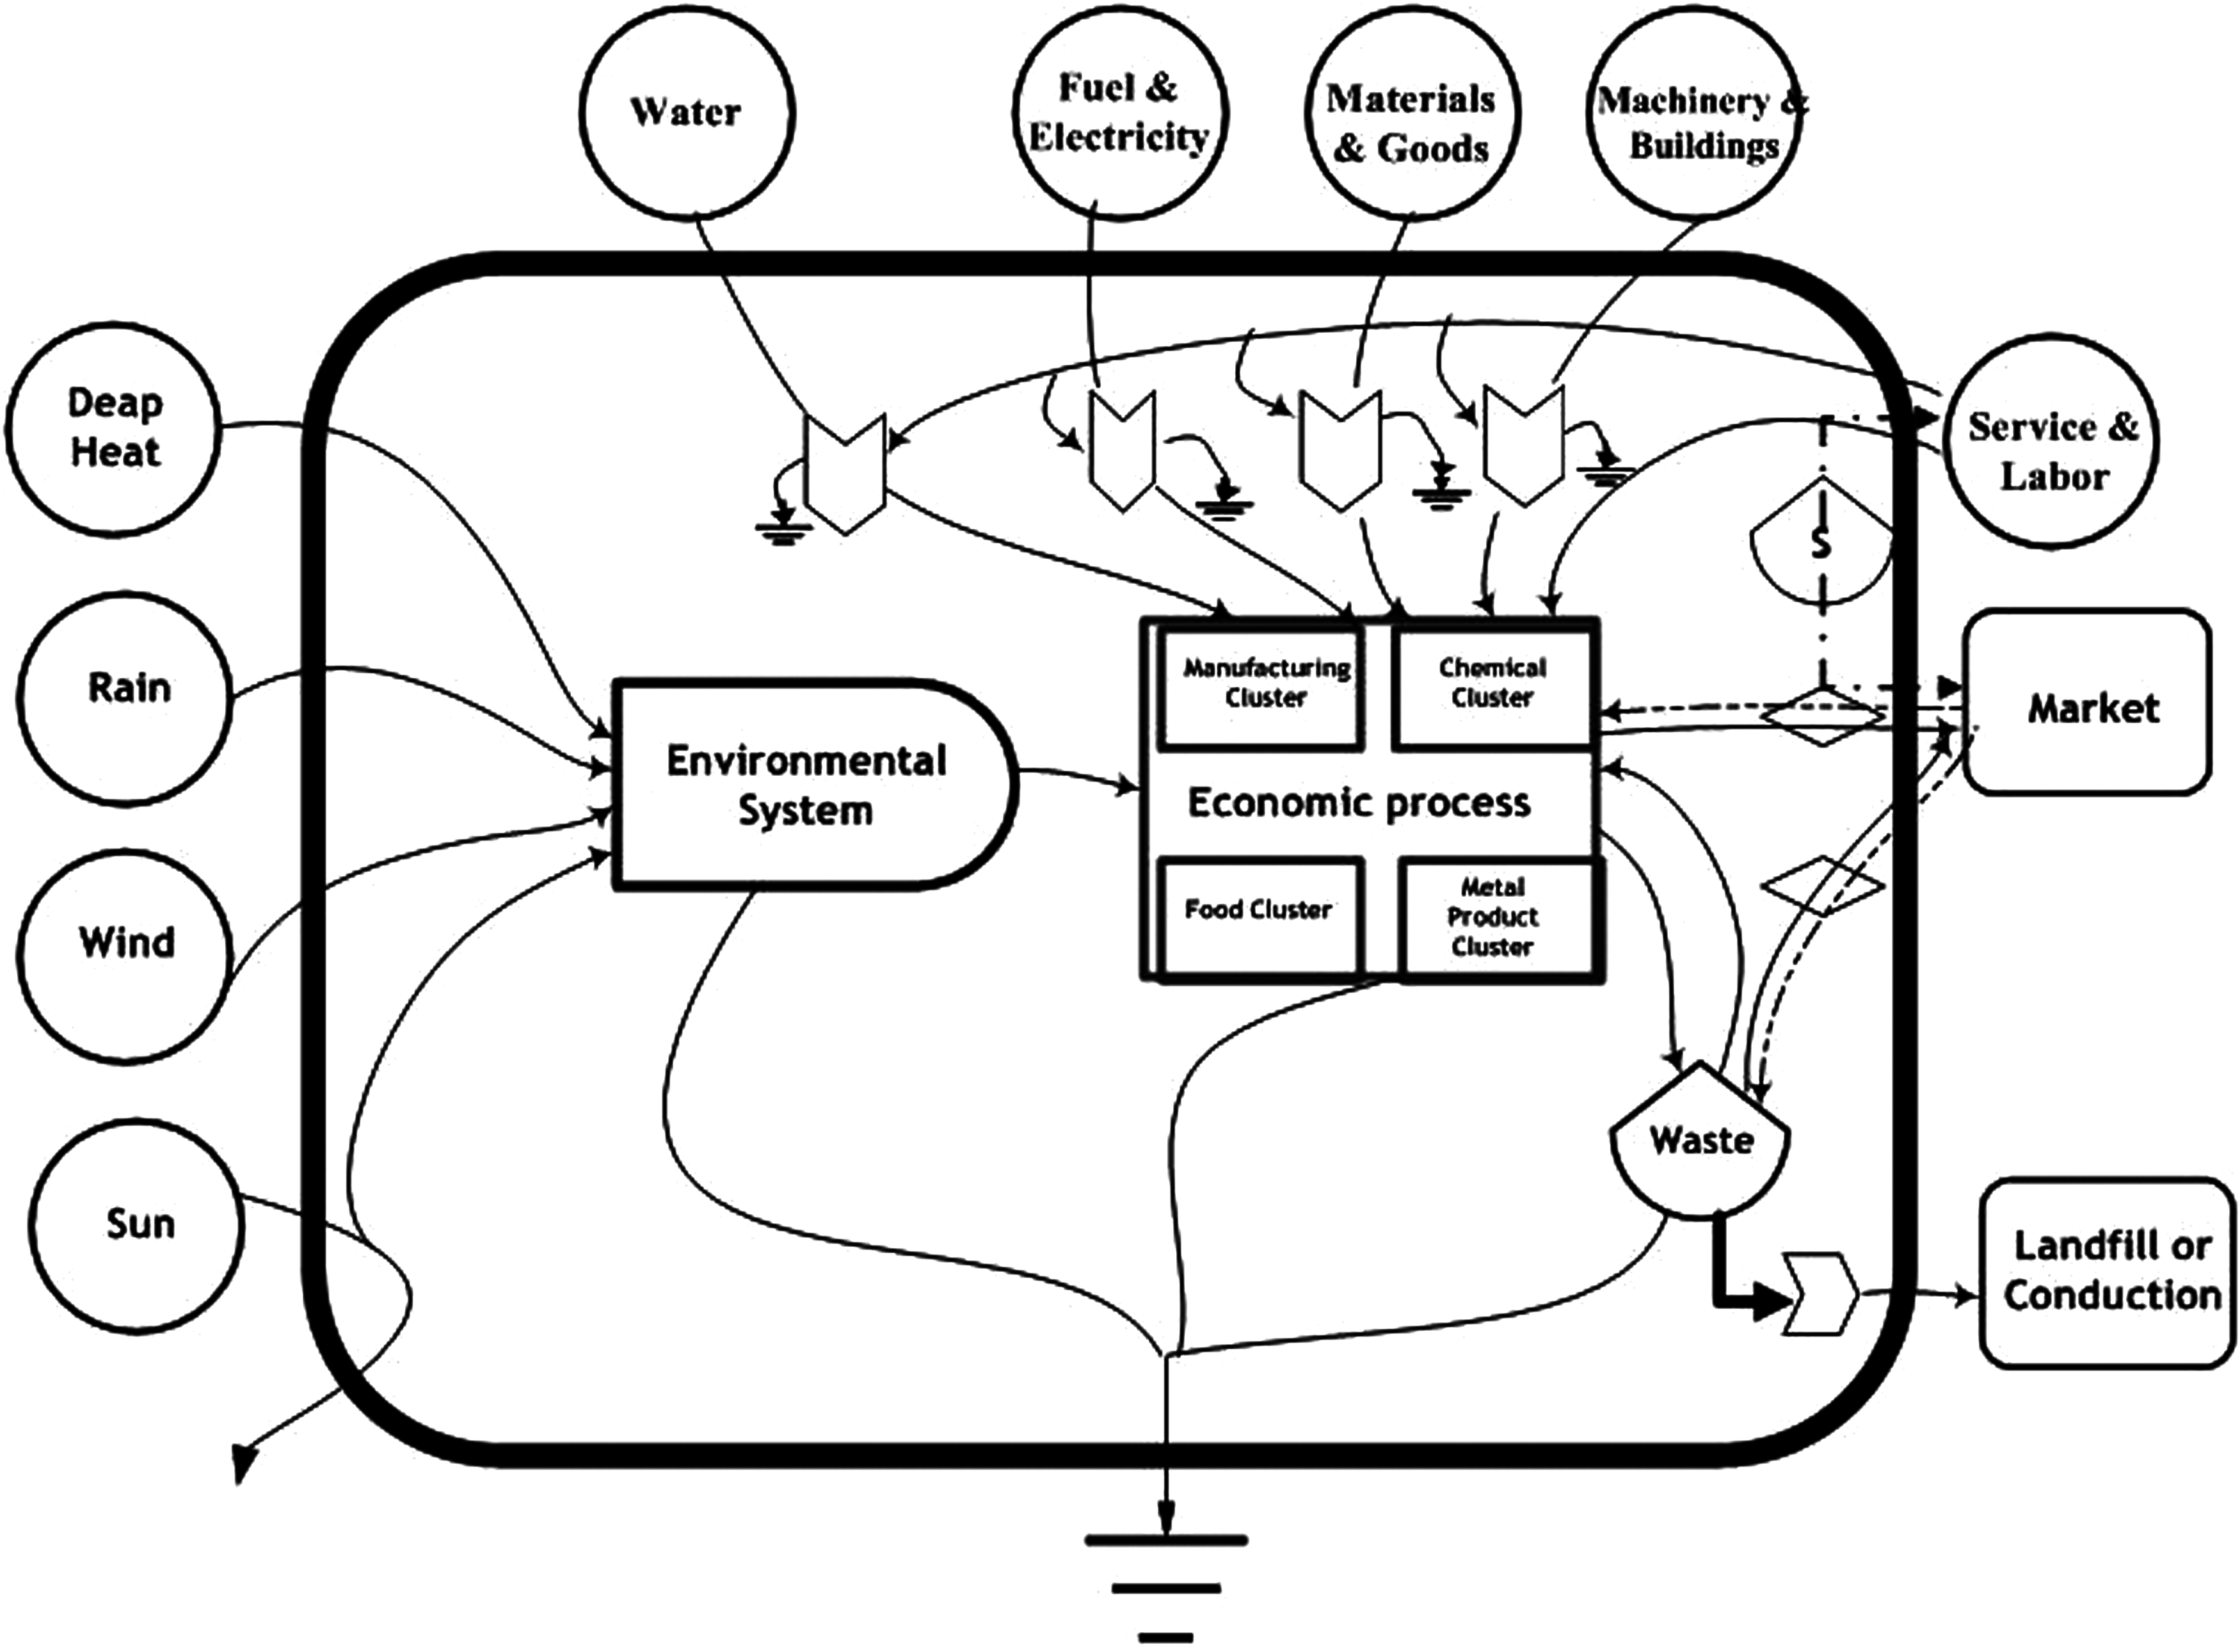
Emergy flow diagram of SETDA.
FZQKIZ is located in the southeast of Minhou County and 25 km from the center of Fuzhou city (Fig. 1). FZQKIZ is an area nearby the ocean and the average annual rainfall and wind velocity are 1.6 m and 2.8 m/s, respectively. FZQKIZ was established in 1991 with an area of 56 km2. FZQKIZ is a mainly vehicle-oriented industrial park. In 2007, FZQKIZ realized a GDP of 0.26 billion USD. The emergy flow diagram is shown in Figure 3.
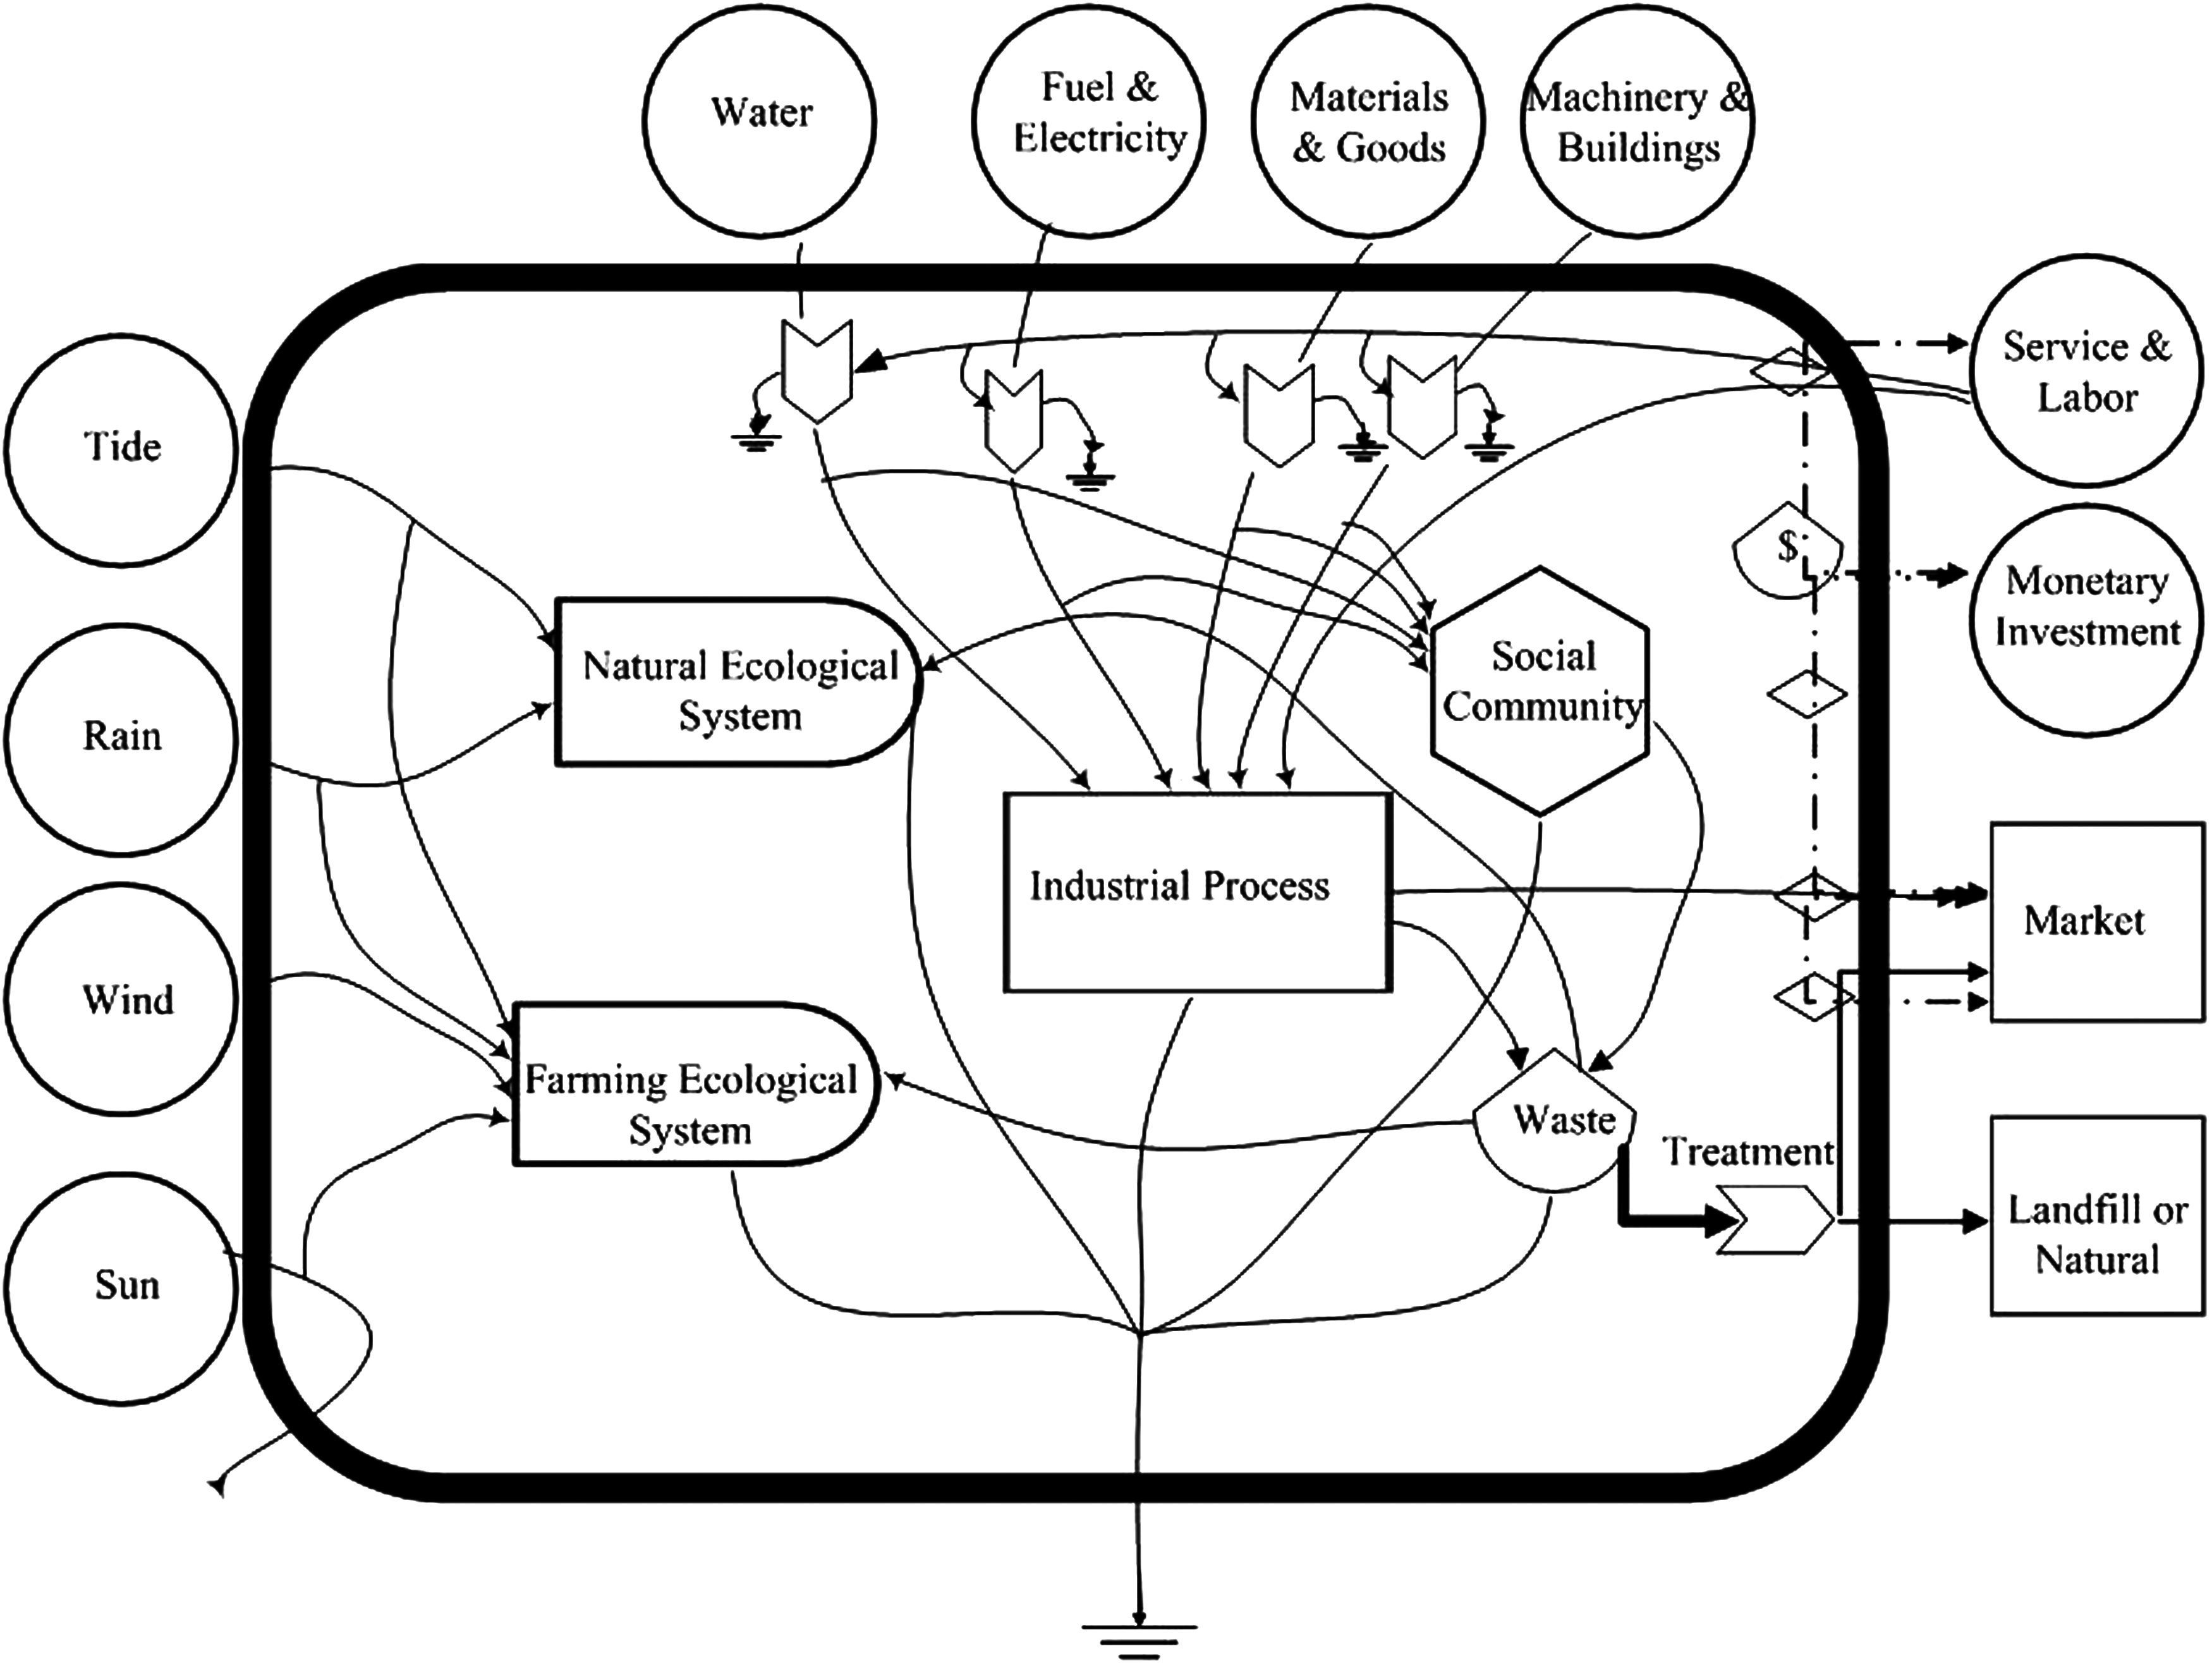
Emergy flow diagram of FZQKIZ.
The reason why this study selected these two industrial parks as our case studies was because these two industrial parks could be classified as two distinctive types. For instance, SETDA belongs to a comprehensive industrial park that is formed of some main industrial clusters, while FZQKIZ is a sector-specific industrial park, which is mainly on vehicle industries as well as with some agricultural products. From our previous study, we found that SETDA consumed more energy and resources during industrial processes than FZQKIZ because of more intensive metabolism during the industrial process in SETDA. This study aims to validate emergy-EF hybrid through these two different kinds of industrial parks to show that the potential application of this method could provide the information not only on the industrial metabolism itself but also on showing a whole picture of an area.
Results
Statistical data for the year 2006, including materials data, energy data, and even natural resource data of the two industrial parks, were obtained through field survey, informal interviews, and reference reviews. After data collection and classification, we transformed these data to solar emergy by corresponding transformities (Tables 1 and 2).
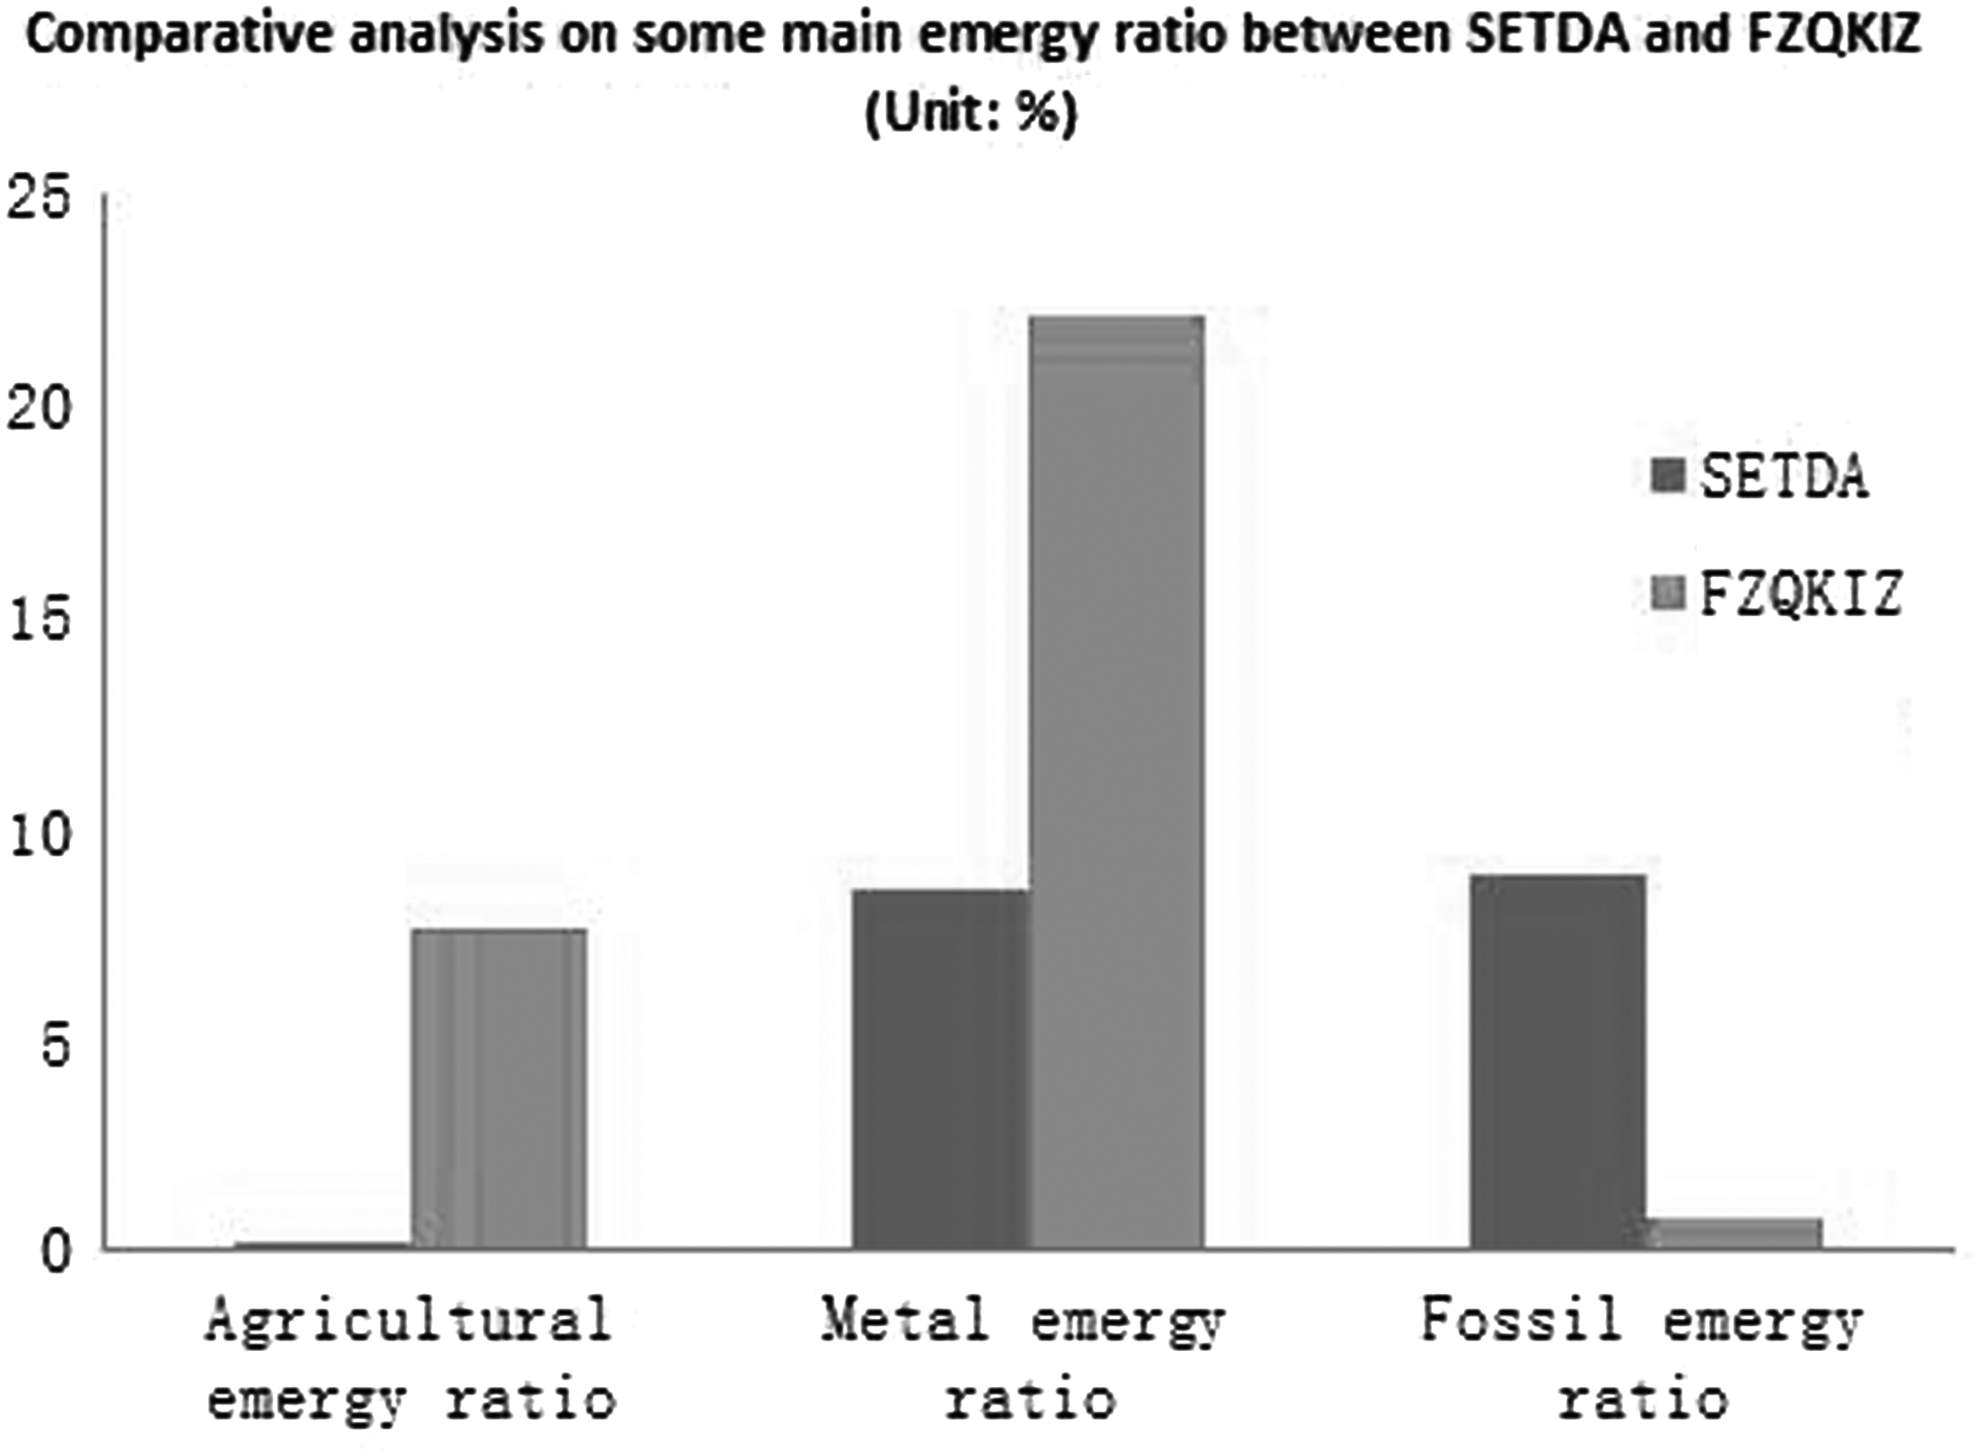
From Tables 1 and 2, the structural emergy flow was obtained for R, N, F, L, and S for the year 2006 for SETDA and FZQKIZ, respectively (Figs. 4 and 5). From the results, we could see that the total emergy consumed in SETDA was much higher than for FZQKIZ. The reason for this difference was because the industrial scale of SETDA was much larger than FZQKIZ. Furthermore, the industrial structural types in SETDA were also more diverse than in FZQKIZ. The ratio of R, N, F, or L&S was similar for SETDA and FZQKIZ, in which F and L&S accounted for the most part in total emergy values during the industrial activities. In Figure 5, the agricultural emergy ratio (wheat, pork, fruit, vegetable, etc.), metal emergy ratio (steel, copper, etc.), and fossil emergy ratio (coal, fuel oil, gasoline, etc.) accounted for the total emergy in SETDA and FZQKIZ. The results showed that the metal emergy ratio and agricultural ratio were higher in FZQKIZ, while the fossil emergy ratio was lower. That was because FZQKIZ mainly depended on vehicle and relevant industries, for which metals were the raw materials. Besides, FZQKIZ was a less industrialized area where there also existed some agricultural production, which resulted in a higher agricultural emergy ratio in FZQKIZ. SETDA had a heavy industrial base, in which most of the industries relied on much energy supply. That is why the fossil emergy ratio was higher in SETDA than in FZQKIZ.
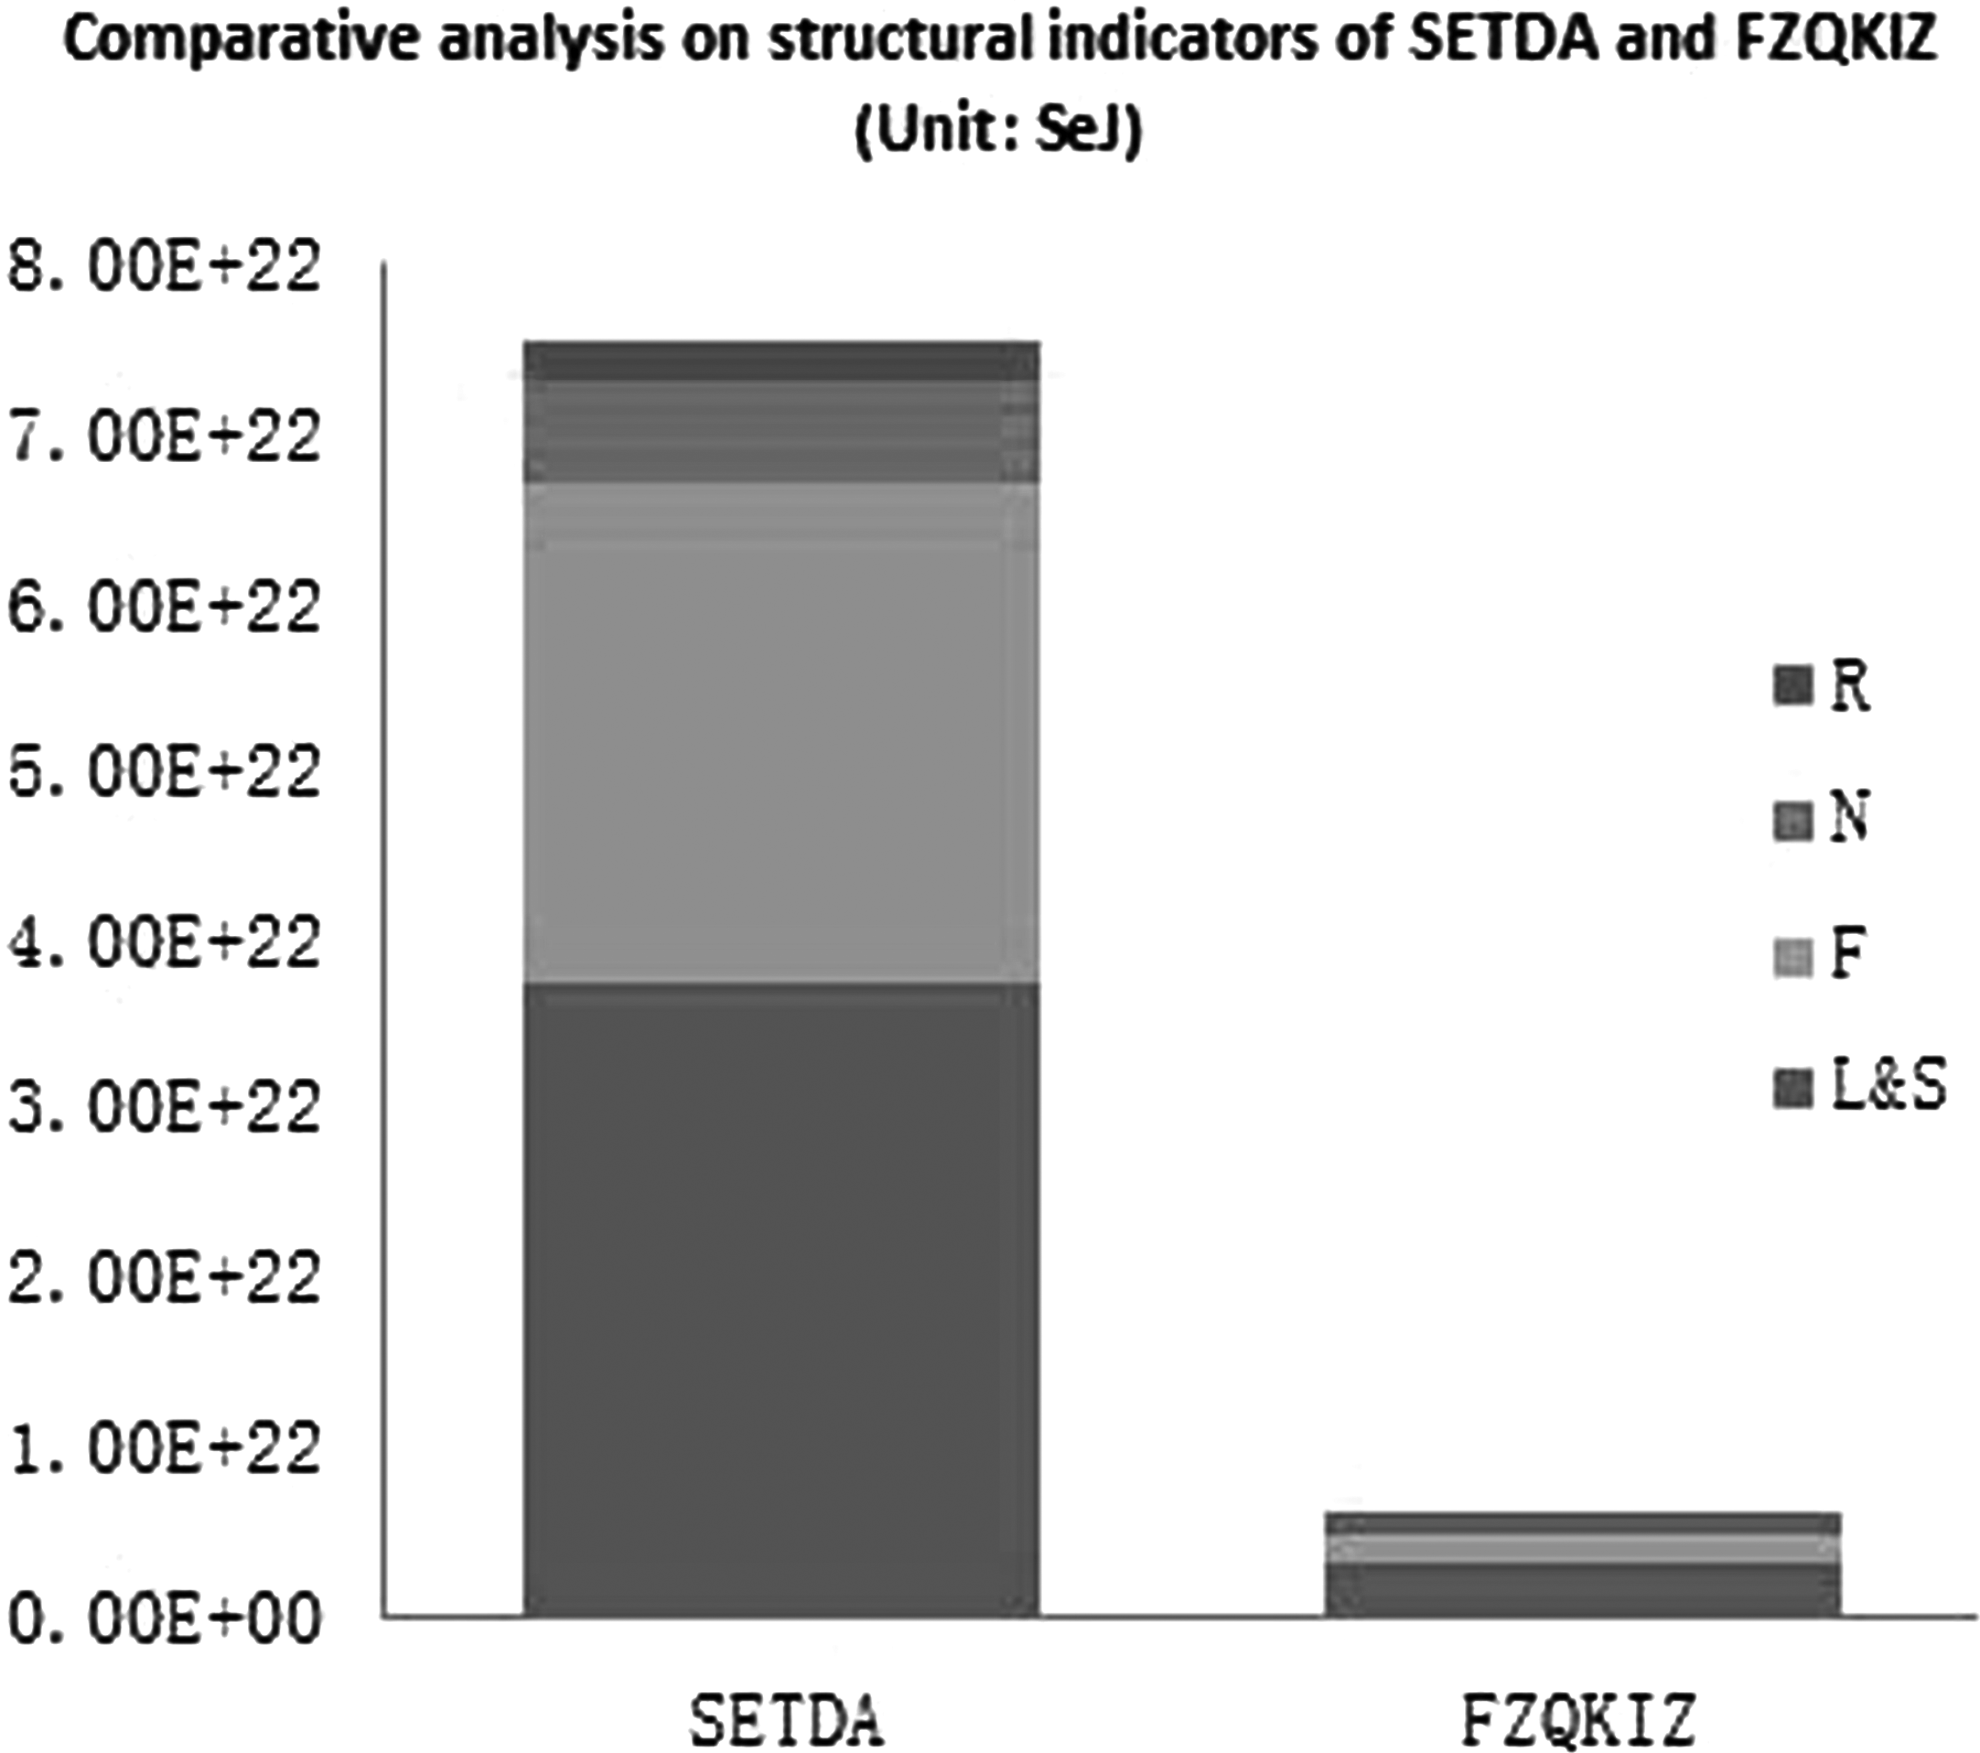
Composition emergy indicators of SETDA and FZQKIZ.
Some main emergy indicators of resource ratio between SETDA and FZQKIZ.
Using Equations (1–7), emergy and emergy footprint indicators for the two industrial parks were calculated (Table 3). From the results, we can see that FZQKIZ’ s EYR was bigger than SETDA's, which meant that FZQKIZ was more reliant on local resource to fulfill the demands of industrial production. SETDA caused more environmental burden because its ELR value was higher compared with FZQKIZ. Comparing the two industrial parks by the sustainable indicator ESI, FZQKIZ was more sustainable than SETDA as its ESI was higher. However, from the perspective of emergy-EF indicators, SETDA's ecological carrying capacity was stronger than FZQKIZ's. Although EF of SETDA was also higher, ecological surplus was even bigger. This indicated that the local ecological environment of SETDA could provide more capability to support industrial activities than FZQKIZ could.
ELR, environmental loading ratio; ESI, emergy sustainability index; EYR, emergy yield ratio; FZQKIZ, Fuzhou Qingkou investment zone; SETDA, Shenyang economic technological development area.
Discussion
SETDA is a mixed industrial complex with a diversified industrial structure, which includes several major industries such as chemical, manufacturing, and electronic industries. That is why there were more material emergy flows in SETDA (Table 1). Some kinds of material emergy in SETDA were high. For instance, rubber and plastic emergy had the highest value reaching 1.31E+22 seJ, steel and pig iron, clay, coal, and slag emergy were all beyond E+21 seJ. That was because these materials were used in the industrial processes in SETDA. For example, rubber was used for chemical industries, slag was the main product from the metal production, coal was the main material for generating electricity, and steel was the main resource for machinery industries. However, in FZQKIZ, only steel solar emergy was over E+21 seJ as it was the main raw material for vehicle-oriented industries.
Compared with SETDA, FZQKIZ relied more on local resources, which resulted in higher EYR. FZQKIZ has an advantageous geographic position, which could provide more raw materials for industrial production. Through emergy analysis, the authors found that FZQKIZ was more sustainable than SETDA because the indicator ESI of FZQKIZ was higher than SETDA. The main reason for this was that SETDA had a higher ELR than FZQKIZ, which meant that SETDA contributed more environmental burden to the ecological system during its industrial activities. If we analyzed these two areas by the emergy-footprint hybrid method, we found that SETDA's ecological carrying capacity was 1.11E+11 seJ/m2, while FZQKIZ's ecological carrying capacity was 2.54E+10 seJ/m2. That was because more renewable emergy of SETDA was involved in industrial production such as geothermal heat emergy. We also could get the ecological surplus values for the two industrial parks during their industrial activities by applying the emergy-footprint hybrid method. The results showed us that ecological surplus of SETDA was more than FZQKIZ, which meant that the local ecological system of SETDA could provide more capability to support industrial activities than FZQKIZ could.
The method of emergy-EF hybrid overcame the weakness that only focused on energy metabolism of a targeted system, while ignoring the feedback from the ecological system of a local area. Therefore, this hybrid method evaluated energy metabolism of industrial activities from a larger perspective than if only targeted systems were concerned. This method also inherited the advantage of emergy that it recorded the ecological contribution during the industrial process. However, we should test more to confirm whether improved emergy indicators were accurate or not for a systematic evaluation. Furthermore, some more discussions will be needed to validate this hybrid method properly on an industrial park system.
Undoubtedly, the investigation process was not easy as it might appear in this study. The field survey and data collection process was a time-consuming and energy-consuming activity, which could be more difficult if there was a lack of local scale data bases. Furthermore, although there are updated transformities for different items in published literature, their targets might not be appropriate for a different case. In emergy analysis, calculating all the transformities was unimaginable and getting the transformities for new items was also a big challenge due to lack of reference studies. These difficulties were found, however, not only in emergy analysis but also in other evaluation methods such as LCA and material flow accounting.
Generally, from case studies of the SETDA and FZQKIZ, we can see that emergy-EF hybrid provides an overall view of an industrial system and its local ecological environment. It has advantages over other methods for evaluating industrial park's efficiency as it can reveal the value that free environmental services and resources contribute to the industrial parks, especially when the decisions need to be made regarding sustainability. Then it could be deduced how the local ecological environment reacts to industrial activities happening inside an industrial park. Thus, it can be an important complementary tool to the existing tool set for managers and administrators managing their industrial parks. This study sets the foundation for broadening investigation of emergy-EF hybrid analysis for industrial parks.
Footnotes
Acknowledgments
This work is supported by the Natural Science Foundation of China (71325006, 71033004, 71311140172, 31170478) and the Ministry of Science and Technology (2011BAJ06B01). Especially, the authors want to thank those anonymous reviewers for their valuable comments and contributions to the revised version of this article.
Author Disclosure Statement
No competing financial interests exist.