
Abstract
Abstract
A novel solvothermal method for the deposition of Fe3O4 nanoparticles on the surface of graphene oxide (GO) with different ratios was developed. Synthesized Fe3O4/GO nanocomposites were characterized using a transmission electron microscope, X-ray diffraction analyzer, X-ray photoelectron spectroscope, vibrating sample magnetometer, and nitrogen adsorption/desorption test. Results of characterization showed that Fe3O4 nanoparticles were homogeneously deposited onto the surface of GO, and the diameters of Fe3O4 nanoparticles of 1:1 Fe3O4/GO nanocomposites and 2:1 Fe3O4/GO nanocomposites were ∼4 and ∼6 nm, respectively. Saturation magnetizations reached 9.58 and 15.14 emu/g for 1:1 Fe3O4/GO and 2:1 Fe3O4/GO, respectively. Adsorption experiments were carried out subsequently to investigate the adsorption kinetics and isotherms of 17β-estradiol (E2) and Pb(II) onto Fe3O4/GO. In addition, effects of pH on the adsorption of E2 and Pb(II) were also studied. Most interestingly, synergistic adsorption between E2 and Pb(II) was found when different ratios of E2 and Pb(II) were used. In the mixture, adsorption capacity of 10 mg/L of Pb(II) was increased from 14.8 to 20.8 mg/g with the increasing concentration of E2. The possible reason for explanation was discussed.
Introduction
P
Approaches to remove these two types of pollutants separately in water, such as ion exchange, chemical precipitation, photodegradation, adsorption, oxidation, and chelation, have been extensively investigated (Zhang and Zhou, 2005, 2008; Zhao et al., 2008; Fu and Wang, 2011; Stalter et al., 2011; Madadrang et al., 2012; Zhang et al., 2012a). However, industrial wastewater is complex, and when multiple pollutants are present, adsorption shows great advantage owing to its easy use and low cost. To our knowledge, heavy metals and organic pollutants could coexist extensively in wastewater. As in here, we chose E2 and Pb (II) to represent EDCs and heavy metals because of their worldwide existence and serious damage. Some studies investigated the interactive adsorption mechanisms among different kinds of heavy metal ions, and others studied the co-existence effects of different types of EDCs (Pan and Xing, 2010; Machida et al., 2012). However, the simultaneous removal of heavy metals and EDCs through adsorption is rarely studied (Chen et al., 2008).
Graphene oxide (GO) is a novel and versatile carbon nanomaterial. It has strong mechanical strength, excellent thermal conductivity, and extremely high specific surface area (Loh et al., 2010; Novoselov et al., 2012). In addition to the high adsorption capacity and chemical stability, the abundance of carboxyl/carbonyl, hydroxyl, and epoxy groups on GO can also promote the adsorption through functionalization (Dreyer et al., 2010; Zhao et al., 2011). However, it is difficult to collect GO by centrifugation, precipitation, or filtration because of its small particle size. With the introduction of magnetic separation technology, the use of GO as a promising adsorbent in aqueous environment is revitalized (Dreyer et al., 2010; Sun et al., 2011). Magnetic separation technology also makes the recycle of GO a reality, which cuts cost of adsorbents (Sun et al., 2011). Many researchers have studied and optimized the adsorption property of GO materials (Chen et al., 2012). He et al. combined Fe3O4 nanoparticles with GO by covalent bonding, and the adsorption capacity for methylene blue and neutral red cationic dyes reached 190.14 and 140.79 mg/g, respectively (He et al., 2010). By using facile thermodecomposition method, Zhu et al. (2011) synthesized a type of magnetic graphene nanocomposites decorated with core/double-shell nanoparticles. These nanocomposites showed fast and strong adsorption of Cr (VI). In spite of the progress, there is still a need to develop a simpler, milder, and environment friendly method for the preparation and modification of magnetic grapheme oxide (MGO).
This report presents a simpler and milder solvothermal method for the synthesis of Fe3O4/GO nanocomposites, and the adsorption of E2 and Pb(II) separately or as a mixture was carefully investigated.
Experimental
Reagents
GO was purchased from Nanjing XFNANO Materials Tech Co., Ltd. (China). Octanol, octylamine, and Pb(NO3)2 were obtained from Sichuan Chemical Co., Ltd. Fe(acac)3 (99.9% purity) was purchased from Sigma-Aldrich. E2 was obtained from Alfa Aesar. Methanol was obtained from Tedia. All reagents were of analytical grade and were used without further purification.
Synthesis of Fe3O4/GO nanocomposites
Fe(acac)3 (0.3532 g) and GO (0.1766 g) were dissolved in a mixture of octylamine (10.0 mL) and octanol (24.0 mL). The solution was transferred into a Teflon-lined autoclave. After that, the autoclave was sealed and heated to 110°C for 1 h to remove the trace of oxygen and moisture, and then maintained at 240°C for 2 h in an oven. After reaction, the autoclave was cooled to room temperature and 30 mL ethanol was added to the black-colored mixture. The black precipitates were separated by a commercial magnet. After washing with ethanol for several times and drying, 2:1 Fe3O4/GO nanocomposites were prepared. Through the same process, 1:1 Fe3O4/GO nanocomposites were obtained by changing the mass ratio of Fe(acac)3 and GO to 1:1.
Characterization of Fe3O4/GO nanocomposites
A transmission electron microscope (TEM) from Hitachi (model H-800) was used to observe the morphological characteristics of Fe3O4/GO nanocomposites.
X-ray diffraction (XRD) analysis was performed using a Rigaku D/max-2400 X-ray Spectrometer with Ni-filtered Cu Kα radiation. The XRD analyzer was operated at 40 kV and 100 mA. The scan speed was set at 2° min−1, and the range of 2 theta was set from 20 to 80.
A PHI Quantera X-ray photoelectron spectroscope (XPS) using monochromatic Al Kα radiation (225 W, 15 mA, 15 kV) was used to further analyze the chemical composition of these nanocomposites.
The magnetic properties of Fe3O4/GO nanocomposites were tested by using a LakeShore-7304 vibrating sample magnetometer (VSM) at room temperature.
An ASAP2010 gas sorption analyzer (Micromeritics) was hired to conduct nitrogen adsorption/desorption test. The specific surface area was calculated using the Brunauer–Emmett–Teller (BET) equation.
General procedure of adsorption study
A stock solution of 100 mg/L of E2 or Pb(II) was prepared with methanol and diluted to different concentrations with deionized water when necessary (Zaib et al., 2012; Lin et al., 2013). Experiments were conducted in an air-bath shaker, which was stirred at 30°C with a speed of 180 rpm. After adsorption, Fe3O4/GO nanocomposites were separated by a magnet. All parallel (in duplicate) and control experiments were conducted under the same conditions.
Concentration of E2 was detected with high-performance liquid chromatography (HPLC; Agilent LC1200). The mobile phase used for HPLC was a mixture of methanol and water (70:30, v/v) with a flow rate of 1.0 mL/min. The UV detector was operated at 200 nm. The concentration of Pb(II) was measured by inductively coupled plasma-atomic emission spectrometry (ICP-AES, IRIS-advantages; Thermo Fisher Scientific Co., Ltd.).
Adsorption experiments were carried out to investigate the adsorption kinetics and isotherms of the adsorption of E2 and Pb(II) onto Fe3O4/GO. The effect of pH on adsorption was also investigated. Furthermore, the effect of different concentrations of E2 and Pb(II) on the adsorption of Pb(II) and E2 was studied, respectively. Except for the adsorption kinetics and equilibrium time determination, all experiments were conducted with the same dosage of 0.5 g/L of 2:1 Fe3O4/GO and sampled at equilibrium time. The experimental procedure and models used for the determination of equilibrium time, adsorption kinetics, and isotherms are listed as follows.
Equilibrium time determination
To determine the equilibrium time of adsorption, 0.1–1 g/L 1:1 Fe3O4/GO adsorbents and 2:1 Fe3O4/GO adsorbents were added into 10 mg/L E2 solution followed by sampling at a time of 0.5, 1, 2, 4, 6, 8, 10, and 12 h. With the same conditions and processes, 0.5 g/L 1:1 and 2:1 Fe3O4/GO adsorbents were added into 10 mg/L Pb(II) solution. The adsorption amount Qt of E2 or Pb(II) was calculated by Equation (1) as follows:
where C0 and Ct are, respectively, initial concentration and concentration at time t (mg/L), V is the solution volume of E2 or Pb(II) (L), and m is the adsorbent dosage (g).
Adsorption kinetics
With pseudo-first-order and pseudo-second-order reaction model, as shown in Equation (2) and (3), adsorption kinetics of E2 and Pb(II) onto Fe3O4/GO were calculated. The kinetics models are written as follows (Deng et al., 2010; Feng et al., 2010; Koç et al., 2011):
where Qe and Qt are equilibrium adsorption capacity and adsorption amount at time t (mg/g), k1 and k2 are adsorption rate constants (h−1 and g/[mg·h]), and t is adsorption time (h).
Adsorption isotherms
To determine adsorption isotherms, initial concentrations of E2 and Pb(II) solution were, respectively, set at 5–10 mg/L and 10–60 mg/L (Huang et al., 2011; Zhang et al., 2012b). The model of Langmuir and Freundlich adsorption isotherms (Huang et al., 2011; Joseph et al., 2011; Zhang et al., 2012a), as shown in Equation (4) and (5), was used to investigate the adsorption mechanism of E2 and Pb(II) on Fe3O4/GO, respectively.
where Qe and Qmax are equilibrium adsorption capacity and monolayer adsorption saturation capacity (mg/g), Ce is equilibrium concentration (mg/L), KL is Langmuir adsorption constant (L/mg), KF is Freundlich adsorption constant (mg1–1/n L1/n/g), and 1/n is the heterogeneity factor.
Investigation of pH effect and synergistic effect
To investigate the effect of pH on the adsorption by Fe3O4/GO adsorbents, the adsorption at various pHs was determined. By titrating with 0.1 M HCl or 0.1 M NaOH, initial pHs were, respectively, set at 3, 5, 7, 9, and 11. Initial concentrations of E2 and Pb(II) were 10 mg/L.
To investigate the effect of Pb(II) concentration on the adsorption of E2, mixture of 10 mg/L of E2 and 10–60 mg/L of Pb(II) were prepared with an equal volume, respectively. All these experiments were conducted at neutral pH. Under the same conditions, the effect of 5–10 mg/L of E2 on the adsorption of 10 mg/L of Pb(II) was also investigated.
Desorption and regeneration
After batch adsorption, desorption and regeneration experiments were conducted to investigate the reusability of Fe3O4/GO adsorbents. The same adsorption and desorption process was repeated five times with the same Fe3O4/GO nanocomposites. Desorption process was started by washing adsorbents with ethanol and deionized water for several times. Then, 50 mL of 0.1 M NaOH was sequentially mixed with adsorbents and transferred into an air-bath shaker. The mixture was shaken at a speed of 150 rpm for 10 h at 30°C to thoroughly complete the desorption process.
Results and Discussion
Characterization of Fe3O4/GO nanocomposites
Morphology of Fe3O4 nanoparticles on GO was examined by TEM under different magnifications. The Fe3O4 nanoparticles are dispersed homogeneously on the surface of GO, as shown in Fig. 1a and c. According to Fig. 1b and d, the diameters of Fe3O4 nanoparticles of 1:1 Fe3O4/GO and 2:1 Fe3O4/GO are 3.98 and 6.11 nm, respectively. The insert photographs in Fig. 1b and d are selected-area electron diffraction of Fe3O4 nanoparticles of both nanocomposites. The distinct rings caused by Fe3O4 nanoparticles in both nanocomposites indicate their polycrystal nature (Huiqun et al., 2006; Shen et al., 2010).
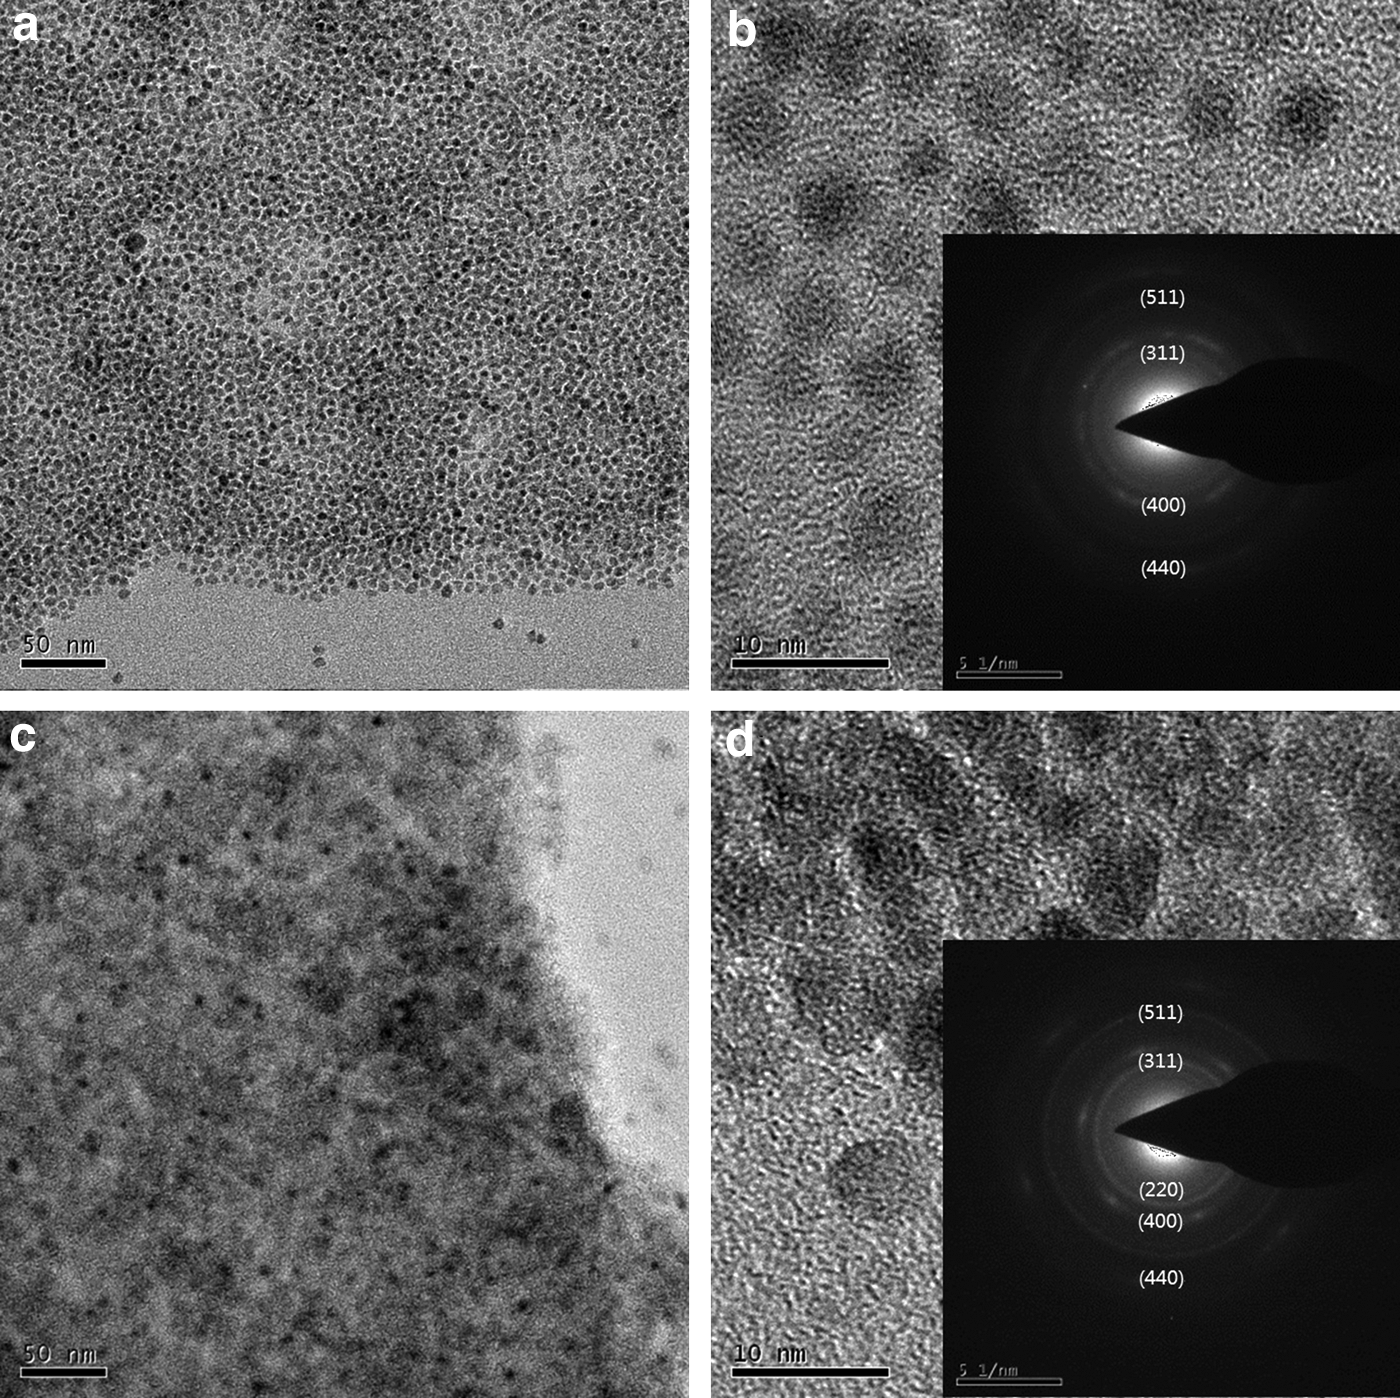
TEM images of 1:1 Fe3O4/GO
XRD and XPS were employed to identify the specific nanoparticles anchored on the surface of GO. Figure 2a–c show the structure information of 2:1 Fe3O4/GO, 1:1 Fe3O4/GO and pure Fe3O4 nanoparticles, respectively. Compared with the pure Fe3O4 nanoparticles, reflections of (220), (311), (400), (511), and (440) caused by these two as-prepared Fe3O4/GO nanocomposites are exactly the same as those caused by pure Fe3O4 nanoparticles (JCPDS card No. 19-0629). It was confirmed that Fe3O4 nanoparticles were successfully deposited onto the surface of GO. Moreover, the graphite structure in GO was identified by the intensity peak of (002) at 23.0o (Deng et al., 2010; Fan et al., 2010). By using Debye–Scherrer formula, the calculated crystal particle sizes of Fe3O4 nanoparticles of 1:1 Fe3O4/GO and 2:1 Fe3O4/GO were 4.15 and 5.91 nm, respectively, which were remarkably consistent with the sizes determined by TEM. XPS was used to further verify the structure and composition of these two nanocomposites. Figure 3a and b show full scan spectra of 1:1 Fe3O4/GO and 2:1 Fe3O4/GO, in which the intensity peaks of C 1s, O 1s, and Fe 2p are acquired at binding energies of approximately 284.7, 530.3, and 711.2 eV, respectively. The peaks of Fe 2p 1/2 and Fe 2p 3/2 of both as-prepared nanocomposites at 724.7 and 711.1 eV, as shown in the insert plots of Fig. 3, are consistent with the peaks of Fe 2p of Fe3O4 (Tian et al., 2011). The deconvolution of O 1s, as shown in Fig. 3c and d, reveals three peaks at 533.3, 531.2, and 530.2 eV, which correspond to the carboxyl group and carbonyl group in GO and oxygen in Fe3O4, respectively (Wu and Xu, 2005; Yang et al., 2009). Thus, it could be further proved that the sites of epoxy/hydroxy groups in GO were mostly replaced by Fe3O4 nanoparticles, and these nanoparticles were deposited on the surface of GO.

XRD patterns of
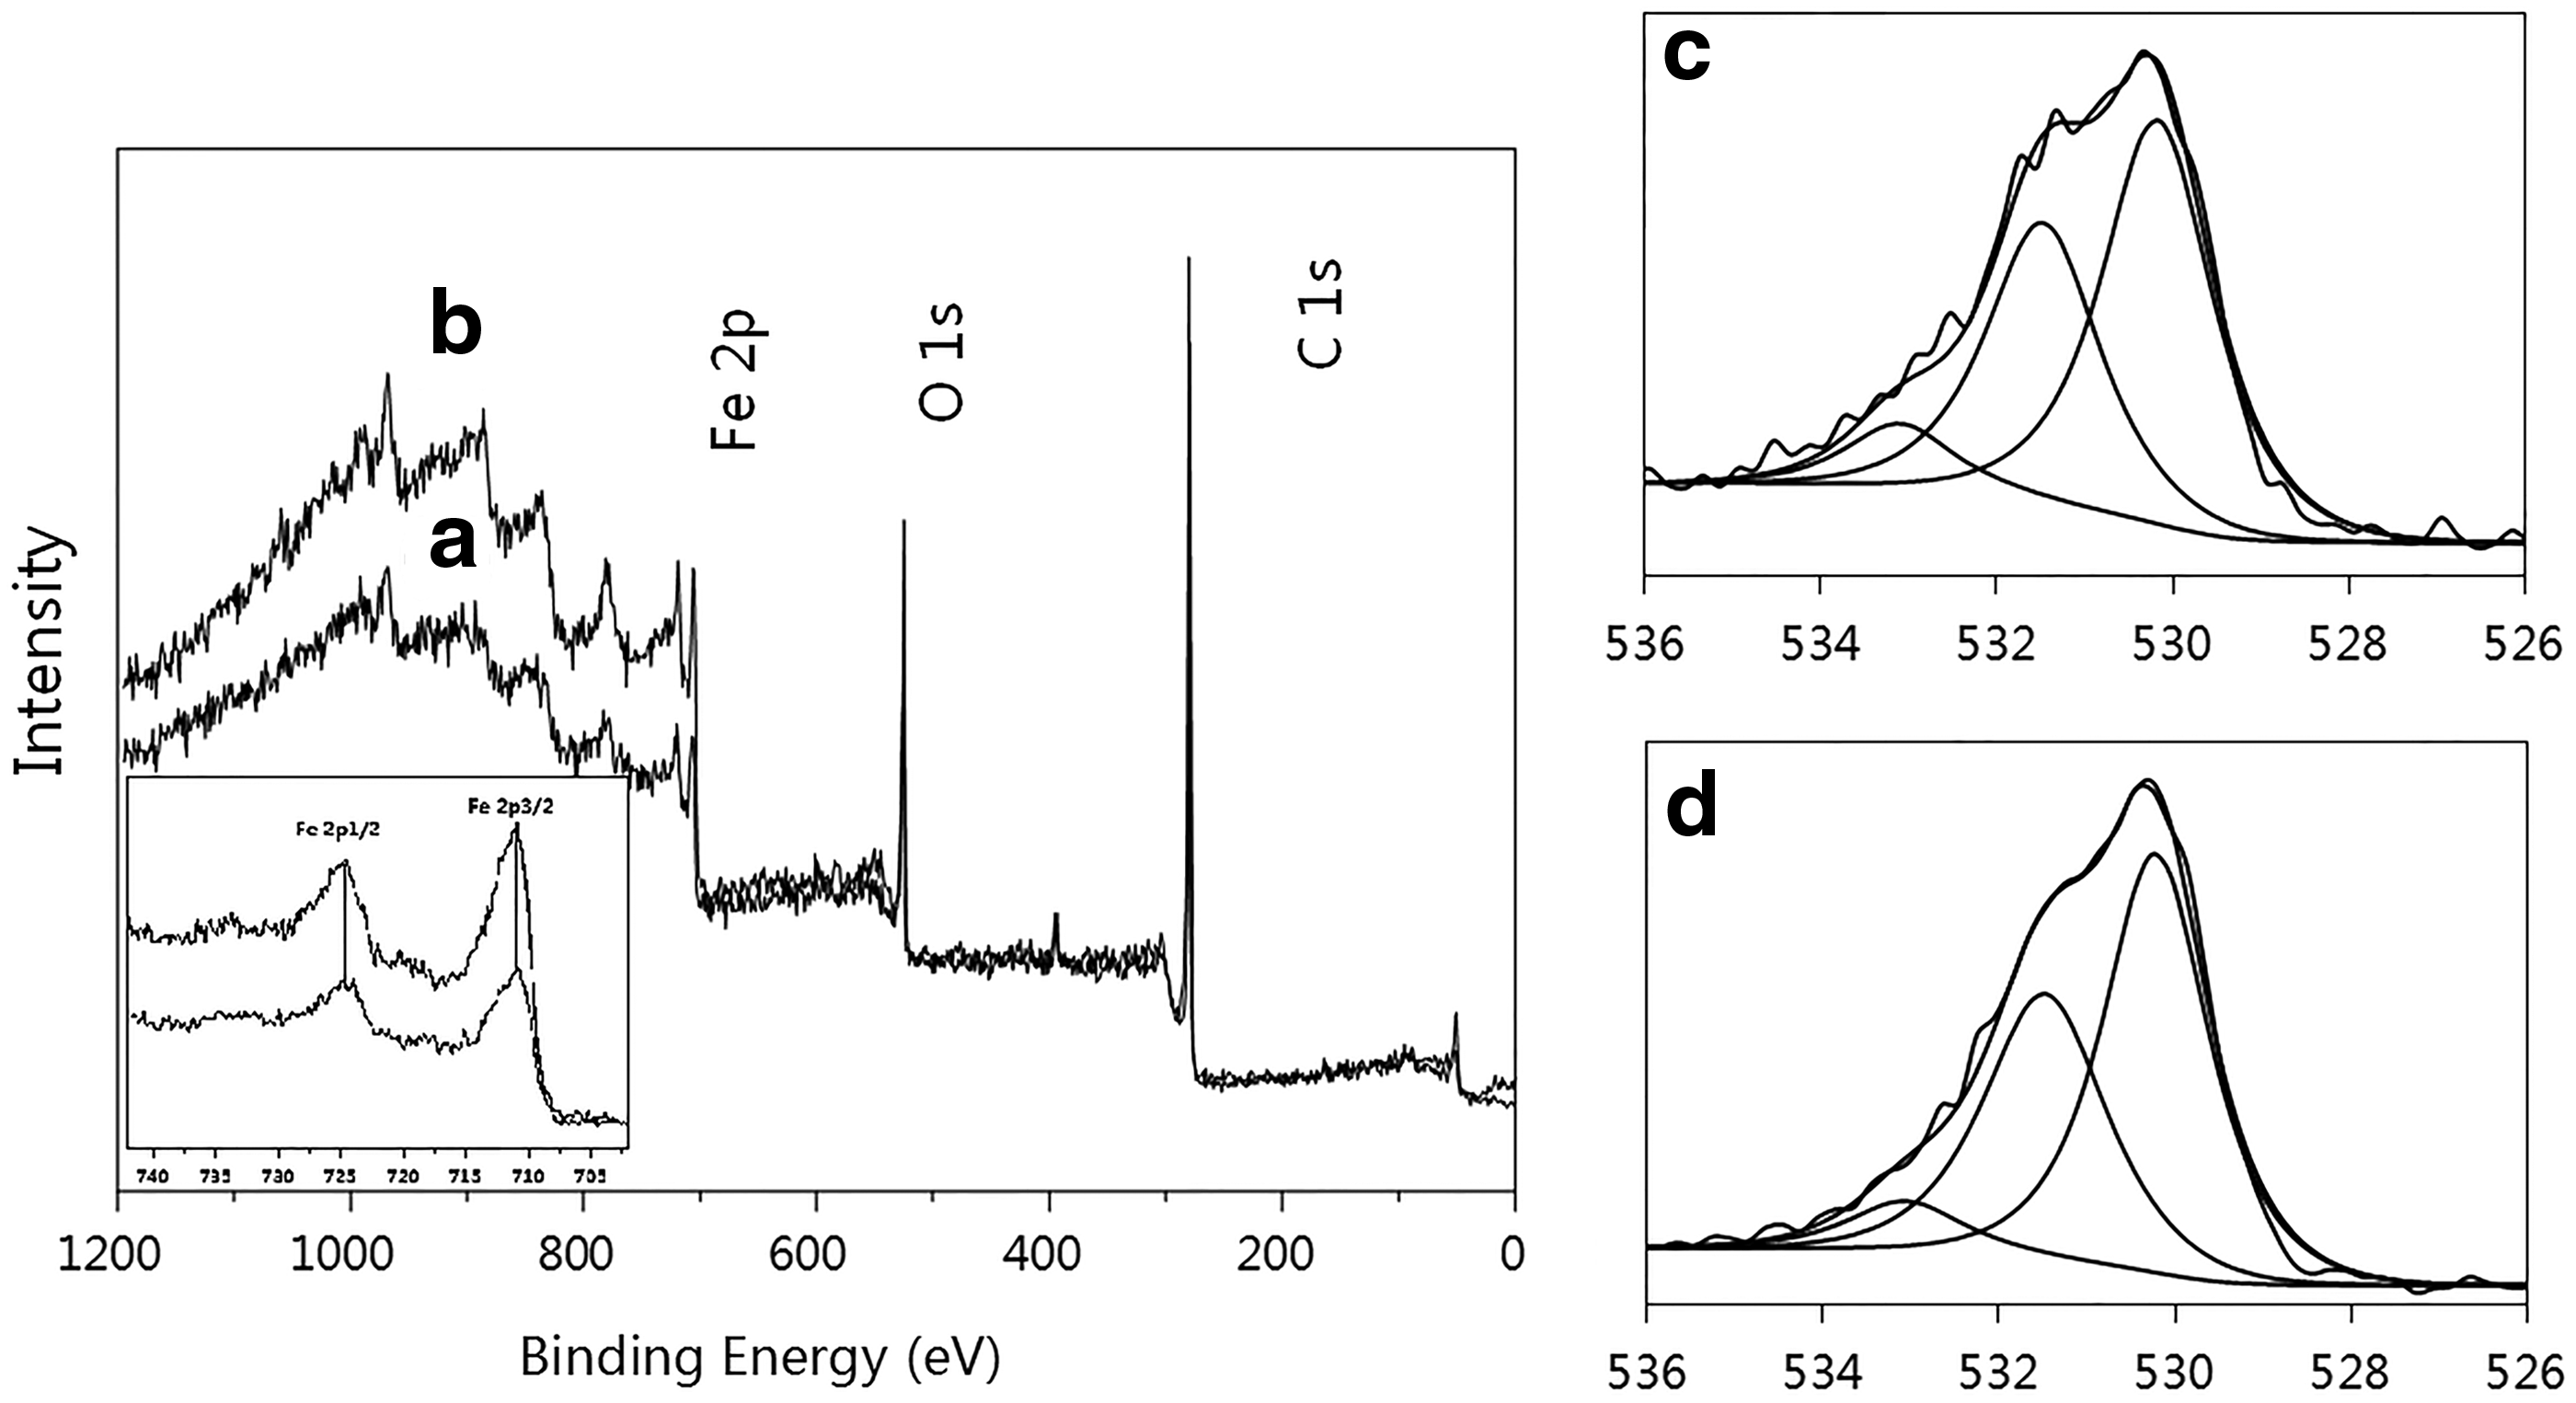
XPS spectra of 1:1 Fe3O4/GO and 2:1 Fe3O4/GO.
Magnetic hysteresis curves from VSM in Supplementary Fig. S1 show that the saturation magnetizations of 1:1 Fe3O4/GO and 2:1 Fe3O4/GO are 9.58 and 15.14 emu/g, respectively. With superparamagnetic property, both nanocomposites also presented no coercivity and remanence at room temperature. Furthermore, an easy separation of nanocomposites from wastewater can be realized by using a commercial magnet in a few seconds. Thus, both nanocomposites can potentially be used in wastewater treatment.
BET surface area of GO, 1:1 Fe3O4/GO, and 2:1 Fe3O4/GO was calculated to be 171.41, 238.35, and 203.72 m2/g, respectively.
Equilibrium time of adsorption
Time courses of adsorption of E2 by 1:1 Fe3O4/GO and 2:1 Fe3O4/GO are presented in Supplementary Fig. S2a and b. Supplementary Figure S2c shows the time course of adsorption of Pb(II) by 1:1 Fe3O4/GO and 2:1 Fe3O4/GO adsorbents. The adsorption rate is extremely high during the first 2 h, because of the abundance of adsorbates and active sites on Fe3O4/GO. With increased incubation time, the adsorption rate becomes constant after 10 h. Therefore, it can be considered that the adsorption reached equilibrium after 10 h. Compared with the adsorption of E2 by granular activated carbon, which showed an equilibrium time of 125 h, the adsorption by Fe3O4/GO nanocomposites was much faster (Zhang and Zhou, 2005). Moreover, other researchers have reported that adsorption of Pb(II) and E2 by functionalized graphene and molecularly imprinted polymers could reach equilibrium within 30–40 min (Deng et al., 2010; Wang et al., 2011).
In this research, adsorption capacity of E2 by 1:1 and 2:1 Fe3O4/GO with a dosage of 0.1–1.0 g/L was 8.08–19.48 mg/g and 7.57–16.05 mg/g, respectively. It indicated that the 1:1 Fe3O4/GO nanocomposites showed a slight advantage in adsorption capacity. When the dosage was increased, the advantage was retained. However, the adsorption capacity of Pb(II) by 2:1 Fe3O4/GO adsorbents was higher than that of 1:1 Fe3O4/GO. In addition, the 2:1 Fe3O4/GO adsorbents had much higher saturation magnetization so that they could be separated by a magnet more conveniently. Therefore, 2:1 Fe3O4/GO adsorbents were a better choice and were used for investigation in the following experiments, excluding adsorption kinetics.
Adsorption kinetics
According to the models and experimental results of Qt at different time, the plots of (a–c) and (A–C) in Supplementary Fig. S3 are pseudo-first order and pseudo-second-order models describing adsorption kinetics for E2 and Pb(II) by Fe3O4/GO nanocomposites, respectively. The linear regression coefficient (R2), Qe, k1 and k2 were obtained from the linear correlation, slope, and intercept of each plot. Specific outcomes are listed in Supplementary Tables S1 and S2.
The R2 of pseudo-first-order model (0.9419–0.9951) and R2 of pseudo-second-order model (0.9796–0.9999) are high, indicating the models are fitting to describe the adsorption kinetics. Moreover, the calculated Qe from pseudo-second-order model was in accordance with the experimental equilibrium adsorption capacity (Qexp) in most cases. In contrast, Qe obtained from pseudo-first-order model failed to agree with Qexp, except for the adsorption of E2 by 2:1 Fe3O4/GO at the dosage of 0.1 g/L. Therefore, the pseudo-second-order model is better used to describe the adsorption kinetics, which is also supported by other reports on the better fitting of pseudo-second-order model (Yu et al., 2011; Ji et al., 2012; Zaib et al., 2012).
Adsorption isotherms
With Qe and Ce representing different initial concentrations of E2 or Pb(II) solution, plots of 1/Qe versus 1/Ce and logQe versus logCe are shown in Supplementary Fig. S4, respectively. R2, Qmax, KL, KF, and 1/n were obtained from the linear correlation, slope, and intercept of each plot. Specific information is listed in Supplementary Table S3.
Both adsorption isotherms can be fitted with high R2 (0.9777–0.9994). However, fitting with Freundlich adsorption, isotherms showed higher R2 (>0.9939) than that with Langmuir adsorption isotherms (R2>0.9777), indicating better fitting with Freundlich adsorption isotherms. Moreover, the calculated parameters of 1/n (lower than 1) further revealed a favorable and normal process fitting with Freundlich adsorption isotherms model (Mi et al., 2012).
Based on the experiment results and Langmuir adsorption isotherms model, the experimental and maximum adsorption capacity of E2 and Pb(II) determined in this study was compared with other adsorbents from previous research (Table 1).
NA, not available.
Fe3O4/GO nanocomposites showed much higher adsorption capacity for E2, with Qmax of 86.96 mg/g and Qexp of 19.48 mg/g, compared with other adsorbents. GO surface offers strong π-π interactions and is highly negatively charged, which contributes to the strong ability to adsorb E2 and Pb(II) (Fan et al., 2013). To better explain the effect of Fe3O4 nanoparticles from Fe3O4/GO nanocomposites, the comparison batch adsorption experiment was conducted using 0.5 g/L of pure GO adsorbents under the same conditions. After 10 h, the adsorption capacity of E2 and Pb(II) reached 8.08 and 9.72 mg/g, respectively. It could be seen that the adsorption capacity of E2 was decreased in order of 1:1 Fe3O4/GO>2:1 Fe3O4/GO>GO. For Fe3O4/GO nanocomposites, it seemed that the π-π conjugation of GO with E2 was not affected by coating with Fe3O4 nanoparticles. The slight increase in E2 adsorption may be due to the increased specific area caused by Fe3O4 nanoparticles compared with pure GO.
Meanwhile, the adsorption capacity of Pb(II) was decreased in order of 2:1 Fe3O4/GO>1:1 Fe3O4/GO>GO, which was negatively related to the specific surface area of these adsorbents. Moreover, the comparison among zeta potentials of GO, 1:1 Fe3O4/GO and 2:1 Fe3O4/GO (Supplementary Fig. S5) showed little difference at neutral condition. Therefore, the increasing of adsorption capacity had to be caused by other reasons. Compared with GO and 1:1 Fe3O4/GO, the inorganic interactions between Fe3O4 nanoparticles and Pb(II) were considered to contribute to the increase of the adsorption capacity of Pb(II) by 2:1 Fe3O4/GO owing to the higher loading of Fe3O4 nanoparticles on the surface of 2:1 Fe3O4/GO. Because of that, the Fe3O4 nanoparticles were negatively charged and Pb(II) was positively charged, electrostatic attraction was most likely to occur. In comparison, more negative charges were carried by more Fe3O4 nanoparticles in 2:1 Fe3O4/GO than 1:1 Fe3O4/GO. Thus, stronger electrostatic attraction occurred, which was responsible for the higher adsorption capacity of Pb(II) by 2:1 Fe3O4/GO. Therefore, it demonstrated that the addition of Fe3O4 nanoparticles onto the surface of GO was favorable for the adsorption of Pb(II). However, GO nanosheets and functionalized graphene from other studies show higher adsorption for Pb(II) than the Fe3O4/GO nanocomposites in Table 1. This may be due to the fact that the adsorption affinity between Fe3O4 nanoparticles and Pb(II) was not as strong as the chelation formed by Pb(II) and organic compounds on the surface of chitosan-gelatin/GO, EDTA/GO, and chitosan/GO (Huang et al., 2011; Madadrang et al., 2012; Zhang et al., 2011).
Effect of pH on adsorption
Supplementary Figure S6 shows the effect of pH on the adsorption of E2 and Pb(II). Supplementary Fig. S5 shows the zeta potential of GO, 1:1 Fe3O4/GO, and 2:1 Fe3O4/GO. As we can see, the pHzpc occurred around pH 9. The most favorable pH for the adsorption of E2 was 7, and acidic or alkaline condition inhibited the adsorption process, which agreed with the fact that the adsorption between E2 and Fe3O4/GO was mainly through π-π conjugation (Pan and Xing, 2008; Pan et al., 2008). When solution pH<pHzpc<pKa of E2 (about 10.4), the −COOH groups of Fe3O4/GO and −OH of E2 were mutually repulsive, thus inhibiting the π-π conjugation. Furthermore, when solution pH>pKa value of E2>pHzpc, enormous restraint on the adsorption of E2 would occur. Because of that, more protons given by E2 competed with E2 to get adsorbed (de Mes et al., 2005; Chen and Hu, 2010).
Neutral and alkaline conditions were more beneficial for the adsorption of Pb(II), which agreed with the fact that one of the most dominant adsorption mechanisms for Pb(II) was through electrostatic interaction between the negatively charged Fe3O4/GO and the positively charged Pb(II). Moreover, the adsorption capacity was almost the same (22.6 mg/g) at neutral and alkaline conditions. When pH<7.7 (pKa of Pb(II)), the negative charges on Fe3O4/GO decreased along with increasing pH, resulting in the decrease of adsorption capacity of Pb(II) (Naiya et al., 2009a, 2009b; Mi et al., 2012). When the solution was alkaline, electrostatic attraction increased the adsorption capacity of Pb(II) while precipitation might occur and decreased the concentration of the solution (Kovačević et al., 2000). As a result, little difference was observed for the adsorption capacity between neutral and alkaline conditions.
Adsorption of mixture of E2 and Pb(II)
Figure 4 shows the effect of E2 and Pb(II) on the adsorption of Pb(II) and E2, respectively. The adsorption capacity of E2 did not change with the increasing concentration of Pb(II) and varied between 6.0 and 7.3 mg/g, which was similar to the adsorption capacity (8.32 mg/g) for pure E2, as shown in Fig. 4a. Therefore, it can be concluded that the concentration of Pb(II) has little impact on the adsorption of E2. However, as shown in Fig. 4b, the presence of E2 greatly promoted the adsorption of Pb(II) and the adsorption capacity of Pb(II) gradually increased from 14.8 to 20.8 mg/g with the increasing concentration of E2. The increased capacity was higher than the adsorption capacity of Pb(II) (13.34 mg/g) in the absence of E2. Therefore, for a mixture of 10 mg/L of E2 and Pb(II), a higher adsorption capacity of 20.8 mg/g for Pb(II) and unaffected adsorption capacity of 7.34 mg/g for E2 were achieved.
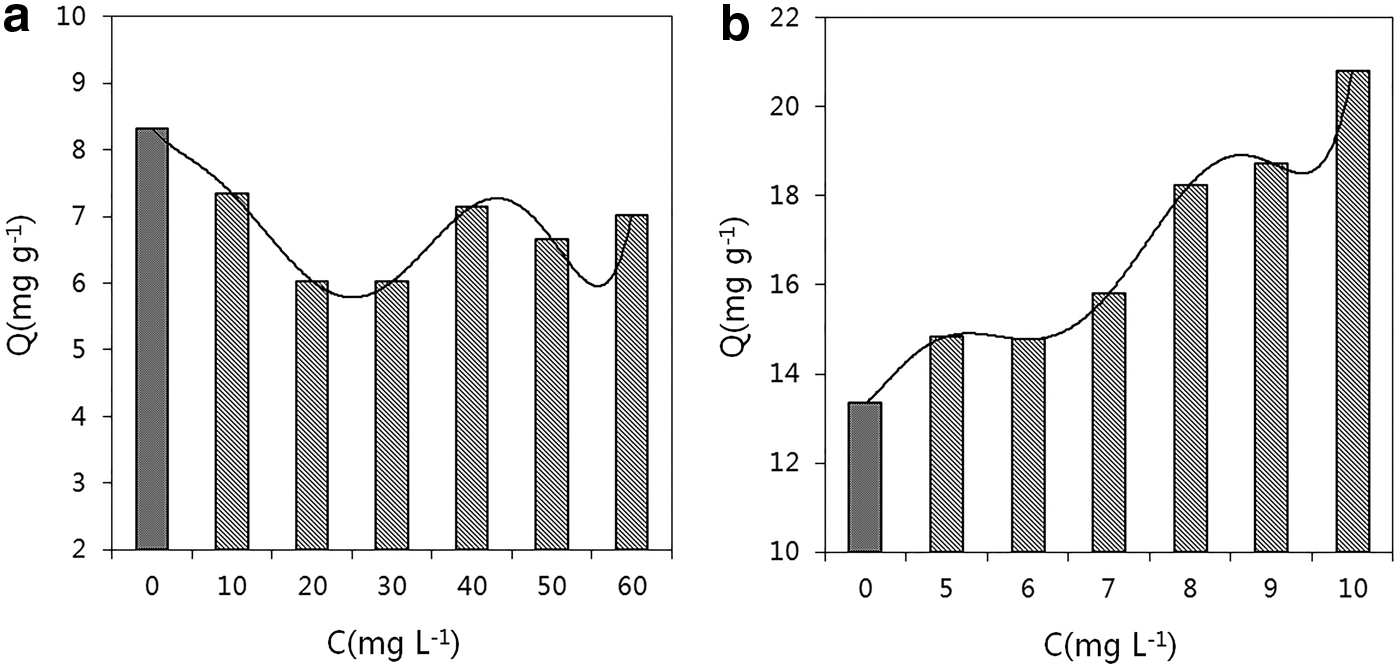
Effect of initial concentration of Pb(II) for
The effects of E2 and Pb(II) on the adsorption of each other and on Fe3O4/GO could be explained by the different mechanisms of their adsorption. The adsorption of E2 was mainly through π-π conjugation between Fe3O4/GO and E2, and the adsorption of Pb(II) was mainly through electronic interactions. Therefore, the adsorption of E2 was hardly affected by the presence of Pb(II). In contrast, the adsorption of E2 promoted the adsorption of Pb(II) through either direct interaction with the adsorbed E2 or the expanded specific surface area and active sites of adsorbents.
After adsorption, XPS analysis was carried out to clarify the previously proposed conjecture specifically. The Fe3O4/GO nanocomposites bearing E2, Pb(II), and the mixture were separately tested. The XPS prectra in Fig. 5 clearly reveal the Fe 2p, O 1s, C 1s, and Pb 4f peaks after adsorption, indicating the general difference between the adsorption of E2 and Pb(II). More specific plots of the deconvolution of O 1s and the comparison of Pb 4f are exhibited in Fig. 6. In Fig. 6a, O 1s spectra of Fe3O4/GO nanocomposites after the adsorption of E2 reveal four peaks at the position of 533.30, 531.90, 531.20, and 530.2, corresponding to (1) O=C-O, (2) -OH, (3) C=O, and (4) Fe3O4, respectively. All the functional groups belong to Fe3O4/GO nanocomposites, excluding some -OH groups from E2. It is proved that the chemical adsorption of E2 is mainly via π-π conjugation. Figure 6b shows four O 1s peaks at the position of 533.30, 532.60, 531.20, and 530.20, in accordance with (1) O=C-O, (2) O-C-O, (3) C=O, and (4) Fe3O4, respectively. Except for physical adsorption, Pb(II) was proved to be adsorbed onto Fe3O4/GO nanocomposites by reacting with −COOH and producing O-C-O (Lin et al., 2012; Madadrang et al., 2012; Orsetti et al., 2013). As shown in Fig. 6c, five O 1s peaks at the position of 533.30, 532.60, 531.50, 531.20, and 530.20 indicate the existence of (1) O=C-O, (2) O-C-O, (3) OH−, (4) C=O, and (5) Fe3O4, respectively. The–OH groups in E2 were considered to be reacting with Pb(II) and tending to be more negatively charged as OH− (Madadrang et al., 2012). Moreover, the XPS analysis of Pb 4f spectra in Fig. 6d shows higher peaks of Pb from the mixture than that from Pb(II) alone with same concentrations, which further indicates the approval of the existence of E2 for the adsorption of Pb(II).
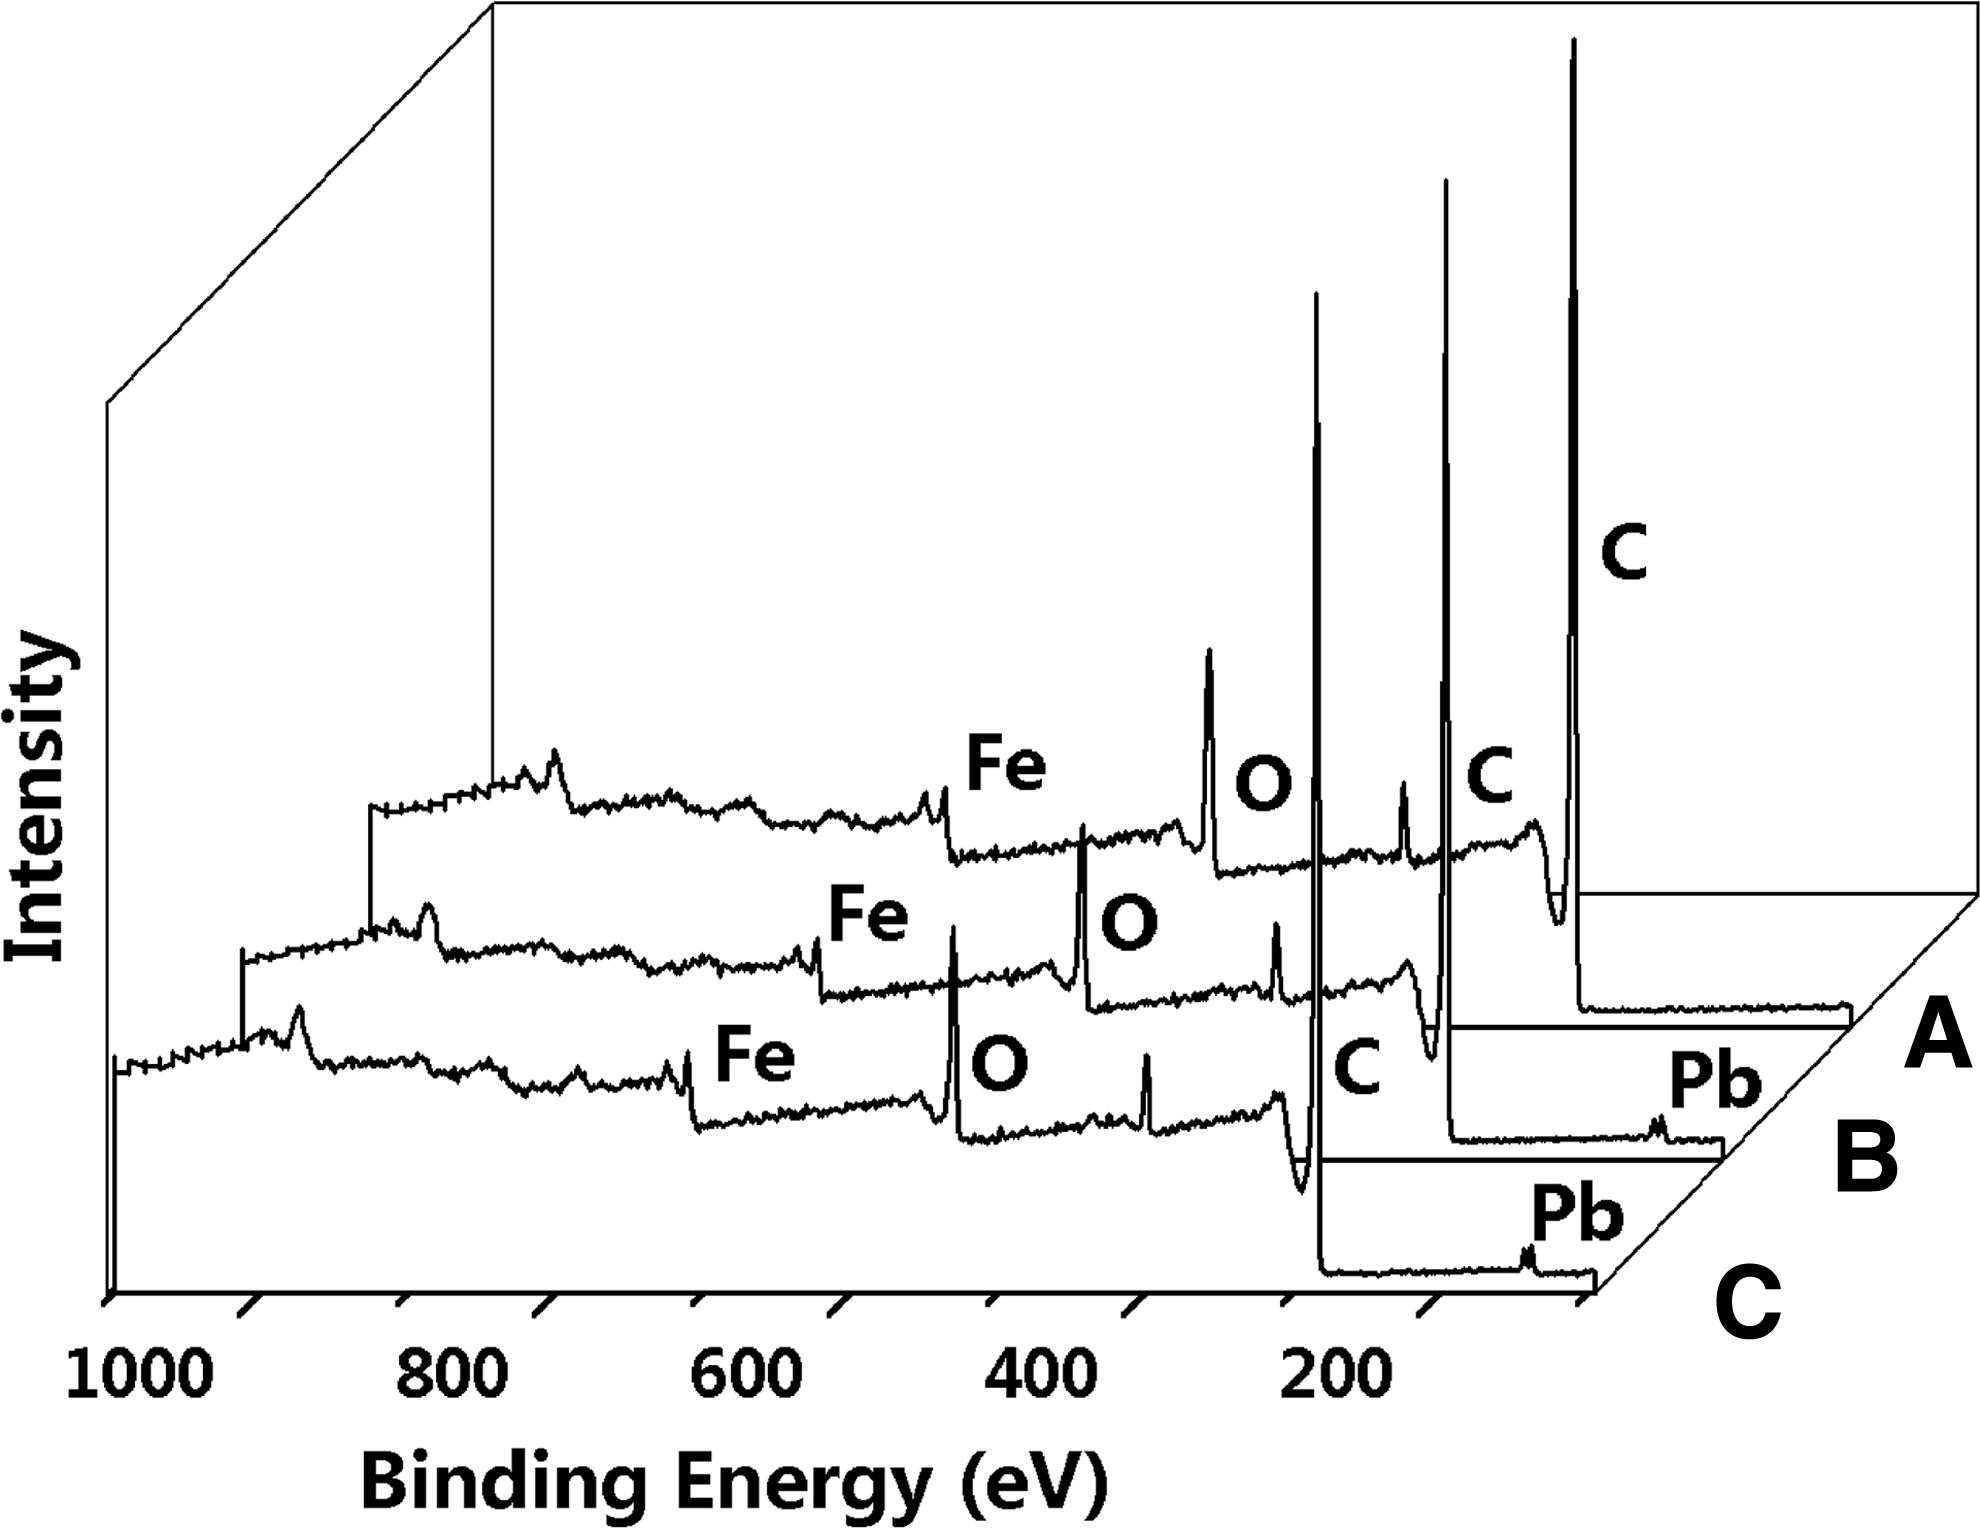
XPS spectra of Fe3O4/GO nanocomposites after the adsorption of
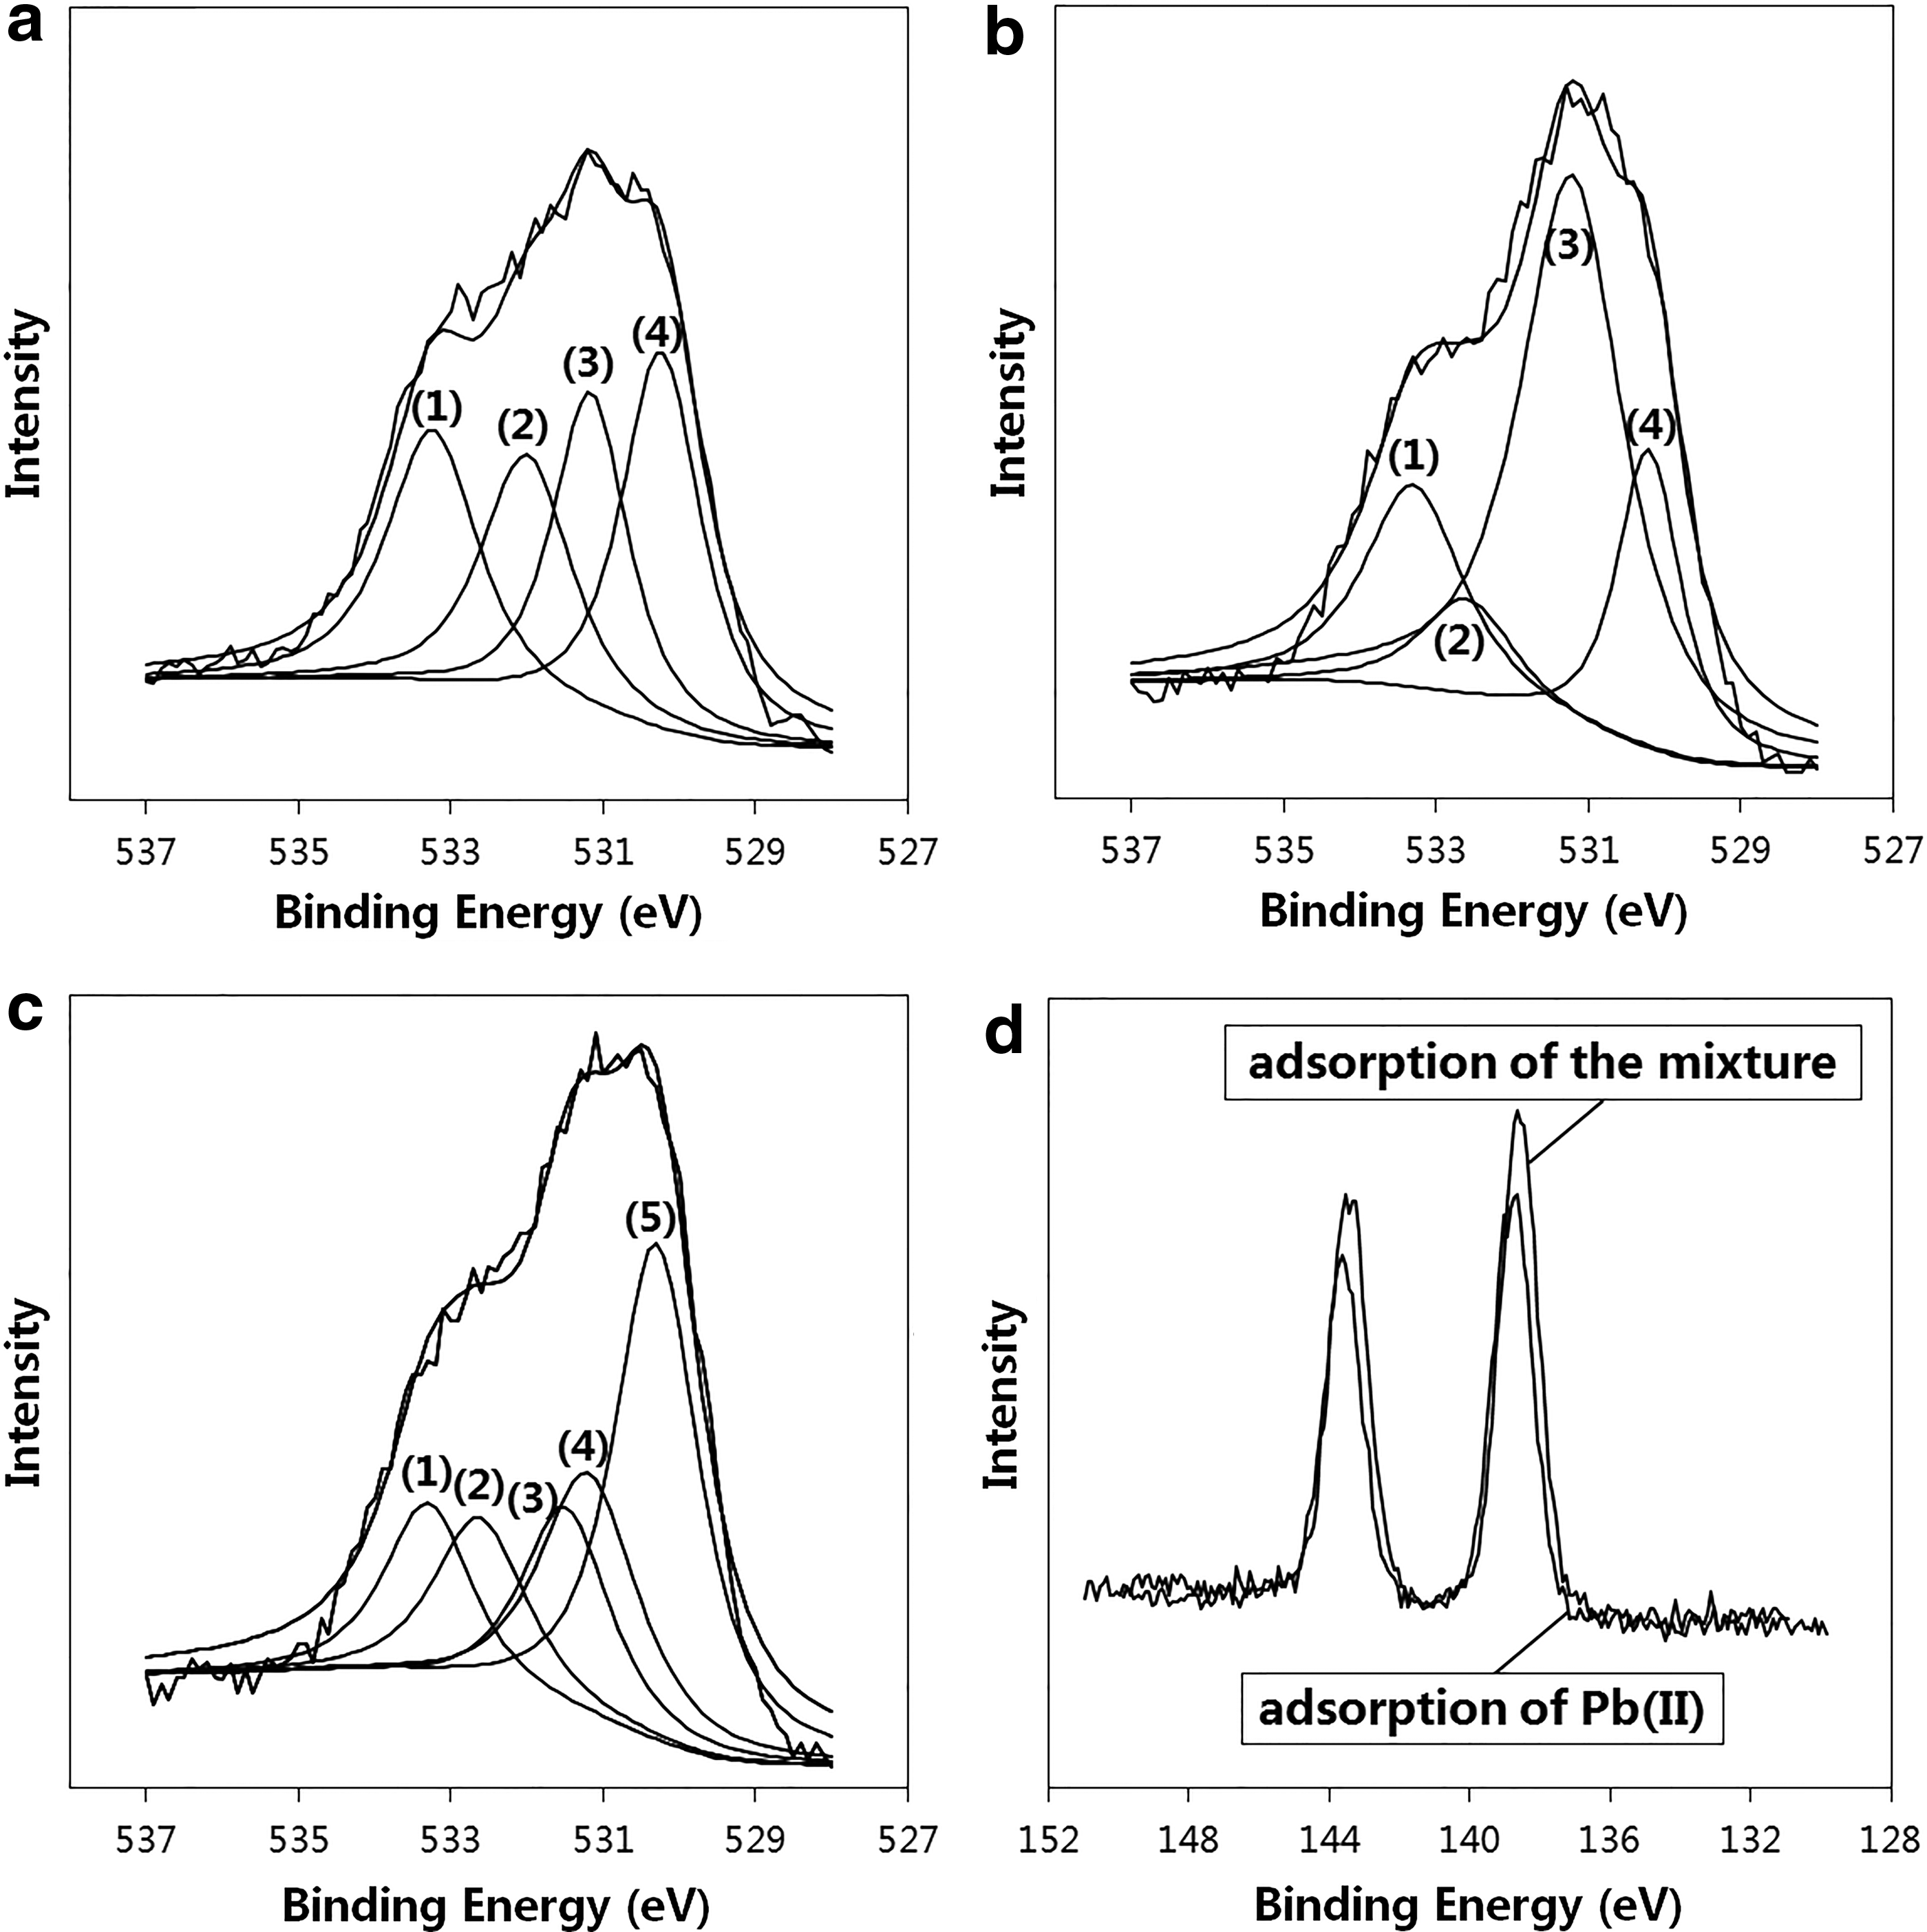
XPS spectra of Fe3O4/GO nanocomposites after adsorption.
Because of the possible adsorption mechanisms of E2 and Pb(II) by Fe3O4/GO nanocomposites as discussed, the adsorbents could be fully used for the treatment of the mixture. Moreover, Pb(II) alike contaminants can potentially be better removed by using Fe3O4/GO nanocomposites after the adsorption of E2 alike organic pollutants.
Desorption and regeneration
To investigate the reusability of Fe3O4/GO adsorbents after adsorbing single E2 or Pb(II) and the mixture, regeneration of 2:1 Fe3O4/GO nanocomposites was conducted for 10 times after the adsorption of E2 or Pb(II). Results are presented in Supplementary Fig. S7. The adsorption capacity of Fe3O4/GO nanocomposites for E2 and Pb(II) was 87.0% and 88.0%, respectively, after three recycle times. After recycling for five times, the adsorption capacity of Fe3O4/GO nanocomposites for Pb(II) and E2 was still 75% and 71%, respectively. And after recycling for 10 times, the recycling adsorption capacity reached 63% and 60% for Pb(II) and E2, respectively. In the mixture, the adsorption capacity separately reached 79% and 66% for Pb(II) and E2 after recycling for 10 times. The saturation magnetizations of 2:1 Fe3O4/GO were also tested to investigate its magnetic property after the recycling of adsorption-desorption of the mixture of E2 and Pb(II). Results are presented in Supplementary Fig. S8. The data showed no obvious decrease of saturation magnetizations after 5 times (92%) and 10 times recycling (88%), indicating the excellent potential for application.
Conclusions
In summary, Fe3O4/GO nanocomposites at the ratios of 1:1 and 2:1 were successfully prepared by a facile solvothermal synthesis method. The Fe3O4 nanoparticles were homogeneously anchored on the surface of GO, and the diameters were ∼4 and ∼6 nm for 1:1 Fe3O4/GO and 2:1 Fe3O4/GO, respectively. Both nanocomposites were superparamagnetic without coercivity and remanence at room temperature. With saturation magnetizations of 9.58 emu/g for 1:1 Fe3O4/GO and 15.14 emu/g for 2:1 Fe3O4/GO, both adsorbents could be easily separated through an external magnetic field. Batch adsorption experiments showed better fitting for pseudo-second-order adsorption kinetics model and agreed better with Freundlich adsorption isotherms in a single system. Moreover, the adsorption was found to be pH dependent and the optimal pH for the adsorption of E2 and Pb(II) was neutral. We also demonstrated that the presence of Pb(II) showed little influence on the adsorption of E2. However, the adsorption capacity of Pb(II) was increased with increasing the concentration of E2. The prepared Fe3O4/GO nanocomposites could be used in the treatment of wastewater, especially for the treatment of effluents carrying both EDCs and heavy metals such as E2 and Pb(II). Moreover, Fe3O4/GO nanocomposites could potentially be excellent adsorbents for the removal of Pb(II) alike contaminants after the adsorption of E2 alike organic pollutants.
Footnotes
Acknowledgments
The authors gratefully acknowledge the support provided by the National Natural Science Foundation of China (Grant No. 51308183), Natural Science Foundation of Jiangsu Province of China (Grant No. BK20130828), Major Science and Technology Program for Water Pollution Control and Treatment (Grant No. 2012ZX07103-005), and National Key Technologies R&D Program of China (Grant No. 2012BAB03B04).
Author Disclosure Statement
No competing financial interests exist.
References
Supplementary Material
Please find the following supplemental material available below.
For Open Access articles published under a Creative Commons License, all supplemental material carries the same license as the article it is associated with.
For non-Open Access articles published, all supplemental material carries a non-exclusive license, and permission requests for re-use of supplemental material or any part of supplemental material shall be sent directly to the copyright owner as specified in the copyright notice associated with the article.