
Abstract
Abstract
Black carbon (BC) is a primary particle matter component emitted as a result of incomplete combustion. Due to its light-absorbing nature, BC can exert both direct and indirect influence on global climate. There is no universal research or regulatory definition of BC; instead, a variety of instruments and analytical methods define BC operationally. This study used a constant, source-generated BC concentration in order to quantify the variation in BC measurements using 10 different instruments and methodologies. Instruments examined include a multiangle absorption photometer, a transmissometer, rack-mount, portable, and micro-aethalometers, a thermal-optical carbon analyzer (using IMPROVE, NIOSH 5040, and NIST-EPA methods), a single-particle soot photometer (SP2), and a three-wavelength photoacoustic soot spectrometer (PASS3). BC-bearing soot was generated using an ethylene-air diffusion flame, diluted to ∼100 μg/m3, which was subjected to simultaneous analyses. Measured BC and elemental carbon (EC) concentrations ranged from 20.5 to 39.9 μg/m3. BC concentrations measured by aethalometers and transmissometer instruments varied by <15%. However, measurements of BC were as much as 52% greater than EC determined by thermal-optical techniques. Gravimetric data from the current study suggest that the thermal-optical measurements of EC likely underestimated the carbon in flame soot samples, indicating an inability to close a carbon mass balance.
Introduction
S
BC measurements are operationally defined by the method used, and a universally accepted definition does not exist. Andreae and Gelencser (2006) propose an excellent framework on how to define BC, elemental carbon (EC), and soot, but adhere primarily to instrumental and operational definitions. The U.S. EPA's Report to Congress (2012) defines BC as “a solid form of mostly pure carbon that absorbs solar radiation (light) at all wavelengths. BC is the most effective form of PM, by mass, at absorbing solar energy, and is produced by incomplete combustion.” In general, BC is defined by light-absorption (or transmittance or attenuation) methods made at one or several visible or infrared wavelengths. In addition to inorganic carbon, BC measurements can also include contributions from particulate phase organic species that absorb light, often referred to as brown carbon (BrC). The term “light-absorbing carbon” (LAC) is also sometimes used interchangeably with BC (Moosmüller et al., 2011; Andreae and Gelencser, 2006). Absorption measurements require an instrument or user-defined mass absorption coefficient (MAC) to yield mass concentrations, with the MAC being determined on combustion source and aerosol age as well as absorption measurement technique. Direct calibration for many BC instruments is difficult and this limitation is discussed within the research community. In contrast to light-absorption approaches, thermal-optical methods use programmed heating of a sample in sequential inert and oxidizing environments to distinguish organic carbon (OC) from EC. Thermal-optical methods are well established and provide direct measurement of OC and EC mass using flame ionization detection with routine instrument calibration methods. While the U.S. EPA's Report to Congress (2012) states that “BC is mostly EC by mass,” a recent investigation by Salako et al. (2012) that compares light-attenuating BC and thermal-optical EC measurements across Asia and the South Pacific reports that BC/EC ratios range from 0.47 to 3.56 depending on the emission source. In addition to light-absorption and thermal-optical methods, other BC measurement methods include laser-induced incandescence (LII) and photoacoustic soot spectroscopy. Similar to light-absorption methods, photoacoustic approaches do not yield BC mass concentrations unless an MAC is used. In contrast, LII methods that measure particle incandescence rather than absorption yield a value proportional to BC concentration, and coupled with the direct calibration eliminate the need for an MAC.
In the absence of a uniform BC definition, and with the increasing need for accurate measurements to monitor sources and improve inventory estimates, there is a need to compare the numerous methods and instruments currently used to measure BC. To this end, a simple, steady-state system was designed and constructed to reproducibly generate dilute carbonaceous PM for simultaneous BC and EC measurements by several instruments and methods. EC mass concentrations determined from three thermal-optical methods are compared with BC mass concentrations calculated from five commercially available instruments using manufacturer-provided MAC values. Additionally, LII and photoacoustic instruments are included. In addition to direct comparison of EC and BC values, OC concentrations from thermal-optical methods were determined, and total carbon (TC=EC+OC) values were compared to total PM mass concentrations determined gravimetrically. While the flame-generated PM contains both EC and primary OC, it was not subjected to conditions that may promote secondary organic aerosol formation that may cause measurement interferences or further variability. Of the studies available that investigate BC instrumentation, this study is unique as it examines measurements from a large set of instruments on a simple, consistent, diluted combustion-generated BC source. Several previous studies focus on ambient particles (Jeong et al., 2004; Park et al., 2006; Kirchstetter and Novakov, 2007; Chow et al., 2009). For studies that use laboratory-generated particles (Slowik et al., 2007; Cross et al., 2010; Kondo et al., 2011), the primary focus was more on particle-coating effects and less so on BC and EC measurement techniques. This study is meant to provide an understanding of the measurement variability for the available instruments and methods when challenged with a fixed concentration of homogeneous soot with limited compositionally induced interferences. Note that the study intent is to generate and examine an aerosol particle and concentration representative of something freshly emitted from combustion as opposed to mimicking an ambient aerosol and concentration.
Experimental Approach
Carbonaceous particles were generated using a small over-ventilated, laminar ethylene-air diffusion flame. Ethylene (0.225 L/min), chosen for its propensity to soot, was introduced through the cooled 5.1-mm-diameter stainless steel inner jet of a co-annular burner. Dried, HEPA-filtered air (5.9 L/min) was introduced through the outer 32.1-mm-diameter quartz tube. The quartz tube was externally heated by an electric furnace maintained at 200°C. Exhaust was directed through a heated (38°C) 9.5-mm-diameter stainless steel line to a 0.1-m3 dilution chamber and mixed with 36 L/min of dried, HEPA-filtered air. The ∼7:1 dilution ratio reduced the combustion products to near ambient temperature and prevented water condensation. Sampling ports in the dilution chamber allowed a combination of up to six instruments and PM samplers to operate simultaneously. Each instrument and method was used for at least two test days and was operated for no less than 3 h/day, with the exception of the LII instrument that operated only one test day for ∼3 h. One aethalometer (AE-22) monitored the PM chamber during all the experiments yielding an average BC concentration and standard deviation of 39.9 and 3.1 μg/m3, respectively. Although the chamber was well mixed, sample ports were assigned to different instruments at random to avoid any system bias. In addition, the AE-22 was moved between ports, establishing that the concentration was consistent at each of the six ports. Flow rates for fuel, combustion air, and dilution air were held constant using mass flow controllers. Mean and standard deviation values were calculated for each methodology using all data for a given test day (sampling integration rates are discussed in detail for each instrument in subsequent sections).
Particle mass and number measurements were periodically taken to ensure that the flame source was performing consistently throughout testing. PM mass concentrations in the dilution chamber were monitored gravimetrically by filter samples and particle number concentrations were monitored using a condensation particle counter (CPC; model 3022 manufactured by TSI, Inc., Shoreview, MN). PM samples were collected using Teflon filters (47-mm diameter) every test day. Sampling times and flow rates, ∼15 min and 15 L/min, respectively, were recorded. Filters were stored (pre- and postsampling) in a temperature- and humidity-controlled environment and weights were taken on consecutive days until they varied by 3 μg or less. Mass concentrations (based on 17 time-integrated filter measurements) averaged 103.4±14.2 μg/m3. Particle number concentrations (based on measurements made over 2 h on each of 3 days) averaged 72,000±2000 particles/cm3. The instruments' operating environment was maintained at a temperature of 20°C (±3°C) and a relative humidity of 38% (±10%). Temperature and relative humidity measurements inside the dilution chamber were 35°C (±1°C) and 19% (±8%), respectively, ensuring no water condensation within the chamber. Availability of several BC instruments was limited for testing; thus, measurements were constrained to a single BC concentration. Examination of a wider span of concentrations will be a topic worthy of future inquiry.
Instruments and methods
The study examined 10 commercially available instruments and methods. These are listed in Table 1. All the instruments and methods were operated according to manufacturer instructions as discussed within.
BC, black carbon; EC, elemental carbon; OC, organic carbon.
Aethalometers and transmissometer
Three aethalometers were used: a rack-mount (model No. AE-22), a portable (model No. AE-42), and a micro-aethalometer (model No. AE-51). The AE-22 and AE-42 instruments were manufactured by Magee Scientific (Berkeley, CA) and the AE-51 by AethLabs (San Francisco, CA). The AE-22 and AE-42 had 1-min sampling intervals, and the AE-51 sampled at 1 Hz. Aethalometers produce a BC concentration (ng/m3) based on optical attenuation at a wavelength of 880 nm (Hansen et al., 1984; Park et al., 2010). The default manufacturer recommended MAC (16.6 m2/g) was used to determine BC concentrations. To account for effects due to filter mass loading and particle scattering and absorption, aethalometer data were processed with a loading compensation, single-parameter exponential factor as described by Weingartner et al. (2003) and Virkkula et al. (2007). The transmissometer (model No. OT-21; Magee Scientific) was applied to time-integrated 47-mm-diameter quartz fiber filters that collected sample for 30 min at 15 L/min.
Multiangle absorption photometer
The multiangle absorption photometer (MAAP; model No. 5012; Thermo Scientific, Billerica, MA) is a light-absorption/transmission technique that considers the contribution of reflectance from particles in the sample to determine BC concentration (Petzold et al., 2005). For this study, it was operated at a wavelength of 660 nm, sampling once per minute. The default manufacturer recommended MAC value of 6.6 m2/g was used for determining BC concentrations. A postprocessing correction of MAAP-determined BC concentrations was not attempted, in accordance with manufacturer recommendations.
Photoacoustic soot spectrometer
A three-wavelength photoacoustic soot spectrometer (PASS3), manufactured by Droplet Measurement Technologies (Boulder, CO), offered ensemble, direct, real-time data of aerosol light absorption and light scattering. An extensive description of the operation and theory underlying the photoacoustic technique is available in the literature (Arnott et al., 1999; Lewis, 2007). The PASS3 was operated at wavelengths of 405, 532, and 781 nm, producing simultaneous absorption values every 2 s. The PASS3 yielded an absorption coefficient (Babs, Mm−1) but not a BC value. For the present study, a MAC value of 5.3 m2/g was selected using MACs given for LAC near-combustion sources as a basis (Bond and Bergstrom, 2006). For this calculation (as suggested by the manufacturer), Babs at 781 nm was used for BC determinations.
Single-particle soot photometer
The single-particle soot photometer (SP2; Droplet Measurement Technologies) is a single-particle instrument that measures LII and light scattering. A detailed explanation of the SP2 instrument and LII theory is available elsewhere (Schwarz et al., 2006; Moteki and Kondo, 2010). The SP2 operates at a wavelength of 1064 nm, and measures total carbonaceous particle mass (in units of μg/m3) and total particle number (in units of particles/m3). The SP2 measures particle incandescence rather than absorption, and couples that value with a direct calibration, eliminating the need for an MAC. Since LII measures individual particles, coincidence loss caused by high particle concentrations is possible. According to the manufacturer, the SP2 is recommended for particle concentrations <7500 particles/cm3. Further, particles with diameters <75 nm may not be effectively analyzed due to light scattering limitations (Liggio et al., 2012). It should be noted that the particle concentrations examined here were ∼10 times higher than this recommended upper limit.
Thermal optical analysis (OC–EC)
The principles of thermal-optical analysis and some of the variables that influence the OC–EC split point have been described in detail elsewhere (Chow et al., 2004, 2009; Khan et al., 2012). For thermal optical analyses, quartz fiber filters (47 mm, manufactured by Pall Corporation, Port Washington, NY) were used to collect particles from the dilution chamber (30 min at 15 L/min). Three punches (1.5 cm2) were taken from each filter and analyzed by one of three methods: NIOSH 5040 (NIOSH Manual, 1999), NIST-EPA (Conny, 2007), and IMPROVE-TOR (Chow et al., 2004) as described by Khan et al. (2012). These thermal-optical methods differed with regard to their temperature profiles and method for optical correction, which can influence the OC–EC split point. All three methods used the same Sunset Laboratory (Hillsborough, NC) thermal/optical carbon aerosol analyzer.
Results and Discussion
BC instruments and EC methods
Figure 1 presents the mean BC and EC concentrations and standard deviations for each instrument or method. In general, instruments using the same measurement principle produced similar BC concentrations. The AE-22, AE-42, AE-51, and OT-21 measured average BC concentrations ranging from 35.8 to 39.9 μg/m3. The thermal-optical measurements produced average EC concentrations ranging from 21.8 to 22.2 μg/m3, in good agreement with average MAAP and SP2 BC values of 21.9 and 20.5 μg/m3, respectively. The PASS3 yielded an average BC concentration of 33.3 μg/m3. Nine of the instrumental methods tested had standard deviations <3 μg/m3, indicating good repeatability. However, the OT-21 data were less repeatable, showing a standard deviation of 9.4 μg/m3. This measurement variability is not fully understood, as the OT-21 was highly repeatable (standard deviation <1 μg/m3) for a single filter analyzed 10 times consecutively.
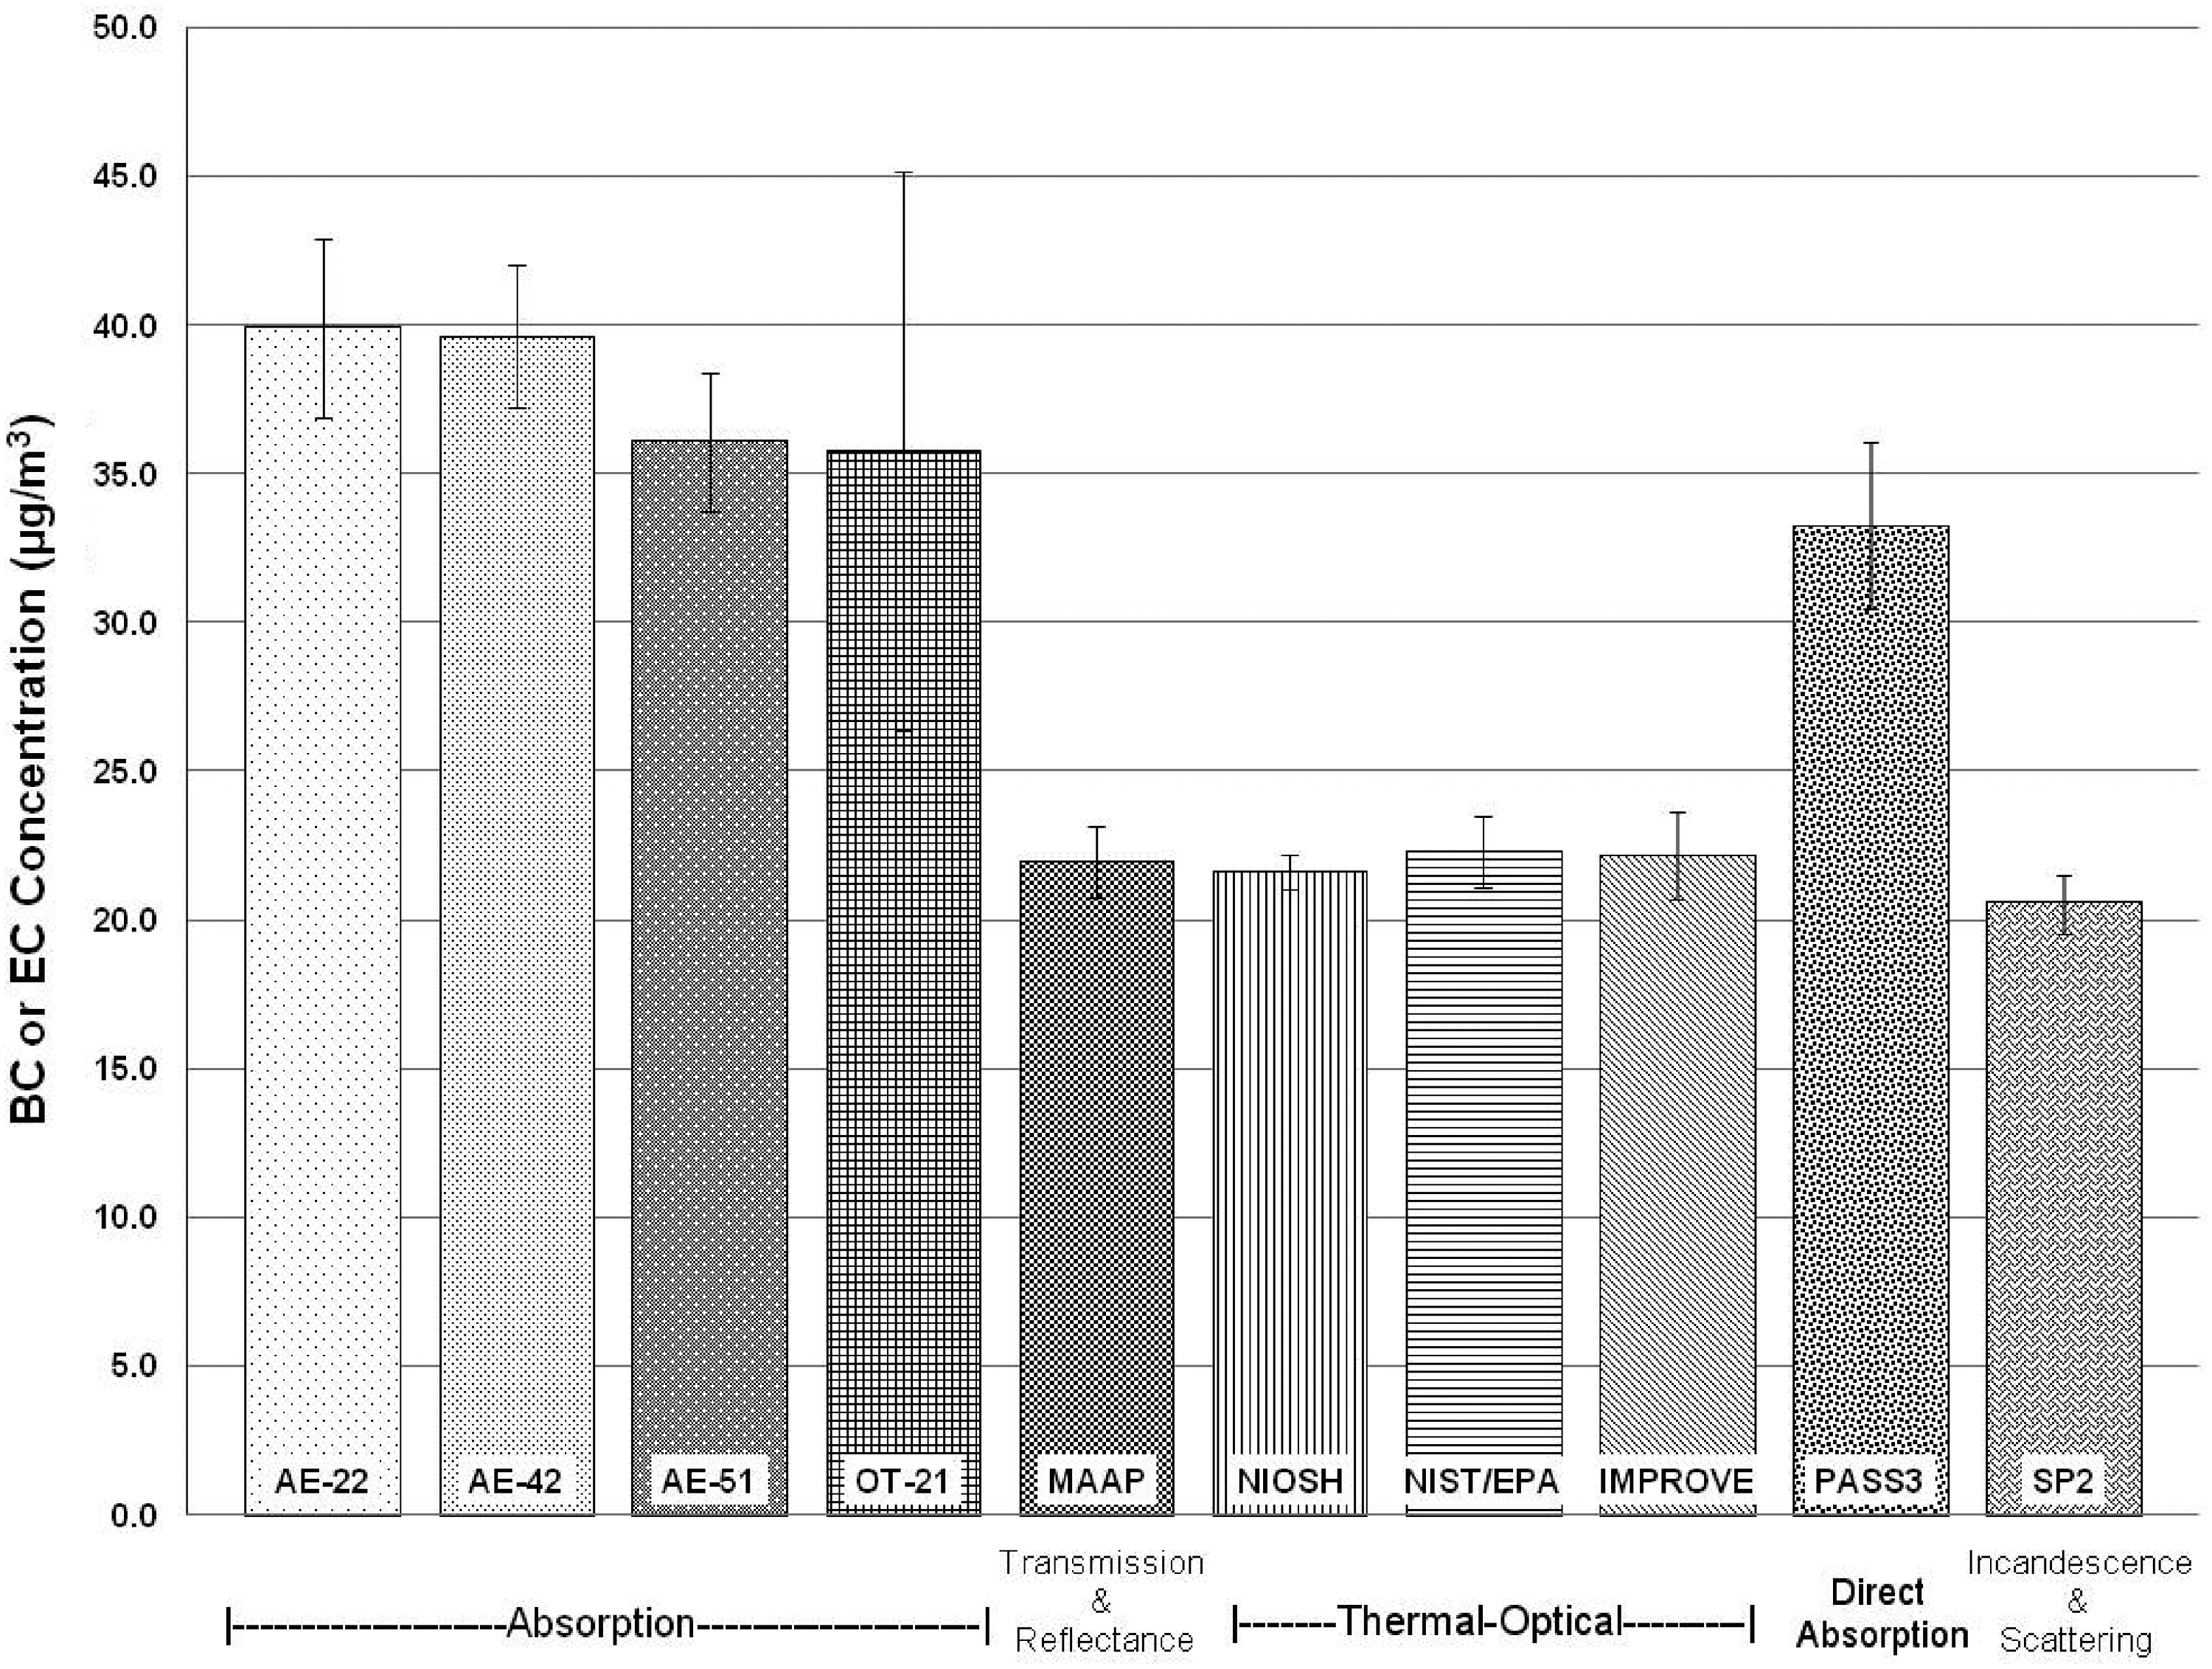
Black carbon (BC) and elemental carbon (EC) concentrations as measured by seven instruments and three methods, respectively. Measurements were made from diluted soot emissions from an ethylene-air diffusion flame. Error bars indicate±1 standard deviation from the average value. Mean and standard deviation values were calculated for each methodology using all data for a given test day (NAE-22=2,532; NAE-42=211; NAE-51=26,350; NOT-21=17; NMAAP=268; NThermal-Optical=15; NPASS3=6,966; NSP2=449).
The MAAP, thermal-optical, and SP2 methods, which use fundamentally different approaches to obtaining BC and EC concentrations, agree well, while the transmission-based aethalometers and transmissometer report ∼50% higher BC concentrations. Andreae and Gelencser (2006) suggest that BC contains EC and OC components that absorb light (e.g., BrC), and this may explain why many of these techniques report different concentrations of BC. The PASS3 should be considered separately because the user-defined MAC, in conjunction with the directly measured light absorption, is used for BC concentration calculations. The MAC is a function of combustion source and aerosol age, and was chosen for this study to be 5.3 m2/g based on the work of Bond and Bergstrom (2006). Had a different MAC been chosen, such as 6.8 m2/g (Arnott et al., 1999; Kirchstetter et al., 2004; Hamasha and Arnott, 2009), the average BC concentration would have been 26.3 μg/m3 in comparison with our value of 33.2 μg/m3. This value would have brought the BC concentration from the PASS3 in closer agreement with the nontransmission-based measurements. With regards to the SP2, Laborde et al. (2012) reported that BC mass can be underpredicted by ∼30%. This underprediction was thought to be related to the choice of calibration materials and source-specific differences in particle emissivity. If their assessment of underprediction held for the current study, then the SP2 would have reported a BC value (∼26 μg/m3), in closer agreement with the PASS3.
Comparison of BC, EC, and OC to PM mass measurements
In addition to EC concentrations, the three thermal-optical methods also provide OC mass concentrations. Figure 2 presents TC concentrations (sum of EC and OC) for the three methods compared to the total gravimetrically measured PM mass. TC accounts for ∼60% of the carbonaceous PM. Given the soot source, combustion of chemically pure ethylene and HEPA-filtered air used for combustion and dilution, better closure of the PM mass balance using TC (OC+EC) was expected. Contributions of elements other than carbon, including hydrogen, oxygen, and nitrogen may explain some of the difference. In their review of soot formation, Haynes and Wagner (1981) describe multiple studies that report typical atomic H/C ratios for soot <0.3. For large organic species, atomic H/C ratios of ∼2 are appropriate. Using the current values for the EC and OC, respectively, one can calculate that hydrogen might account for an additional 7 μg/m3 (11% of the TC mass). Further, while the presence of oxygenated and nitrogen-bearing organic species is possible, their atomic ratios and, thus mass fractions, are likely to be very small relative to carbon, especially in a fresh soot aerosol. Another possible explanation for the lack of mass closure and for method-specific differences in BC and EC values is the potential presence of chemisorbed water, which Malm et al. (2011) discuss as pertaining to ambient particles. However, fresh soot is considered hydrophobic (Zhang et al., 2008) and water is unlikely to bind to the soot surface. This is supported by thermogravimetric measurements made by Lapuerta et al. (2007) from diesel emissions that indicate <1% change in mass due to water. Finally, X-ray fluorescence (XRF) analysis of the PM filter samples, which would have detected contaminants heavier than fluorine (18.9 amu), failed to indicate the presence of any inorganic contaminant.

Total carbon (OC+EC) and total particulate matter (PM) concentrations from three thermal-optical methods and gravimetric PM mass measurements, respectively. Error bars indicate±1 standard deviation from the average value.
A lack of mass closure was similarly reported for gasoline and diesel engine emissions (Schauer et al., 1999, 2002; Zielinska et al., 2004; Subramanian et al., 2009) and biomass burning investigations (Jeong et al., 2004). Subramanian et al. (2009), upon measuring diesel engine emissions (using OC/EC analysis via NIOSH 5040 protocol), found that roughly one-third of the carbonaceous PM mass was unidentified. Similarly, Schauer et al. (1999, 2002) were only able to account for roughly 50–60% of the PM from diesel- and gasoline-powered vehicles. Both Cadle et al. (1999) and Zielinska et al. (2004) multiplied their OC measurement by a factor of 1.2 to account for the mass of other elements, believed to be predominately oxygen and hydrogen. If this multiplier is applied to the OC values measured in the current study, then it increases the TC from all three thermal-optical techniques, yet still leaves roughly 35% unidentified. To account for all mass (carbonaceous) in the measurement, the factor would need to be >1.9, an unlikely value given the flame-generated soot source used in the current study.
Summary
An intercomparison of methods for source measurements of BC was conducted using a constant concentration of soot from a laboratory ethylene-air burner. Five measurement techniques (transmission, reflectance, thermal-optical, direct absorption, and incandescence and scattering) that incorporated 10 near real-time instruments (AE-22, AE-42, AE-51, PASS3, and SP2) and filter analysis methods (OT-21, NIOSH 5040, NIST/EPA, and IMPROVE) were used to measure BC and EC. The collection and analysis of the data suggest that the operational definition of BC (and EC) results in inconsistent results among the 10 methods, with BC values varying up to 54%. Further, filter measurements of PM2.5 mass showed that the BC methods only accounted for 60% or less of the carbonaceous mass.
Results from this study show that current commercially available instruments and sampling methods do not share a common definition of BC. The resulting variation in BC concentrations will have an impact on the accuracy of databases and inventories used for model estimates of BC and its effects on short-term climate impacts. Further, the inability to account for 40% of the PM mass suggests that current methods may significantly underestimate BC concentrations, introducing additional error and uncertainty in determinations based on current inventories. Additional work at varying concentrations and longer time availability of the measurement instrumentation is necessary to verify these preliminary findings.
Acknowledgments and Disclaimer
Portions of this work were sponsored under the EPA/DOE interagency agreement DW-89-92298301 with Oak Ridge Institute for Science and Education (ORISE). The authors are grateful to Bernine Khan (formerly U.S. EPA) for laboratory support and analyses; R. Subramanian (formerly of DMT) for assistance with PASS3 and SP2 instrument operation; and Tony Hanson (Magee Scientific), Jeff Blair (Aeth Labs), and David Smith (Sunset Laboratory) for best practices advice on instrumentation. The research described in this article has been reviewed by the U.S. EPA National Risk Management Research Laboratory and approved for publication. The contents of this article should not be construed to represent Agency policy nor does mention of trade names or commercial products constitute endorsement or recommendation for use.
Footnotes
Author Disclosure Statement
The authors declare that no competing financial interests exist.