
Abstract
Abstract
Effectiveness of basic oxygen furnace slag (BOFS) for removing dissolved phosphorus (P) was evaluated in a hypolimnetic withdrawal system. Lake water collected from the hypolimnion, with phosphate (PO4-P) concentrations of 0.25 to 0.49 mg/L, was passed through a pilot-scale (pore volume, ∼0.87 m3) treatment system over two successive summers. In year 1, the hydraulic retention time (HRT) varied from 0.58 to 1.64 days and 96.1–98.1% PO4-P was removed. The HRT in year 2 was 0.31 to 0.48 days and PO4-P removal was 97.4–99.9%. Effluent pH was 11.37±0.17 and 11.96±0.17 in years 1 and 2, respectively, with the increase attributed to dissolution of CaO and Ca(OH)2 from the BOFS. The effluent was neutralized by addition of CO2(g) before the water was discharged. Vanadium and aluminum were released from the BOFS, and were subsequently removed through addition of a filter containing 5 wt.% granular zero valent iron with a balance of silica sand and by neutralizing pH. Solid phase analyses conducted on the spent media, including FESEM-EDX, XPS, FTIR, and XANES spectroscopy, confirmed the presence of calcium carbonate and calcium phosphate minerals. Diminished hydraulic performance was observed in year 1, which was attributed to CaCO3 accumulation on the spent BOFS media. Restricting ingress of atmospheric CO2 into the system in year 2 minimized the extent of CaCO3 accumulation on the treatment media and led to improved hydraulic characteristics. Results show potential for long-term removal of phosphorus.
Introduction
P
Hypolimnetic withdrawal restoration systems remove water from the anoxic hypolimnion to limit nutrients and the extent of anoxic conditions at the sediment-water interface (Kortmann et al., 1982; Goldenberg and Lehman, 2012; Kostecki and Suschka, 2013). In many systems, the withdrawn water is discharged to water bodies downstream (Nürnberg et al., 1987). This study focused on integrating P removal within a hypolimnetic withdrawal system.
Phosphorus can be removed in treatment systems through surface adsorption and combined adsorption and precipitation reactions (Morse et al., 1998; Vohla et al., 2011). Materials used for P removal include limestone (Drizo et al., 1999), calcined diatomaceous sedimentary rock (Johansson and Gustafsson, 2000), zeolite (Sakadevan and Bravor, 1998), granular activated carbon and bone char (Mortula et al., 2007), and industrial by-products including basic oxygen furnace slag (BOFS) (Baker et al., 1998; Smyth et al., 2002; Kim et al., 2006; Bowden et al., 2009), basic oxygen furnace oxide (BOF Oxide) (Baker et al., 1998), blast furnace slag (Baker et al., 1998; Johansson and Gustafsson, 2000; Oguz, 2004), and electric arc furnace slag (Drizo et al., 2006; Chazarenc et al., 2007; Okochi and McMartin, 2011). In this study, P was removed from hypolimnetic water using BOFS.
BOFS is a major waste by-product of the steel-making industry (Mikhail et al., 1994; Bowden et al., 2009). The most abundant phases in BOFS include di-calcium silicate (Ca2SiO4), tri-calcium silicate (Ca3SiO5), ferrous oxide (FeO), Ca-Mg-Mn-Zn-ferrite [(Ca,Mg,Mn,Zn)Fe2O4], lime (CaO), and portlandite [Ca(OH)2] (Mikhail et al., 1994). Dissolution of lime and portlandite can lead to increases in the concentrations of dissolved Ca and the pH of water in contact with BOFS (Baker et al., 1998; Bowden et al., 2009; Xue et al., 2009). At these high pH values (e.g., ∼12), hydroxyapatite [Ca5(PO4)3(OH)] may precipitate and retain phosphate on the surface of the reactive media (Baker et al., 1998; Kim et al., 2006). The major elements in BOFS are Ca, Fe, Si, Mg, Mn, and Al. Significant minor constituents include Cr and V, which may leach from BOFS (Proctor et al., 2000; Chaurand et al., 2007; Navarro et al., 2010).
This study was conducted at Lake Wilcox, Richmond Hill, Ontario, Canada, which is a mesotrophic, hard water lake that strongly stratifies in summer and quickly develops anoxia within the entire hypolimnion (Nürnberg et al., 2003). The extent and mechanisms of P removal were evaluated using measurements of aqueous concentrations and by examining the spent BOFS using a series of spectroscopic techniques. A layer of zero valent iron (ZVI) was introduced to remove V from the BOFS effluent during the second year of the study.
Materials and Methods
Reactive material
BOFS was obtained from the U.S. Steel Stelco Hilton Works facility (Hamilton, Canada). The particle density of the BOFS was determined using a pycnometer (Air Comparison Beckman, Model 930). Surface area was determined with a surface area analyzer (Micromeritics Gemini®, VII 2390 Series). Porosity was measured by drying a BOFS sample of known volume, determining the mass, wetting the sample to complete saturation and then subtracting the mass of the dried sample from the mass of the saturated sample. The composition of the BOFS was determined by X-ray fluorescence (XRF; MiniPal4, and PANanalytical). Sulfur content in BOFS was detected by a carbon-sulfur determinator (ELTRA CS 2000). The constituent phases of the BOFS were determined using X-ray diffractometry (XRD) (Rigaku D/MAX 2500 rotating anode powder diffractometer) with monochromatic CuKα radiation at 50 kV and 260 mA.
System configuration
The hypolimnetic withdrawal treatment system was constructed adjacent to Lake Wilcox. The system consisted of three fiberglass columns all with volumes of 0.695 m3, for a total volume of 2.09 m3 (Fig. 1). In year 1, the columns were filled with a mixture of (BOFS-A) and gravel and the system was operated from mid June to late September. The columns were decommissioned over the winter and samples of the BOFS mixture were retained for mineralogical characterization. In year 2, the reactive mixture (containing BOFS-A) was replaced with a new mixture (containing BOFS-B) without changing the gravel to BOFS ratio, and a vanadium treatment component was added.

Schematic diagram of field columns at Lake Wilcox, Richmond Hill, Ontario. Influent waters were collected from the hypolimnion of the lake and made available periodically for continuous flow by gravity feed into the treatment system. C1, C2, and C3 represent Columns 1, 2, and 3. Influent of each column represented by Inf and P1, P2, P3, and P4 represent lateral sampling ports.
In Column 1, the reactive materials filled the entire column, extending from the base to the top (Table 1). Columns 2 and 3, which were longer than Column 1, included 30 cm of head space above the material. In year 2, 5 wt.% ZVI, mixed with sand, was added to the upper half of Column 3 (Table 1).
Media component masses were calculated using particle densities (Table 2) and measured porosity values (0.41, 0.42, 0.50, and 0.34 for the BOFS, gravel, ZVI, and sand, respectively). Particle density of ZVI was 6.68 g/cm3.
BOFS, basic oxygen furnace slag; ZVI, zero valent iron.
The three columns were placed in series and connected with a piping network (Fig. 1). Each column included lateral sampling ports (designated as Px in Fig. 1) to collect water samples at various distances along the flow path. An influent tank, periodically filled with water from the hypolimnetic withdrawal system, was placed above the maximum height of the treatment columns to maintain gravity flow. CO2(g) was added in a mixing tank via sparging to lower the pH of the treated effluent. A sand filter, graded from coarse gravel to coarse sand, was installed after the CO2 addition tank to remove precipitates. Finally, a holding tank was installed after the filtration tank for additional settling of the fines and to provide effluent samples for chemical analysis before discharge.
Sample collection and analysis
Samples were collected on a weekly basis from 13 sampling ports on the columns, the pH adjustment tank and the final effluent tank (Fig. 1). The pH adjustment tank effluent was not sampled in year 2. The pH was measured in the field on unfiltered samples. Samples for determination of phosphate, anion, cation, and trace metal concentrations were passed through 0.45 μm syringe filters into polyethylene bottles, and maintained at 4°C until analysis. The samples were filtered to be representative of water, which passes through a sand filter. Cation samples were acidified in the field with HNO3 to a pH<2, and phosphate samples were acidified in the field with H2SO4 to a pH<2. Alkalinity was measured in the field on filtered (0.45 μm) samples with standardized H2SO4 using a Hach™ digital titrator. The concentration of S2− was measured in the field using the methylene-blue method (APHA, 2005). Orthophosphate was analyzed using the ascorbic acid method (APHA, 2005) within 7 days of collection. Total phosphorus concentrations were not determined. Anion concentrations, including SO4, Cl and NO3−, and NO2−, were determined by ion chromatography. Major cation concentrations were determined by inductively coupled plasma optical emission spectroscopy (ICP-OES) and trace elements were analyzed by ICP-mass spectrometry (ICP-MS).
Characterization of reactive material
The reactive material was sampled, at 15–20 cm intervals from all three columns, at the end of year 1. Reference materials included iron (III) phosphate (FeP), β-tricalcium phosphate (β-TCP), α-tricalcium phosphate (α-TCP), hydroxyapatite (HAP), calcium phosphate dibasic (CPD), and calcium phosphate dibasic dihydrate (CPDD) (Sigma Aldrich). Hydroxyapatite (labeled HAP-WM) was prepared following the technique described in Pena and Vallet-Regi (2003). Reference materials consisting of PO4 sorbed on calcite (labeled PSC 1% and PSC 8%) were synthesized. The quantity of PO4 in the PSC materials was estimated from the initial and final concentrations of P in the solution.
The spent BOFS samples and the reference materials were examined using a Leo 1530 field emission scanning electron microscope (FESEM) with energy dispersive X-ray (EDX) analysis and by Fourier transform infrared spectroscopy (FTIR). X-ray photoelectron spectroscopic (XPS) analyses were performed using a Kratos Axis Ultra spectrometer, operated with a monochromatic Al K(α) source (15 mA, 14 kV), and processed using CasaXPS (version 2.3.14).
X-ray absorption near edge spectroscopy (XANES) was conducted at the Canadian Light Source, Saskatoon, Canada. The XANES spectra of the unknown samples were compared to spectra for the reference materials by linear combination fitting using the Athena software package, version 0.8.56 (Ravel and Newville, 2005).
Detailed methods for the synthesis of PSC, sample preparation for FESEM-EDX, FTIR, XPS, and XANES and corresponding data acquisition parameters are provided in the Supplementary Material.
Geochemical modeling
Geochemical modeling code PHREEQCi (Parkhurst and Appelo, 1999), incorporating the WATEQ4F database, was used to calculate saturation indices. Solubility product values for brushite, monetite, octacalcium phosphate, β-TCP, and variscite were included in the database (Stumm and Morgan, 1981; Baker et al., 1998).
Statistical analysis
One-way analysis of variance was conducted to determine whether there were significant differences among the PO4-P and pH concentrations at various sampling locations. The level of significance was set at the probability value, α=0.05. For all pairwise multiple comparisons, the Holm-Sidak method was chosen because it is more powerful than Tukey and Bonferroni tests (Glantz, 2012).
Results and Discussion
Characteristics of the reactive materials
The surface area of the two BOFS samples was dominated by the finest fraction (Table 2). The particle densities of the BOFS components used in years 1 and 2 were 3.67 and 3.53 g/cm3, respectively. All BOFS samples contained between 33 and 40 wt.% CaO. BOFS-B contained a lower percentage of Fe2O3 and a higher proportion of SiO2 than BOFS-A (Table 2).
XRF, X-ray fluorescence.
X-ray diffraction patterns were collected for unreacted samples of BOFS-A and BOFS-B. The BOFS material was stored in a stockpile prior to use, resulting in the accumulation of alteration products on the particle surfaces. These alteration products were removed to identify the mineral phases present in the unweathered BOFS material. In addition, samples of BOFS-A and BOFS-B with the alteration coatings intact were examined. Wuestite, periclase, and larnite were identified as major mineral phases present in samples of unreacted portions of the BOFS samples (BOFS-A and BOFS-B; Table 3). In addition, hatrurite was identified in all BOFS samples except the unweathered BOFS-A as a major mineral phase and brownmillerite was identified in all BOFS samples as a minor mineral phase. Portlandite was identified as a minor phase in unweathered BOFS-B and probable mineral phase in all other BOFS samples. Calcite was identified as a major mineral phase in the alteration coatings surrounding BOFS-A and BOFS-B (Table 3). The predominant PO4-removal mechanisms anticipated in this system are adsorption to Fe oxides and precipitation or coprecipitation of Ca-PO4 phases. The results of the mineralogical characterization of the initial materials indicate the presence of Ca and Fe oxide minerals within both BOFS-A and BOFS-B (Baker et al., 1998; Chazarenc et al., 2007; Bowden et al., 2009). XRD patterns indicate the presence of magnesium ferrous oxide [(MgO)0.239(FeO)0.761] in both BOFS samples. Although Cr and V were not detected by XRD, EDX, and XRF; XANES spectra showed the presence of both elements in BOFS-A (Supplementary Figs. S1 and S2).
XRD, X-ray diffractometry.
Influent water chemistry
Influent water chemistry was monitored during the study. Throughout both years, the concentration of dissolved constituents remained relatively constant, with steady concentrations of the major ions (Ca, Mg, Na, Cl, and HCO3). In year 1 the SO4 concentration remained constant, but in year 2 greater variability was observed, with SO4 concentrations ranging from 40 to 80 mg/L. Orthophosphate concentrations ranged from 0.25 to 0.5 mg/L in year 1 and year 2, with greater variability observed in year 1.
pH and alkalinity
The pH of the influent water, collected from the hypolimnion of Lake Wilcox, was consistently near neutral (Fig. 2). The pH rapidly increased in Column 1 and then remained relatively constant through the rest of the columns, reaching a maximum of 11.53 in year 1 and 12.13 in year 2 (Fig. 2). This increase in pH is initially attributed to the dissolution of lime and portlandite in the BOFS materials. Following the depletion of lime and portlandite, the dissolution of larnite and hatrurite likely continued to maintain high pH conditions. The alkalinity values of the effluent in years 1 and 2 were 183±75 and 698±448 mg/L as CaCO3, respectively (Fig. 2). The total alkalinity did not significantly change along the column profile during year 1. However, the total alkalinity rapidly increased in the initial stage (maximum 1214 mg/L as CaCO3) of year 2 and gradually decreased with time. All sampling locations along the flow path had significantly different pH values compared with the pH of the system influent (α=0.05, k=11, p<0.05, and P<Pcrit) except the sampling location within 0.4 m of the column inlet in year 1. No significant differences were observed between the influent pH and the pH of the sampling locations within 0.7 m along the flow path and the system effluent (α=0.05, k=12, p>0.05, and P>Pcrit) in year 2. However, in both years, the treatment media effluent was significantly different (α=0.05, p>0.05, and P>Pcrit) from the system effluent.

pH values, alkalinity, PO4-P, Ca, and SO4-S concentrations versus distance along the treatment flow path in years 1, and 2 of the hypolimnetic withdrawal P treatment experiment, respectively. C1, C2, C3, and CO2 at the top represent Columns 1 to 3 and the neutralization tank, respectively. The dashed lines represent the relevant Ontario Provincial Water Quality Objectives (PWQO).
The release of high pH effluent from the treatment system was addressed through the addition of CO2. The pH of the effluent from the pH adjustment tank typically varied between 6.5 and 8.5 (Fig. 2). In year 1, two K-style cylinders (capacity: ∼27 kg CO2) were used. The first cylinder lasted ∼57 days. Thus, 55 kg CO2 was used to treat 120 m3 (calculated using an average hydraulic retention time (HRT) of 0.8 days and the total pore volume of the reactive columns of 0.9 m3) of water. A similar amount of CO2 was used in year 2.
Major ion chemistry
During year 1, Ca concentrations initially increased along Columns 1 and 2, and then decreased later in the year. However, a decrease in porosity was observed during year 1, and Ca concentrations were more variable late in the year (Fig. 2). In the early stages of year 2, sharp increases in Ca concentrations accompanied increases in pH and caustic (OH− based) alkalinity in Column 1 (Fig. 2). Initially, the dissolution of calcium (hydr)oxides (portlandite and lime) were the principal sources of Ca to the water. Later, dissolution of calcium silicate phases (e.g., larnite and hatrurite) probably contributed Ca.
During years 1 and 2, Mg concentrations declined sharply along the flow path (Fig. 3). Precipitation of Mg-carbonates may have contributed to this Mg removal, which in turn, lessens the potential formation of CaCO3, and enhances the potential for precipitation of Ca-PO4 phases (Cao and Harris, 2008). Another potential Mg removal mechanism is the replacement of Ca in HAP (Kim et al., 2006).

Na, Mg, Mn, V, and Al concentrations versus distance along the treatment flow path in two successive years of the hypolimnetic withdrawal P treatment experiment. C1, C2, C3, and CO2 at the top represent Columns 1 to 3 and the neutralization tank, respectively.
Influent SO4 concentrations were 11.7±0.9 and 11.9±1.8 mg/L in years 1 and 2 (Fig. 2). In both years, the SO4 concentrations declined (Fig. 2).
Phosphorus removal
Mean influent PO4-P concentrations, measured as orthophosphate, were 0.345 and 0.339 mg/L in years 1 and 2, respectively; whereas the corresponding mean effluent concentrations were 0.011 and 0.005 mg/L (Fig. 2). In year 1, the flow rate was adjusted several times between 1.51 and 0.53 m3/day (HRT 0.58 to 1.64 days), resulting in a 96.1 to 98.1% removal of PO4-P. In year 2, the flow rate was adjusted to between 2.3 and 1.5 m3/day (HRT 0.31 to 0.48 days), resulting in a PO4-P removal of 97.4 to 99.9%. There was no significant decrease in the rate of PO4-P removal during years 1 and 2. Phosphate removal rates in years 1 and 2 were 0.18–0.50 and 0.47–0.73 g/day. The flow rate and mass of PO4-P were extrapolated for the missing dates between the sampling events omitting sampling events during extremely high flow rates. The calculated removal rates represent minimum values because, on many occasions, the PO4-P was removed in the initial portion of the columns. In year 1, PO4-P concentrations at most of the sampling locations were significantly different from the influent water (multiple comparisons versus control group, influent was selected as the control group; α=0.05, k=11, p<0.05, and P<Pcrit). In year 2, PO4-P concentrations at all sampling locations except those closest to the influent, ≤0.4 m along the flow path, were significantly different from the influent concentrations (α=0.05, k=12, p>0.05, and P>Pcrit).
At pH values >9, adsorption of the dominant phosphate species (HPO42− and PO43−) onto iron oxyhydroxides is not expected (Stumm and Morgan, 1981). However, limited adsorption onto Mg and Al oxides (MgO and Al2O3) may be favored due to the high pH of the zero point of charge (pHZPC) of these phases. The presence of 8–9% MgO (pHZPC=12.4: Parks, 1965; pHZPC=12.24: Sverjensky, 1994; pHZPC=10–12: Kosmulski, 2009) and 4–6% Al2O3 (pHZPC=9.1: Parks, 1965; pHZPC=9.37: Sverjensky, 1994) in the BOFS materials used in this study suggests that adsorption was a potential PO4-P removal mechanism.
The FESEM images and EDX data showed that the P content of the fresh BOFS was ∼0.1 wt% and the mass of P on the spent media increased with increasing distance along the flow path (Supplementary Fig. S3). The P content of the solid samples was negatively correlated (Pearson's r=−0.96) with the dissolved PO4-P concentration and positively correlated (Pearson's r=0.88) with the aqueous pH in Columns 1 and 2 (Fig. 4). XRD spectra of spent BOFS collected from different parts of the columns showed the presence of calcite and trace quantities of P-bearing phases. The P mass in the upper part of Column 2 was slightly less than in the middle zone of Column 2 (Supplementary Fig. S3), suggesting extensive removal of aqueous PO4-P in this zone. In Column 3, which was beyond the P-removal front, the solid mass of P remained low.
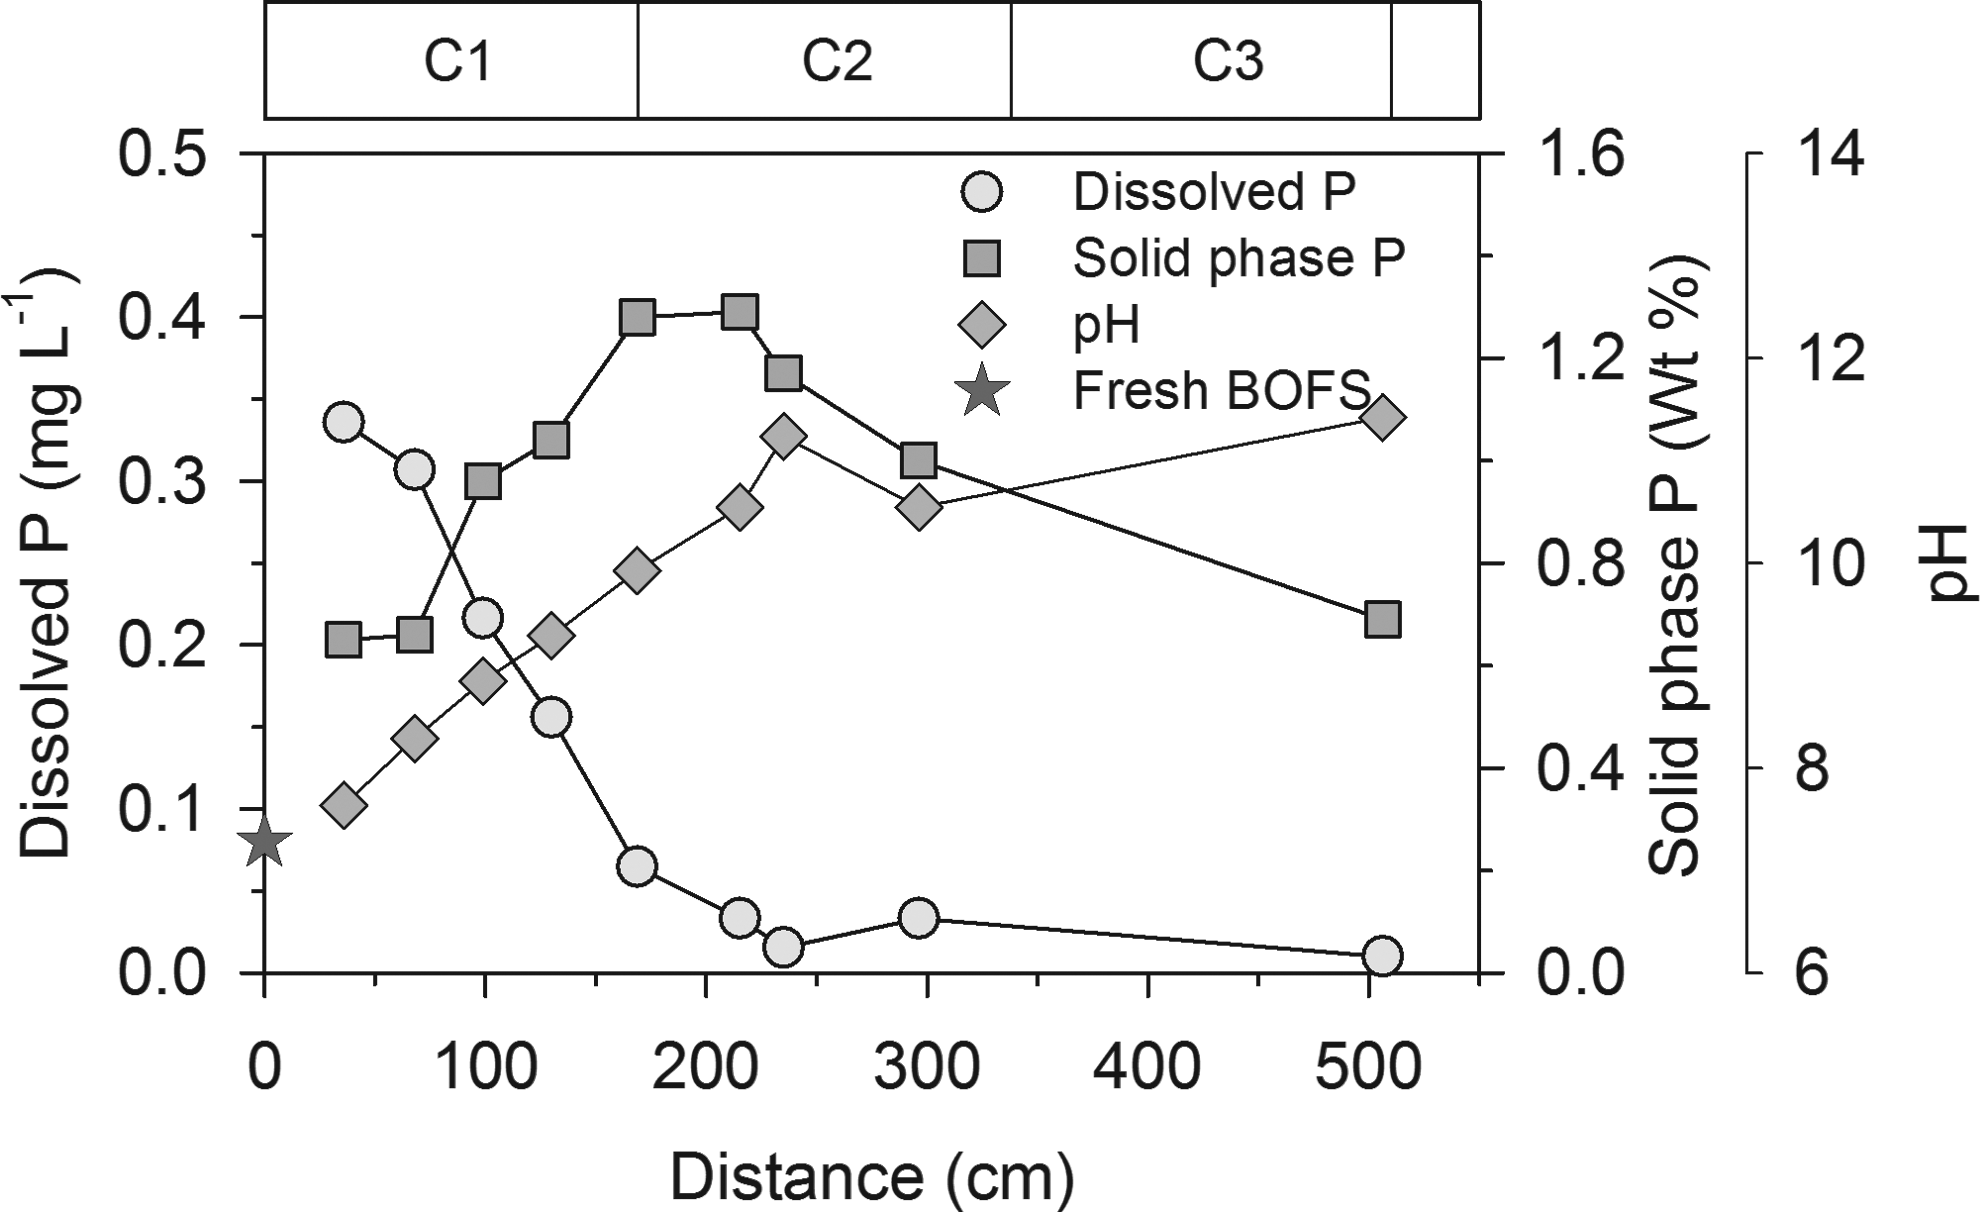
Dissolved P, solid phase P, and pH versus distance along the treatment flow path in year 1 of the hypolimnetic withdrawal P treatment experiment. Solid phase P in fresh BOFS is also plotted. C1, C2, and C3 at the top represent Columns 1, 2, and 3.
Fourier transform infrared spectroscopy
The FTIR spectra of the calcite reference material showed carbonate vibrational bands (Supplementary Table S1) within the same ranges reported for calcite in previous studies (Gillet et al., 1996; Vongsavat et al., 2006; Gunasekaran and Anbalagan, 2008). Unused BOFS showed similar carbonate bands as observed in the calcite standard.
Phosphate vibrational bands for the Ca-PO4 reference materials (Supplementary Table S1) were consistent with vibrational bands observed in other studies (Rehman and Bonfield, 1997; Pena and Vallet-Regi, 2003; Matković et al., 2012). The FTIR spectra for sample C2-S10 (Column 2-Sample 10) showed similar carbonate and phosphate vibrational bands as PSC 1% (Supplementary Fig. S4). Phosphate v3 bands were observed in all of the samples at 1009–1041 and 1078–1082 cm−1. Weak peaks from phosphate v4 bands were observed at 581–586 cm−1. In some samples it was possible to identify very weak phosphate v4 bands at 600–608, 588–595, and 562–578 cm−1. Weak phosphate v2 bands were observed in most of the samples at 444–473 cm−1. Phosphate v1 bands were observed in samples C2-S10 (at 979 cm−1) and C2-S3 (at 977 cm−1) as very weak shoulders. Among the samples analyzed, C2-S10 and C2-S3 showed the most distinct and complete vibrational bands for carbonate and phosphate (Fig. 5). The FTIR spectra suggest the presence of Ca-PO4-bearing minerals; however, due to the weak phosphate vibrational bands (corresponding to low P concentrations 0.65–1.29 wt.%) it was not possible to confirm the occurrence of HAP or β-TCP.
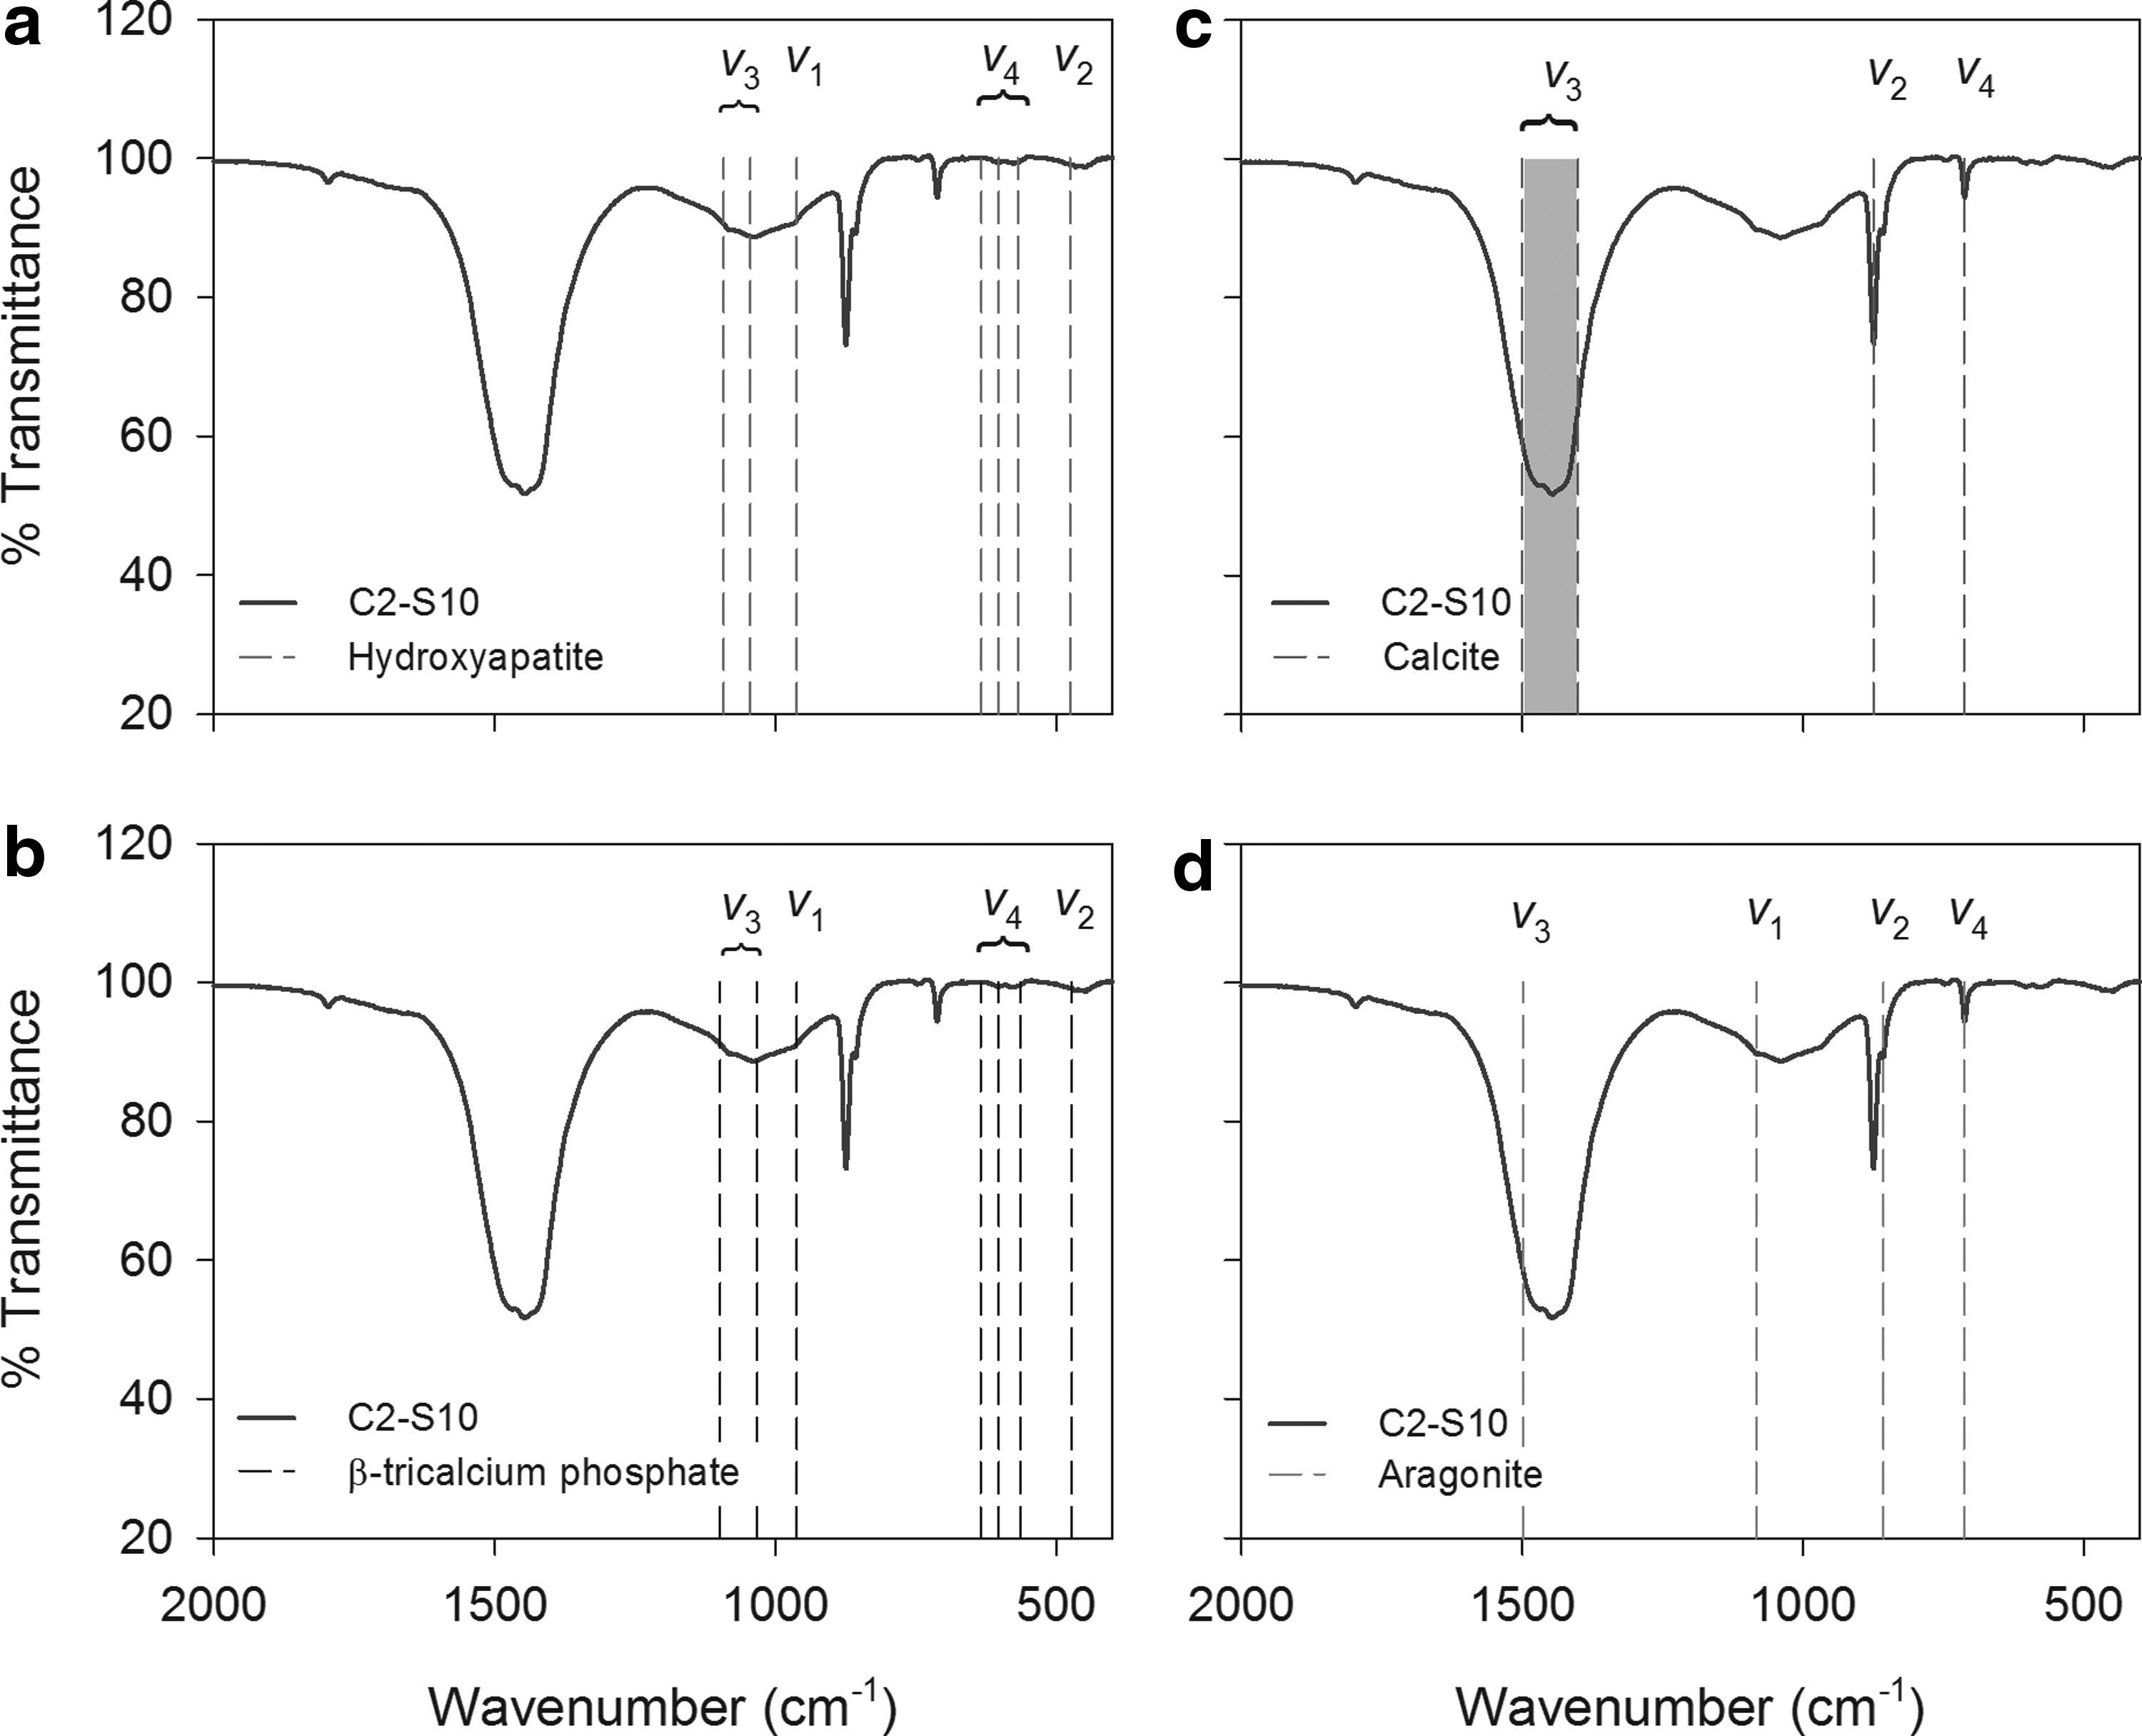
FTIR spectrum of sample C2-S10 and major phosphate vibrational bands of
Combined CO3 and PO4 vibrational bands indicate that, although the initial BOFS materials contained calcium carbonate phases, only a very small abundance of PO4-bearing phases was detected. Analysis of the spent material showed the presence of a slightly greater abundance of PO4-bearing phases, indicating the accumulation of PO4 on the treatment material. The FTIR spectral features were not adequate to distinguish the structure of the PO4-bearing phases. Additional techniques were applied to provide greater clarity on the structure of the PO4-bearing phases.
X-ray photoelectron spectroscopic
An XPS analysis of a calcium carbonate reference material showed a peak of Ca 2p3/2 at binding energies of 346.7 to 347.0 eV, and analysis of a Ca-PO4 reference material showed a peak of Ca 2p3/2 at a binding energy of 347.3 eV and a P 2p3/2 peak at 133.0 eV. The XPS survey spectra of samples obtained from the treatment columns showed peaks for O, Ca, Mg, C, P, Si, and Al. High resolution spectra were collected for the samples with the highest P concentrations, C1-S2 (0.4% P) and C1-S3 (0.3% P). The binding energies of Ca 2p3/2, Ca p1/2, and carbonate peaks of samples C1-S2 and C1-S3 were at 346.88, 350.43, and 289.38 eV and 347.07, 350.62, and 289.54 eV, which are consistent with the values for calcite and vaterite (Ni and Ratner, 2008). However, the surface atomic ratios of Ca/C in samples C1-S2 (0.32) and C1-S3 (0.29) were lower than the ratio for calcite or vaterite, whereas the surface atomic ratio of O/Ca in sample C1-S2 was ∼88% higher than that of calcite and in sample C1-S3 and was ∼25% higher than that of vaterite.
The binding energies of P 2p3/2 and P 2p1/2 were at 132.57 and 133.41 eV for C1-S2 and 132.77 and 133.61 eV for C1-S3. The binding energies of Ca 2p3/2 and P 2p3/2 in the samples and the Ca-PO4 reference materials were within the same range. However, due to the low concentrations of P in the samples, the intensities of the P 2p3/2 peaks were not high enough to definitively identify Ca-PO4 phases. Several of the techniques used in this study provide measurements of the abundance and oxidation state of elements within the bulk of the sample. XPS, however, is a surface-sensitive technique with a penetration depth of 5–7 nm below the particle surface. The XPS results confirmed the presence of P in the PO4 form at the surface of the spent BOFS media, but these measurements could not identify the nature of the PO4-bearing phases.
X-ray absorption near edge spectroscopy
Phosphorus K-edges (energy required to eject electrons from the K shell of P atoms; Güngör et al., 2007) for phosphate reference materials were observed at 2151.6±0.1 eV. Similar peak-edge positions for phosphate species are reported in previous studies (Shober et al., 2006; Brandes et al., 2007). Although the primary peak positions of the PO4-bearing (oxidation state+5) phases are similar, the characteristics of the secondary spectral features, including size, shape, and position, are diagnostic of different compounds and minerals (Brandes et al., 2007). XANES spectra of the reference materials showed pre- and post-edge features between −3 and ∼18 eV (Fig. 6i), which were within the range (from −50 to+200 eV with respect to the edge energy) described by Kelly et al. (2008). The FeP reference material showed the K-edge at 2152.0 eV and a pre-edge feature at ∼2148.5 eV (−2.5 eV with respect to the K-edge), consistent with previous studies (between −2 and −5 eV) (Hesterberg et al., 1999; Sato et al., 2005; Shober et al., 2006; Khare et al., 2007; Ajiboye et al., 2008; and Eveborn et al., 2009).
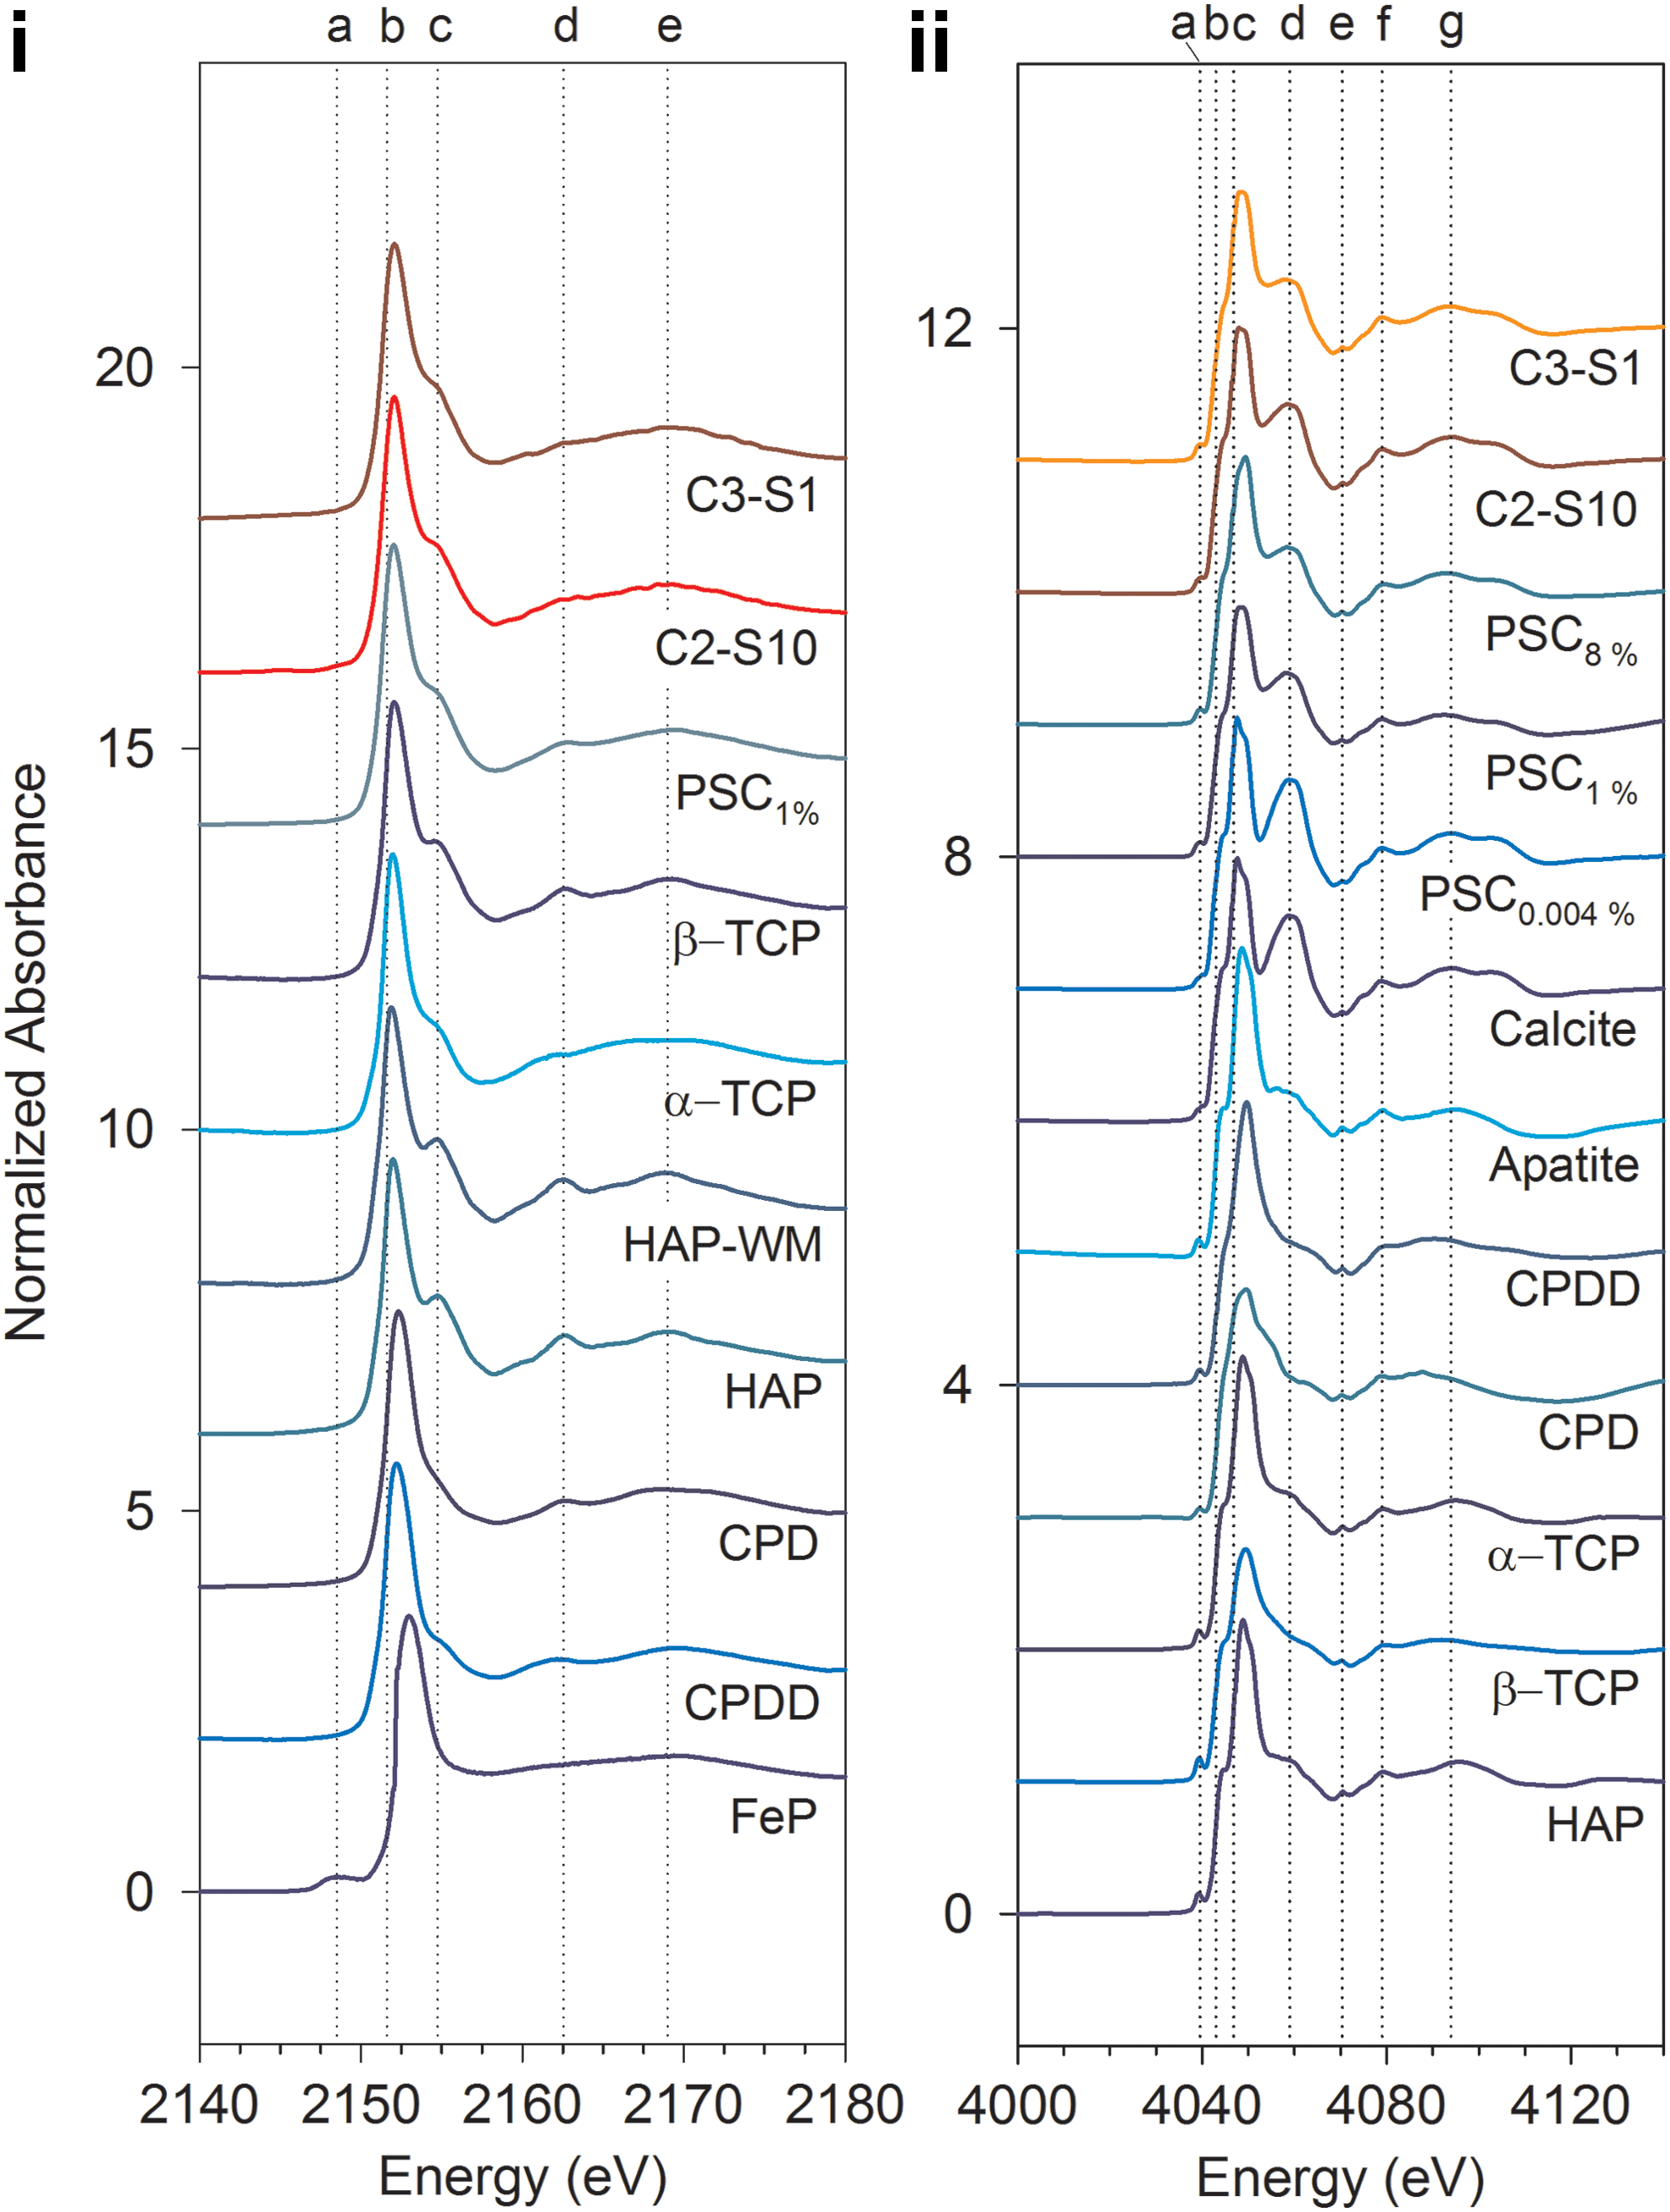
The unnormalized spectrum of unused BOFS-A showed very low intensity compared with the spectrum of a surface sample of the spent BOFS-A (C2-S10) on a log scale and a straight line close to zero on a linear scale (Supplementary Fig. S5). A pre-edge feature characteristic of FeP was observed in the spectrum of unused BOFS-A.
The presence of a shoulder at ∼2154.7 eV (Fig. 6i, c) and peaks at ∼2162.5 eV and ∼2169.0 eV (Fig. 6i, d, e) were prominent spectral features observed in all of the Ca-PO4 reference materials examined in this study. These post-edge features have been attributed to the presence of Ca-PO4 species and the oxygen oscillation (Peak et al., 2002; Sato et al., 2005). The relative position and sharpness of these features were consistent with the observations reported in Peak et al. (2002).
Comparison of the XANES spectra indicates the presence of spectral features in the samples that were similar to the reference materials (Fig. 6i). The K-edge energies of the samples and the Ca-PO4 reference materials fell within the same range of 2151.6±0.1 eV. The post-edge features in the sample spectra were located in the same energy range as observed in the reference materials. However, the post-edge features for the samples were not as distinct as those observed for the crystalline Ca-PO4 reference materials, including HAP and β-TCP. Linear combination (LC) fitting analysis of a series of multiple combinations of spectra from the reference materials showed that a mixture of PSC 1%, CPD, and HAP provided the best fit for sample C2-S10 (χ2 value of 0.30), and a mixture of PSC 1%, CPD, and CPDD provided the best fit for sample C3-S1 (χ2 value of 0.72) (Fig. 7a). The LC fitting results indicated that Fe-PO4 was not a significant component of the samples, due to the absence of the distinct pre-edge feature that is characteristic of Fe-PO4 phases.
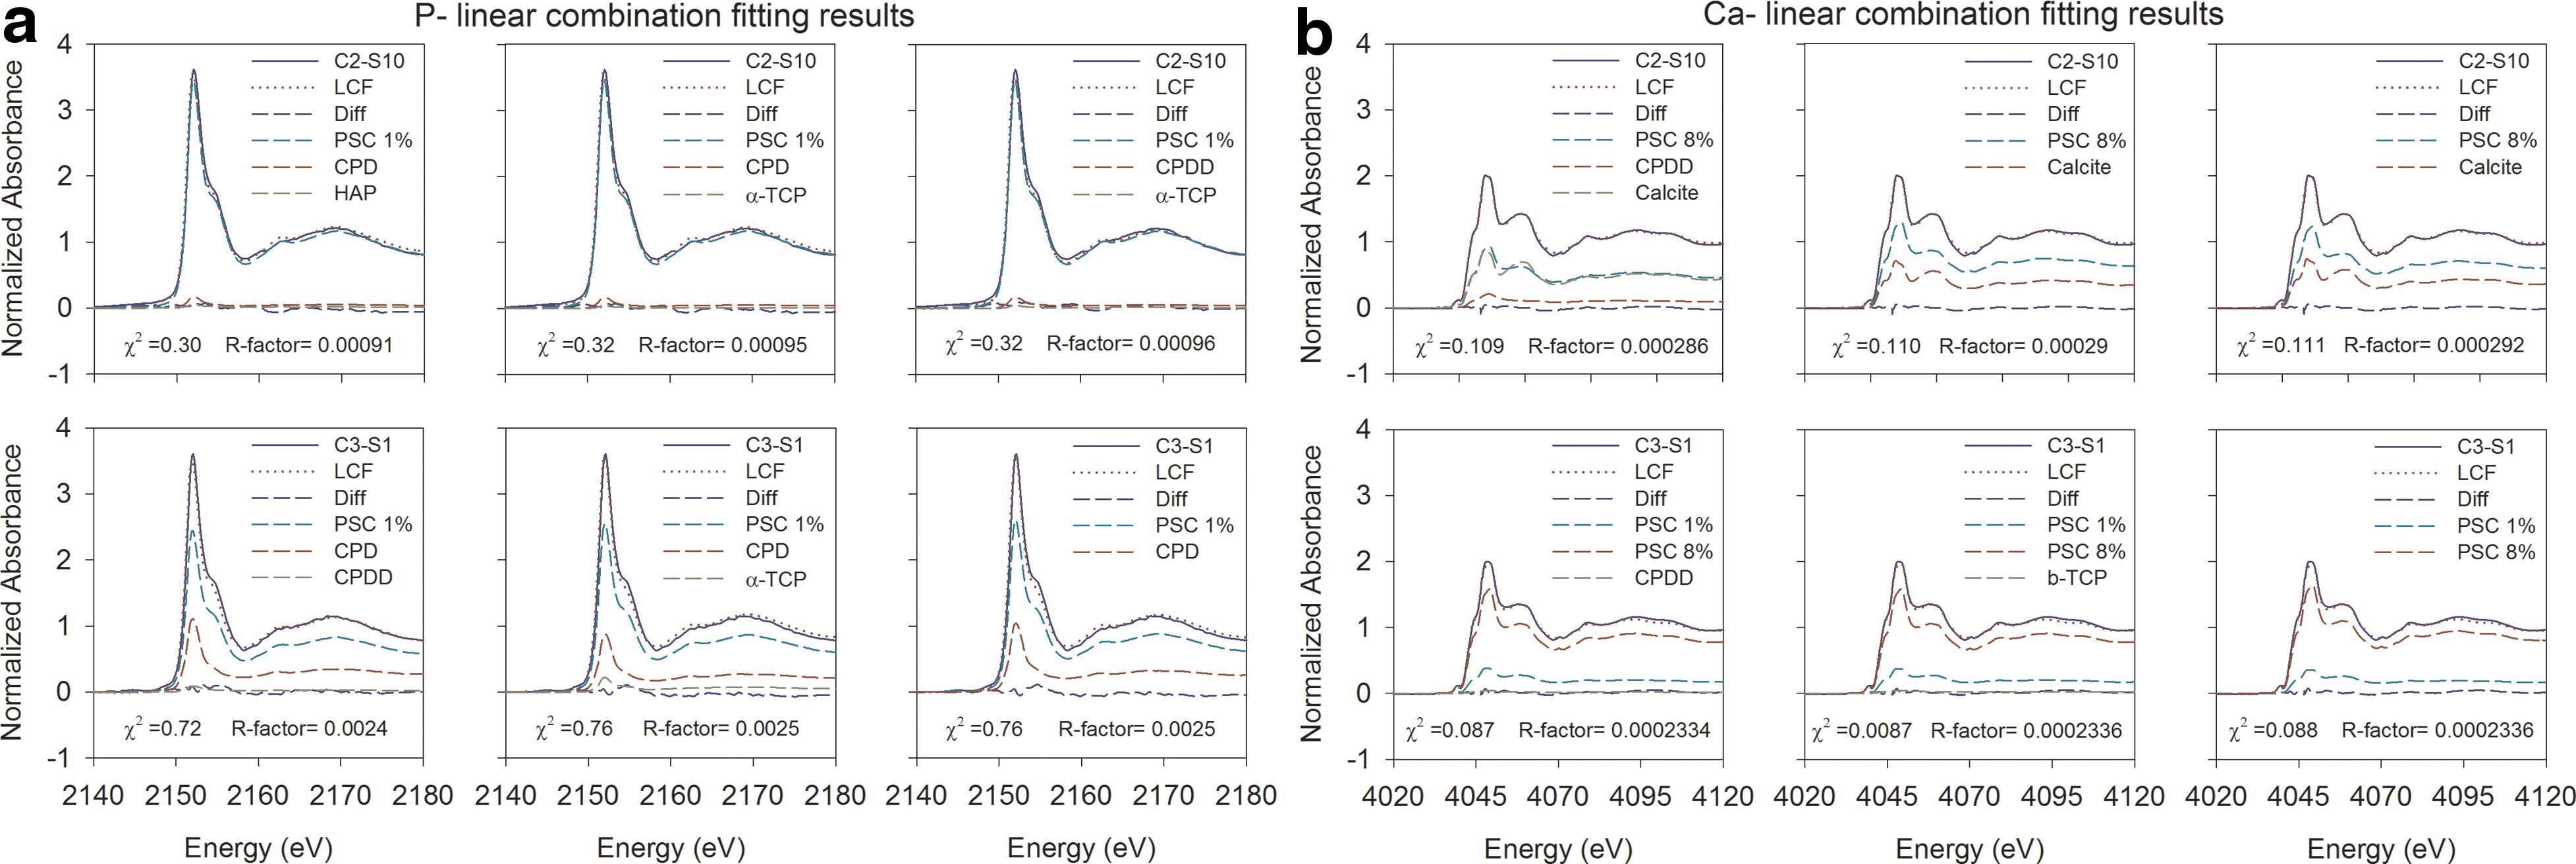
Linear combination (LC) fitting results showing contributing P- and Ca-reference materials in spent BOFS samples C2-S10
The Ca spectra for all samples and reference materials showed a small pre-edge feature at 4039.5±0.3 eV (Fig. 6ii, a). Calcium K-edges of the samples and the reference materials fell within the range of 4046.8±0.2 eV and were similar to other studies (Peak et al., 2002; Eichert et al., 2005). A pre-edge shoulder at 4043.0 eV (Fig. 6ii, b), a post-edge shoulder at 4059.0 eV (Fig. 6ii, d), and a number of sharp post-edge features at 4070.4 and 4079.0 eV (Fig. 6ii, e, f) were observed in the XANES spectra. Calcite is characterized by a wide post-edge shoulder at 4059.0 eV. This shoulder also was observed in the spectra obtained for the spent BOFS samples, and the PSC 0.004%, PSC 1%, and PSC 8% reference materials. However, the spectra for the spent BOFS samples were more similar to the spectra obtained for the PSC 1% and PSC 8% reference materials than the PSC 0.004% and the calcite spectra. An additional post-edge feature was observed at 4094.0 eV (Fig. 6ii, g) in the spent BOFS samples and the reference materials including PSC and calcite. A similar feature was observed in the spectra for other reference materials at 4091.0±4.2 eV. LC fitting analysis showed that a mixture of PSC 8%, calcite, and CPDD provided the best fit for sample C2-S10 (χ2 value of 0.109), and a mixture of PSC 8%, PSC 1%, and CPDD provided the best fit for sample C3-S1 (χ2 value of 0.087) (Fig. 7b).
Because X-ray absorption edges of different elements have different energies, XANES is element specific. It is very sensitive to the bonding environment of the absorbing atom and provides information on the abundance and oxidation state of elements. The detection limit of SXRMB beamline at P K-edge is about 100 ppm (0.01%), which provides ample precision to confirm the presence of the element on the spent media. The post-edge features of the spectra of samples and reference materials provided sufficient information on the speciation of Ca-PO4-bearing species. Both P- and Ca-XANES and corresponding LC fitting results suggest that the sample spectra closely resembled the PSC spectra. Dominance of PSC 1% in the LC fitting of samples for P-XANES is consistent with the measured concentration of P in the samples (Max.1.29%) obtained from the EDX results (Fig. 4). In addition to P sorbed on calcite, the LC fitting suggested the presence of CPD, HAP, CPDD, and α-TCP.
Geochemical modeling
The influent water during year 2 was undersaturated with respect to brushite, monetite, octacalcium phosphate, β-TCP, vivianite, and variscite (Supplementary Fig. S6). This water also was undersaturated with respect to calcite and aragonite and supersaturated with respect to HAP, MnHPO4, strengite, gibbsite, goethite, and ferrihydrite. The influent water was supersaturated with respect to HAP according to the WATEQ4F database, but undersaturated with respect to HAP using a log Ksp value proposed by Baker et al. (1998) for a study with BOF oxide at pH values similar to those in this study. Using both Ksp values, the water passing through the columns became supersaturated with respect to HAP, β-TCP, brucite, calcite, and aragonite. Although the water remained supersaturated with respect to gibbsite, ferrihydrite, MnHPO4, and strengite in the first 1 m of the flow path, it was undersaturated with respect to these mineral phases for the remainder of the flow path. The water remained undersaturated with respect to brushite, monetite, and octacalcium phosphate along the flow path.
HAP is a major PO4-bearing phase in Ca- and P-rich environments (Stumm and Morgan, 1981; Baker et al., 1998; Bowden et al., 2009). Supersaturation with respect to HAP was observed in the pore water of all three columns. The very low concentrations of PO4-P in the column effluent and indications of the presence of Ca-PO4 phases in FTIR and XANES spectra, further indicate that precipitation of Ca-PO4 phases is a mechanism through which PO4-P was retained by the reactive media. The PHREEQCI model results also showed that the pore water was supersaturated with respect to calcite and aragonite along the flow path, which is consistent with the high carbonate alkalinity measurements and the identification of calcite in the column materials. These observations suggest that the dissolved Ca concentrations are probably limited by the precipitation of CaCO3 and Ca-PO4 phases. However, continuous release of Ca from the BOFS constantly added Ca to the pore water.
A zone of Mg removal progressively migrated along the length of the system over the course of year 2 (Fig. 3). The migration of the Mg reaction front coincided with the migration of the high-pH zone and the PO4-P removal zone, suggesting that both reaction fronts may be associated with the depletion of Ca oxides and hydroxides. The geochemical modeling results suggest that at high (>9.2) pH values, the formation of MgCO3(s) is favored, however, no MgCO3 precipitates were observed through the mineralogical analyses.
Geochemical speciation calculations indicated that the pore water in the columns was undersaturated with respect to gypsum and other SO4 minerals. Sulfate also may be removed from the water by SO4 reduction and metal sulfide precipitation. Measurements made in year 2 indicate that dissolved S2− concentrations in the influent were above detection (0.005 to 0.8 mg/L). Later, in year 2, dissolved S2− concentrations gradually decreased to very low concentrations, and were often below the detection limit. Saturation with respect to amorphous FeS was attained occasionally.
Trace metals
Dissolved trace metals, including Cd, Co, Cr, Cu, Fe, Mo, Ni, Pb, Ti, and Zn, were present in the treatment system effluent at very low concentrations. However, Al and V concentrations were up to 0.85 and 0.12 mg/L in the effluent, respectively. Vanadium concentrations in the influent during both years of the trial were close to or below the detection limit (0.025 μg/L). In the BOFS column effluent, mean V concentrations increased to 0.098 and 0.039 mg/L in years 1 and 2, respectively (Fig. 3). Following the reconfiguration of the treatment system in year 2, the mean effluent V concentration was 0.027 mg/L. The removal capacity decreased after 50 days, suggesting that 5 wt.% ZVI (2.05 vol.%) was insufficient to sustain prolonged V removal and a higher ZVI content (∼5 vol.%, considering maximum 120 days of operation) would be required for full-scale implementation.
Mean Al concentrations in the influent water were 0.002 and 0.010 mg/L in years 1 and 2, respectively; the corresponding mean effluent Al concentrations were 0.294 and 0.426 mg/L (Fig. 3). The influent and pore water in Column 1 were supersaturated with respect to gibbsite but, as the pH increased became undersaturated with respect to gibbsite and Al concentrations increased. Following the addition of the CO2 sparging system and the sand filter, the Al concentrations decreased to below 0.075 mg/L. Geochemical calculations suggest that the Al concentrations declined due to precipitation of an Al hydroxide phase.
Hydraulic performance
Extensive secondary mineral precipitation was observed near the top of Column 1 during year 1 and was presumed responsible for an observed decline in hydraulic conductivity. Samples of the precipitate reacted with HCl vigorously, indicating the presence of carbonate minerals. Crystals with well-developed faces and elevated concentrations of Ca (9%), C (45%), and O (25%) were observed in the FESEM images and EDX data. These observations suggest that the precipitates were CaCO3, which formed due to the ingress of atmospheric CO2(g) into the BOFS columns, and reaction with Ca derived from the BOFS. Hydraulic performance was greatly improved in year 2 by sealing the reactive columns to prevent CO2 ingress.
Life expectancy of BOFS
The masses of P removed in years 1 and 2 were 66 and 73 mg/kg. These values were calculated based on the BOFS mass within the maximum propagated distance at C/C0=0.5. These values represent minimum values, because not all of the reactivity had been exhausted at the end of the field season. The P removal capacity of BOFS is reported as high as 8390 mg/kg based on the initial P concentrations of 100–300 mg/L (Bowden et al., 2009), which is significantly higher than the P removal observed in this study. The predicted longevity of the reactive media used in year 1 was 5.0 years and the reactive media used in year 2 was 6.8 years. This calculation was based on the media consumed (difference between maximum and minimum propagated distance at C/C0=0.5), the duration of operation in years 1 and 2, the total length of the reactive media, and assuming 3 months of operation per year and a constant flow system.
Conclusions
BOFS, a waste by-product of the steel-making process, was used in a hypolimnetic withdrawal phosphorus treatment system. The BOFS removed phosphorus (P) (up to >99% removal) to concentrations of <0.005 mg/L. The location of maximum solid-phase P accumulation coincided with the location of a sharp increase in pH and a sharp decrease in the PO4-P aqueous concentration. Solid-phase characterization techniques, including BSE imaging with EDX spectra, XPS, FTIR, P- and Ca-XANES spectroscopy and corresponding LC fitting, suggest that phosphorus accumulated within the spent BOFS media as a mixture of PSC and CPDD.
The BOFS treatment material generated a high pH effluent (ranging from pH 11 to 12.2), attributed to dissolution of CaO and Ca(OH)2. This effluent was neutralized by sparging with CO2(g). Elevated V and Al concentrations also were derived from the BOFS. Vanadium in the effluent was removed by reduction within a 5 wt.% granular ZVI mixture with sand. Aluminum was removed by a sand filter following pH neutralization. Extensive CaCO3 precipitates, which affected the permeability of the treatment material, were observed in year 1 of the study. Isolating the BOFS treatment columns from atmospheric CO2 lessened the extent of CaCO3 accumulation, which in turn improved the hydraulic performance of the system. The results of this study suggest that the BOFS based reactive material can be used for extended periods with little maintenance, potentially providing a sustainable option for the removal of P from small lakes.
Footnotes
Acknowledgments
This research was supported by the Idea to Innovation (I2I) program of the Natural Sciences and Engineering Research Council (NSERC) of Canada, the Green Municipal Fund financed by the Government of Canada and administered by the Federation of Canadian Municipalities, and the Town of Richmond Hill, Ontario, Canada. The XANES experiments were performed at the Canadian Light Source, which is supported by NSERC, NRC, CIHR, and the University of Saskatchewan on the 06B1-1 (SXRMB) beamline as part of proposal # 16-4419. We thank Y. Hu for assistance with synchrotron spectroscopy. We also thank J. Jamieson-Hanes, B. Gibson, K.T. Leung, N. Heinig, J. Fisher, H. Siu, M. Biesinger, J. Bain, L. Groza, J. Hu, D. Smyth, M. Lindsay, G. Binsted, and A. Campbell for their assistance.
Disclosure Statement
Basic oxygen furnace slag is one of the reactive media described as Phosphex™. The University of Waterloo holds a patent for Phosphex™ (U.S. Patent 5,876,606, issued March 2, 1999) and rights for its use.
References
Supplementary Material
Please find the following supplemental material available below.
For Open Access articles published under a Creative Commons License, all supplemental material carries the same license as the article it is associated with.
For non-Open Access articles published, all supplemental material carries a non-exclusive license, and permission requests for re-use of supplemental material or any part of supplemental material shall be sent directly to the copyright owner as specified in the copyright notice associated with the article.