
Abstract
Abstract
Indicator organisms are used to assess pathogen risk in waters, however, indicators often do not correlate with pathogens. Direct pathogen monitoring (e.g., human adenoviruses) may provide data on actual risk from one pathogen but may not be indicative of overall risk. A potential alternative indicator is Torque teno virus (TTV), which may co-locate with pathogenic enteric viruses but has not been associated with any disease. The objective of this research was to determine the value of TTV as a potential indicator of human fecal contamination and viral pathogen risk in the United States. Occurrence of TTV in animal feces, wastewaters, and drinking waters was evaluated by polymerase chain reaction with primers in the highly conserved untranscribed region to detect TTV human genotypes. These data were compared to data on standard indicators and human adenovirus presence. TTV was detected in 4.0% of animal feces, 41.7% of wastewater samples, and 13.9% of drinking water samples. These relatively low positive rates in waters may reflect the relatively low prevalence of serum TTV positivity in the United States. Adenoviruses were detected in a larger percentage (83.3%) of wastewaters (indicative of human fecal contamination) than TTV, and analysis of nonhuman animal feces showed the human adenovirus assay to have a higher degree of specificity. This study adds to the understanding of the global occurrence of TTV. Based on a lack of correlation with fecal indicators and varying prevalence rates in humans, TTV does not appear to be a suitable indicator of fecal contamination.
Introduction
O
Coliform bacteria are the most commonly used indicators for waterborne pathogens. Coliphages have been specifically investigated as possible viral indicator organisms as early as the 1980s (Osawa et al., 1981; Furuse, 1987). Measuring all pathogens is impractical, as there are over 140 known types of waterborne enteric viruses alone (AWWA, 2006). Relationships between coliforms and viral pathogens are often lacking, based on greater susceptibility of coliforms to environmental and engineered stressors (Ashbolt et al., 2001; Moe, 2004; Haramoto et al., 2006). Similarly, somatic and male-specific coliphages have been demonstrated to not always co-locate or correlate with pathogenic virus sources or the viruses themselves (Leclerc et al., 2000; Hot et al., 2003; Long et al., 2005). Therefore, the health-related water microbiology community has been reevaluating the need for supplemental indicator organisms (Yates, 2007).
Some investigators have proposed human adenoviruses or noroviruses to provide data on the viral quality of waters (Griffin et al., 2001; Choi and Jiang, 2005; Jiang et al., 2007). Human adenoviruses have been detected in rivers, aquifers, wastewaters, and treated drinking waters; however, virus results were typically not correlated to indicator bacteria or coliphages (Jiang and Chu, 2004; Carducci et al., 2008; Ogorzaly et al., 2010; Okoh et al., 2010). In domestic sewage in Spain, adenoviruses were detected throughout the year and more frequently than enteroviruses or Hepatitis A virus (Pina et al., 1998). Calgua et al. (2013) found adenoviruses in 100% (12 of 12) river water samples in Spain and Brazil that were impacted by domestic sewage discharges. Adenoviruses are also found in raw drinking water sources, with lower concentrations in groundwater sources than surface waters (Albinana-Gimenez et al., 2009). Noroviruses are the most common cause of acute nonbacterial gastroenteritis worldwide. In wastewaters, norovirus concentrations have exhibited seasonal fluctuations with higher concentrations in the winter (Haramoto et al., 2006; Westrell et al., 2006). Again, correlations between indicator bacteria and noroviruses were absent. In drinking water treatment plants, noroviruses have been shown to be more resistant to inactivation by chlorine but less resistant to UV than phages (Shin and Sobsey, 2008; Park et al., 2011).
A potential alternative indicator is Torque teno virus (TTV). TTV is a small, unenveloped ssDNA virus first described in 1997 (Nishizawa et al., 1997). TTV is reported to be 30–32 nm in diameter and consists of a circular, single-stranded DNA genome of approximately 3,800 nucleotides (Okamoto et al., 1998; Miyata et al., 1999; Itoh et al., 2000). The amplified regions of human and nonhuman animal isolates (swine, dog, and cats) have been sequenced. The animal-derived sequences were similar, but not identical, to the human-derived sequences (Leary et al., 1999a; Okamoto et al., 2002). TTV isolates have 47–70% divergence at the amino acid level (Biagini et al., 1999; Luo et al., 2002). TTV divergence is unevenly distributed across the genome; hypervariable regions exist within the coding region (Nishizawa et al., 1997), and the untranslated region contains conserved regulatory sequences (Leary et al., 1999b).
Initially, TTV was described as a novel hepatitis virus (Nishizawa et al., 1997), but it was later determined that TTV circulates in a large proportion of healthy individuals (Vaidya et al., 2002; Diniz-Mendes et al., 2008). The average worldwide prevalence is estimated at 80% (Springfeld et al., 2000; Bendinelli et al., 2001). In the United States, prevalence rates range from 1% to 12.8% for healthy blood donors, 17.2% for IV drug users, and 4–27% for patients with cirrhosis, hepatic failure, or hepatitis (Charlton et al., 1998; Desai et al., 1999). Transmission of TTV is primarily by the fecal-oral route (Bendinelli et al., 2001) with poor sanitation potentially contributing to transmission; the countries of Bolivia and Burma—both with high risks of waterborne disease—had a prevalence of 82% and 96%, respectively, among otherwise healthy individuals (Abe et al., 1999). Even with TTV prevalence in the United States around 10% (Desai et al., 1999), TTV would likely be present in most raw domestic wastewater samples at levels high enough to be detected using polymerase chain reaction (PCR) (Bendinelli et al., 2001).
Some researchers have found that TTV is present in environmental samples without seasonal fluctuations or epidemic spikes (Nishizawa et al., 1997; Abe et al., 1999; Bendinelli et al., 2001; Vaidya et al., 2002; Haramoto et al., 2005a; Diniz-Mendes et al., 2008). In polluted streams of Brazil, TTV was found to be spatially and temporally stable (Diniz-Mendes et al., 2008), and the TTV positivity rate of 92.3% paralleled the positivity rate reported by De Paula et al. (2007) for hepatitis A virus in the same region; although the TTV and hepatitis A loads were not correlated. In Italy, river water samples receiving waste treatment effluent contained TTV and other enteric viruses (Verani et al., 2006). In sewage treatment, Vaidya et al. (2002) found raw sewage prevalence of TTV DNA was statistically similar to the prevalence of hepatitis E virus RNA and hepatitis A virus RNA. In Japan, the TTV genome was detected with 97% frequency in influent, 18% in secondary effluent, 24% in final effluent after chlorination, and 0% in effluent for reuse following filtration and ozonation (Haramoto et al., 2005a). Carducci et al. (2008) tested samples from an activated sludge treatment plant in Italy that included chlorination. TTV was identified in 90% (36 out of 40) of the samples with a 1.58 log reduction through the treatment plant. Adenoviruses and TTV both indicated a resistance to chlorine disinfection.
Based on prior research, TTV appears to offer potential as an indicator of viral pathogens in waters (Griffin et al., 2008). However, the rate of detection may be variable based on geographical region, water type, and the detection methodology. Most data available to date have been collected outside of the United States. The objective of this research was to determine the occurrence of TTV in feces and waters in the United States, and determine its value as an indicator organism for human fecal contamination and viral pathogen risk.
Experimental Protocols
Field sampling
Occurrence of TTV in animal feces, wastewaters, and drinking waters was evaluated by collecting and analyzing samples from four geographical regions in the United States (Northeast, South, Midwest, and West) to assess spatial variability, and in four seasons to assess temporal variability. Additional data were collected on coliform density, coliphage density, and human adenovirus presence. Samples were collected approximately monthly from June 2010 to April 2011 (feces and wastewaters) and May 2011 to March 2012 (drinking waters). Fresh feces (n=75) were collected from chicken, dogs, horses, donkeys, rabbits, cows, goats, llama, and sheep. Wastewaters (n=24; 1 L samples of raw, primary settled, and final effluent prior to disinfection) and drinking waters (n=72; 1 and 20 L samples of raw, treated/partly treated, and distribution system samples) were collected as grab samples from each of the treatment facilities. The 20 L samples were concentrated using hollow fiber ultrafiltration (HFUF) to a final volume of approximately 400 mL to provide suitable detection limits. HFUF with a 30,000 Da molecular weight cutoff has been demonstrated to quantitatively concentrate a variety of microorganisms from source water and drinking water matrices, including MS2 coliphage, noroviruses, and adenoviruses with recovery efficiencies ranging from 70% to 120% (Hill et al., 2005, 2007; Olstadt et al., 2008; Sibley, 2008).
Indicator organism enumerations
Total coliforms and Escherichia coli were enumerated in accordance with Standard Method 9223, the enzyme substrate test (APHA et al., 2005) using Colilert® (IDEXX, Westbrook, ME) in a multiple well format (Quanti-Tray®; IDEXX). Samples were diluted or concentrated as needed to achieve acceptable detection limits. Positive (E. coli, ATCC #11775) and negative controls were completed for each sampling event. Coliphages were enumerated using the single agar layer procedure with diluted or concentrated samples as appropriate (Method 1602; U.S. EPA, 2001). Controls included agar negative control, host positive control, coliphage (MS2, ATCC #15597-B1 and φX174, ATCC #13706-B1) positive control, and matrix spikes. All reported values account for dilution/concentration.
Sample processing for virus analyses
As a result of the relatively small volumes (1–5 μL) typically analyzed in PCR, it is often necessary to concentrate environmental samples prior to analysis to achieve reasonable detection limits. For this study, raw and treated wastewaters were considered to be potentially high virus content samples while source waters, partially treated drinking waters, and finished drinking waters were considered to be likely low viral content samples. Sewage samples or samples that might contain significant amounts of particulate matter were centrifuged prior to polyethylene glycol (PEG) precipitation. Both the primary pellet and the PEG pellet were subsequently processed for nucleic acid analysis. Briefly, sewage samples were collected in, or split into, 250 mL centrifuge bottles (Corning, Tokyo, Japan). Samples were centrifuged at 4,500 g for 15 min. This step produced sewage pellets and supernatant. The supernatant was withdrawn for further processing by PEG precipitation. The sewage and PEG pellets were refrigerated at 4°C until extraction was performed.
The following additives were added to the HFUF concentrate or wastewater supernatant in the specific order indicated and completely dissolved before the next additive was introduced. Desiccated Bacto™ beef extract (2% w/v; BD, Franklin Lakes, NJ) was dissolved into each sample at a ratio of 20.0 mg per mL of sample (4.0 g in 200 mL of sample). Next, NaCl (biological certified, Fisher Brand; ThermoFisher Scientific, Waltham, MA) at a ratio of 17.5 mg per mL of sample (3.5 g in 200 mL of sample) was added. Finally, PEG 8000 (Fisher Bioreagents; ThermoFisher Scientific) at a ratio of 100 mg per mL of sample (20.0 g per 200 mL of sample) was added. Dissolving the additives was achieved by hand-swirling the centrifuge bottles. The bottles were then incubated in a shaking incubator at 125 rpm at 4°C overnight. The next day, the PEG bottles were centrifuged at 5,000 g for 45 min. The supernatant was aspirated and discarded, and the bottles were centrifuged again at 1,900 rpm for 5 min. The remaining supernatant was aspirated and discarded. If centrifuged prior to PEG, the initial sewage pellets and PEG precipitation pellets were then combined, allowing for the recovery of both particle-associated and free viruses, prior to nucleic acid extraction.
Nucleic acid must be extracted from concentrated samples prior to analysis with a molecular-based assay. The optimized nucleic acid extraction and purification method used the MoBio Power Clean DNA kit. Nucleic acid extraction and purification was performed on sewage pellets, PEG pellets, or fecal samples, depending on the source of the original samples. The MoBio Power Clean DNA kit method consisted of adding the PEG pellets or fecal samples to PowerBead Tubes (MoBio) and processing according to the manufacturer's instructions with the following modifications. The volume of PEG and sewage or PEG pellet alone was typically about 2 to 2.5 mL in volume. Approximately 500 μL was added to each PowerBead Tube, and thus up to five or six tubes were used for any specific sample. Each tube was processed as a separate sample until the supernatant was mixed with Solution C4. At that point, as much solution from multiple tubes from the same pellet were applied to the same Spin Filter (MoBio). If the Spin Filter clogged, a second Spin Filter was then used. If one Spin Filter was used, it was extracted with 100 μL of Solution C6. If two Spin Filters were used, each was extracted with 50 μL of Solution C6 into the same collection tube. The nucleic acid extracts were then kept on ice until analyzed by PCR later the same day. All remaining extract volume was frozen a −20°C for further or reanalysis if necessary.
PCR assays
Details of each of the three PCR assays are summarized in Table 1. For all assays, an autoclaved lab water control was concentrated and analyzed as a method negative control, and nuclease-free water and master mix alone were used as PCR negative controls. A traditional PCR-based assay was adapted from those of Carducci et al. (2008) and Maggi et al. (2003) for determining the presence/absence of TTV in environmental samples, after screening a number of primer sets (both traditional and qPCR) from the literature. The selected primers (AMTS and AMTAS) are in the highly conserved untranscribed region of the genome, resulting in a 63 bp amplicon and provide detection of a variety of TTV human genotypes. A plasmid containing the 63 bp sequence was used as a positive control alone and as a matrix spike. Figure 1 presents a gel of six samples (one positive), negative controls and a plasmid-positive control demonstrating the clear identification of amplicons.
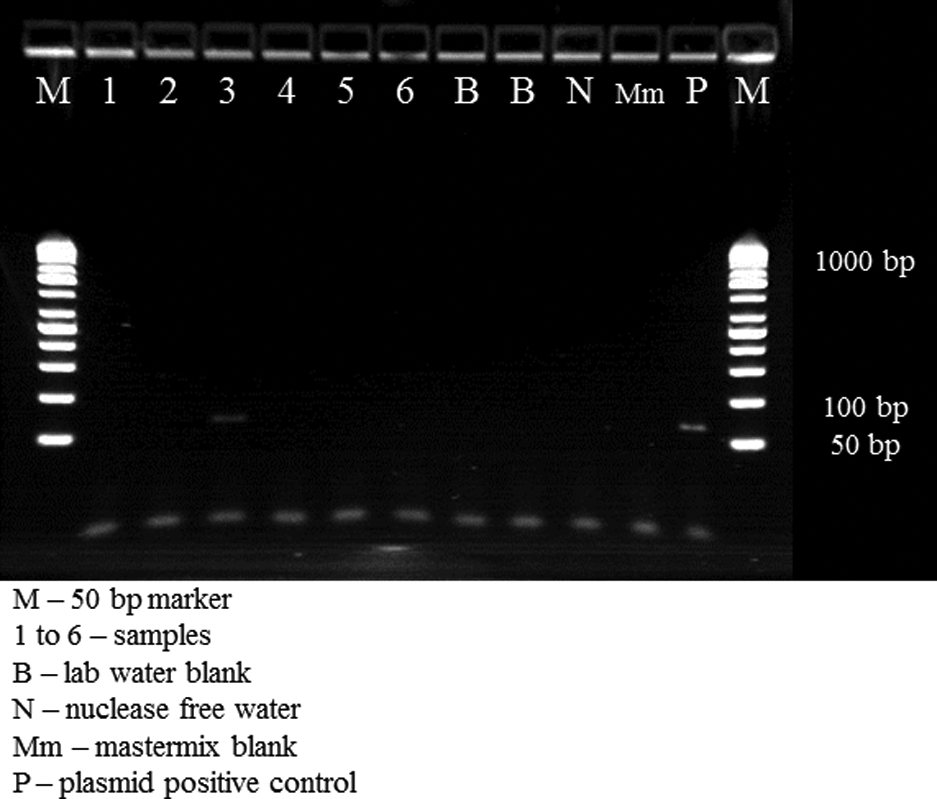
Gel of Torque teno virus polymerase chain reaction products.
PCR, polymerase chain reaction; TTV, Torque teno virus.
A pan-human adenovirus qPCR assay was developed with primer/probe sets, master mix conditions, and thermocyler program modified from those described by Jothikumar et al. (2005) and used for analysis of wastewaters and combined sewer overflows (Fong et al., 2009). The primer and probe set targets the nucleic acids between positions 18895 and 18968. The primers amplify a 96 bp fragment of the adenovirus hexon gene region. The reverse primer contains an inosine that allows a four-fold degeneracy and an R (G or A) that allows a two-fold degeneracy. This allows the primer set to amplify adenoviruses from serogroups A through F. Each nucleic acid extract was analyzed in duplicate.
The strength of the 16S rRNA gene signal was used to determine the extent of inhibition in nucleic acid preparations. A traditional PCR assay followed by visualization using gel electrophoresis was adapted from Rochelle et al. (1992, 1994). The primer set amplifies a 320 bp fragment of the 16S rRNA gene between 66F and 342R of the 3′ end of the 16S rRNA gene. These primers have been used to characterize the presence of α, β, γ, and δ-proteobacteria, Gram-positive bacteria, and cyanobacteria in environmental samples (Rochelle et al., 1994).
Confirmation of primer specificity
Specificity of the target amplified TTV sequence was determined via in silico analysis. The 63 base pair sequence (5′-GTG CCG AAG GTG AGT TTA CAC ACC GAA GTC AAG GGG CAA TTC GGG CTC GGG ACT GGC CGG GCT-3′) was subject to sequence alignment in the National Center for Biotechnology Information (NCBI) BLAST utility. The sequence was compared to the “nucleotide collection (nr/nt)” and the “16S ribosomal RNA sequences (Bacteria and Archaea)” sequence databases.
Statistical analysis
Correlations analyses between indicators and viruses were conducted utilizing IBM's Statistical Package for the Social Sciences (SPSS). The point biserial correlation was used as this test is valid for datasets where one variable is dichotomous (i.e., presence/absence) and the other is continuous. Critical values of r were determined for the appropriate degrees of freedom at the 95% confidence level (α=0.05) for each comparison and calculated r values larger than the critical r were considered significant.
Results
Indicator organisms
All samples were tested for total coliforms, E. coli, male-specific coliphages, and somatic coliphages (Table 2). Bacteria levels followed expected patterns, with concentrations in animal feces ranging from the tens of MPN per gram in horses to 108 MPN per gram in chicken. Raw wastewater concentrations were up to 108 MPN per 100 mL and were reduced through treatment. In drinking waters, numerous samples had concentrations below detection limits. For samples with detectable levels, total coliforms and E. coli were in the ones to thousands per 100 mL in untreated samples, with expected reductions through treatment. All groundwater samples were negative for bacterial indicators.
BDL, below detection limits; WW, wastewater; SW, surface water; GW, groundwater; “treated” includes partly treated samples
For coliphages, the percentage of nondetects was high in all sample groups as is consistent with occurrence data from other studies (Payment and Locas, 2011). In animal fecal samples, 41 of 75 samples (54.7%) were below detection limits for male-specific coliphages and 32 of 75 (42.7%) were below detection limits for somatic coliphages. Concentrations were highly variable, from the ones of pfu/g to greater than 2.5×10⁷ pfu/g, depending on animal type. Raw wastewaters had from the hundreds to 105 pfu/100 mL and treated wastewaters from below detection limits to 105 pfu/100 mL. The percent of nondetects for coliphages was high in drinking water samples, and detectable levels were most often in the tenths to ones of pfu per 100 mL. Associations among indicator organism levels in these samples are more fully explored in Plummer et al. (2014).
Virus presence
Table 3 summarizes the data for TTV occurrence in feces. Three of 75 animal fecal samples (4.0%) were positive for TTV. The positive samples were from two domesticated companion dogs and one chicken. The low carriage rates among domestic and agricultural animals are consistent with the use of primers targeting human TTV. The positive samples were collected in the winter. However, conclusions regarding seasonality would be premature given the small number of samples that were TTV positive. In wastewaters (Table 4), 41.7% of samples were positive for TTV and TTV-positive samples were distributed among the four sampling regions without discernable patterns. However, seasonal trends were apparent. Considering all wastewater samples, the percentages positive in spring, summer, and winter were 33.3%, 0.0%, and 87.5%, respectively. In drinking water samples, ten out of 72 (13.9%) samples were positive for TTV (5.3% of source waters; 15.2% of partially treated and treated waters; and 20.0% of distribution system samples). The positives included one untreated groundwater and nine treated/distribution samples (three groundwaters and six surface waters). Positive results were found in all four seasons and in all four regions.
All three fecal samples positive for TTV were positive for 16S rRNA.
Human adenovirus presence/absence was determined for all fecal samples, all wastewater samples, and 44 drinking water samples. All 75 animal fecal samples were negative for adenoviruses as expected since the assay was specific for human adenoviruses. As shown in Table 3, both TTV and adenoviruses were rarely found in fecal samples (4.0% and 0.0%, respectively). The wastewater results are shown in Table 4. Human adenoviruses were more prevalent than TTV in wastewaters, with adenoviruses detected in 20 of 24 wastewater samples (83.3%), compared to 41.7% of samples positive for TTV. All raw and primary wastewater samples were positive for adenoviruses, and 66.7% of treated wastewaters (prior to disinfection). TaqMan chemistry was used for the adenovirus assay; however, quantification against a standard curve was not performed and thus presence/absence data for adenoviruses paralleled TTV results. Nevertheless, the mean Ct for raw and treated wastewaters was 33.1 and 35.5, respectively, demonstrating approximately one log10 reduction in adenovirus concentration through treatment. All of the 44 drinking water samples that were tested were negative for adenoviruses (Table 5).
The 16S rRNA assay was conducted on all samples analyzed for adenoviruses. For the fecal samples, 58 of 75 samples were positive for the 16S RNA gene. The negatives included 14 grazing animals, one dog, one chicken, and one rabbit. For the wastewater samples, 23 of 24 were positive. Two of the wastewater samples produced bands weaker in intensity than others: Northeast winter effluent and Northeast summer effluent. These were treated wastewaters, and the total bacterial load was lower in these samples (coliform concentrations on the order of 103–105 MPN/100 mL compared to average levels of 107 MPN/100 mL in samples with clear bands; similarly, E. coli levels were 3–4 orders of magnitude lower). This may have resulted in less concentrated PCR products in these samples. Diniz-Mendes et al. (2008) found that some samples with negative TTV results were positive after a 10-fold dilution, suggesting inhibition in the more concentrated samples. Overall, these results indicate that approximately 4–23% of the wastewater and fecal samples may demonstrate inhibition based on negative results for the 16S rRNA assay. However, samples with inhibition or poor amplification and samples negative for TTV do not correspond.
For drinking waters, treated and disinfected drinking water can be assumed to be very low in bacterial content and bacterial nucleic acid content. Therefore, no amplification or weak amplification of the 16S rRNA gene can be expected in samples with very low bacterial loads. Results indicate that inhibition of the PCR may be present in approximately 11% of samples (five samples: two raw, one treated, and two distribution system samples). These results lend confidence in the samples that tested positive for TTV and adenoviruses as true positives. Coliforms and E. coli were below detection limits in the three treated/distribution system samples.
Discussion
Research has demonstrated that TTV has been associated with various bird species (e.g., chicken, geese, and pigeons), cows, pigs, dogs, cats, and nonhuman primates and humans (e.g., Biagini et al., 2006; Hino and Miyata, 2007). Amplified sequences from TTV-positive swine, dogs, and cats were similar, but not identical, to TTV sequences amplified from humans (Leary et al., 1999a) and range between 2.1 and 2.9 kb in length (Okamoto et al., 2002). Brassard et al. (2008) found TTV in the plasma of 90.5% of a swine herd, and the feces of 60.3% of the same herd, while much lower prevalence (1.1%) was observed in the plasma of a cattle population in Quebec. Other studies have found 25% of cows tested positive for TTV DNA (Leary et al., 1999a). The AMTS/AMTAS primer sets used in this project were published as specific to human TTV strains (Maggi et al., 2003; Carducci et al., 2009). The BLAST search for the 63 base pair sequence from the “nucleotide collection (nr/nt)” database returned 100 most highly matching sequences. All were from TTV isolates, and demonstrated 97–100% alignment with the 63 base sequence. Of the 100 sequences, 90 were human-derived TTV samples (clinical human blood, tissue samples, and blood samples). The remaining 10 samples came from unpublished studies or publication in which the origin was not specified by the authors. When the “16S ribosomal RNA sequences (Bacteria and Archaea)” database was searched for the 63 base pair sequence, no matches were returned. The in silico analysis confirms the empirical data demonstrating a specificity of the AMTS/AMTAS primer set to be on the order of at least 90% specific for human TTV. Thus, TTV presence in animal fecal matter would not be expected in this study. TTV was found in 4.0% of fecal samples, including two companion dogs and one chicken potentially indicating cross-inoculation between the animals and their human caretakers. However, it is unknown whether contact between humans and animals permits transmission.
Results from this study in conjunction with other studies indicate that occurrence of TTV in water and wastewater samples may be highly influenced by population carriage rates. Prior research has demonstrated the varying prevalence of TTV in raw wastewater samples. Haramoto et al. (2005a) found a positive TT virus signal in 97% of wastewater influent samples over a 1-year period and Hamza et al. (2011) found TTV in 50% of wastewater samples, with concentrations lower than that of other enteric viruses. Carducci et al. (2008) found secondary and final effluent were positive for TTV 18% and 24% of the time, respectively. In India, TTV was isolated in 13% of wastewater influent samples and 2% of wastewater effluent samples using 40 mL sampling volumes (Vaidya et al., 2002). In this study, 50.0% of raw wastewater samples were positive for TTV, and 41.7% of effluent samples (prior to disinfection) were also positive analyzing 200 mL samples. These relatively low positivity rates can be a reflection of the relatively low prevalence of serum TTV positivity in the United States (Desai et al., 1999).
Occurrence of TTV in drinking water sources can be compared to environmental samples in the literature. Haramoto et al. (2005b) found TTV in 5% of samples (500 mL volume) from the Tamagawa River in Japan, which is influenced by 10 wastewater treatment facilities along a length of 138 km, compared with 44% of samples positive for adenoviruses. Vecchia et al. (2012) found TTV in 28.6% of river samples in Brazil. The river was influenced by nontreated sewage in an urban area. TTV was found at a similar rate to adenoviruses (28.6% vs 21.4%). Hamza et al. (2011) found TTV and human adenoviruses in 50.0% and 97.3% of river samples that were within 1.5–9 km of wastewater discharges. In contrast, Diniz-Mendes et al. (2008) found TTV in 92% of samples in polluted streams in Brazil. In this study, 5.3% (1 of 19) of raw drinking water samples were positive for TTV and the one positive sample was from a groundwater well. No surface water samples tested positive for TTV. The low detection rate found is likely related to the lack of wastewater treatment plant influences in these source waters, and also the combination of both surface and groundwater sources tested.
Some researchers hypothesized that the TTV particle is highly stable (Takayama et al., 1999; Verani et al., 2006) and thus environmental occurrence data should be associated with fecal pollution levels and sewage treatment practices. The occurrence data herein is comparable to data previously reported in Japan, but lower than many prior reports on polluted streams. In finished drinking waters, Vecchia et al. (2012) found a mild negative correlation between the percentage of sewage treated in a region and the detection of the TTV genome, with all samples negative for TTV in an area with 92% sewerage treatment. The presence of TTV in partially treated and distribution system samples (n=7) may reflect the stability of the virus particles. Distribution system biofilms have been demonstrated to accumulate and harbor enteric viruses (Skraber et al., 2005). Observationally, there were visible particles that could be sloughing tubercle biofilms in some of the distribution system samples that tested positive for TTV.
In this study, data on adenovirus presence were used to relate TTV to pathogen presence. Pina et al. (1998) found human adenoviruses in 93% (14/15) of raw sewage samples in Spain, compared with 100% (10/10) in this study. In drinking waters, Albinana-Gimenez et al. (2009) found human adenoviruses in 100% (9/9) and 83% (10/12) of raw river water samples from two treatment plants. For the latter plant, a wastewater plant effluent was located a few meters upstream from the drinking water intake. Adenoviruses were also found in groundwater sources (67%, 4/6). Here, all raw drinking water samples were negative for human adenoviruses. Because adenoviruses are relatively stable in the environment (Bofill-Mas et al., 2000), negative results can be interpreted as a lack of fecal pollution. Calgua et al. (2013) found human adenoviruses in 100% (12/12) of river samples in Barcelona and Rio de Janeiro due to contamination from sewage, and similar results were found by Puig et al. (1994) in polluted rivers in Spain. However, occurrence can widely vary at different sites and also temporally (Van Heerden et al., 2003; Wyn-Jones et al., 2011).
Conclusions on the usefulness of TTV as a fecal indicator can be drawn based on a comparison of data on fecal indicators, adenoviruses, and TTV. Vaidya et al. (2002) found TTV in 12.7% of raw sewage samples compared to 24.4% positive for human adenoviruses, with no significant difference between TTV and human adenoviruses (p=0.0744). Haramoto et al. (2005a) found that the concentration of coliforms did not correlate with the number of positive TTV samples in wastewaters. Carducci et al. (2009) found no significant correlations among the counts of the bacterial indicators, adenoviruses, and TTV in wastewaters. In contrast, Vecchia et al. (2012) concluded that TTV was a suitable marker for fecal contamination based on a correlation between TTV and E. coli (r=0.97) in tap water samples in Brazil.
The data collected herein were evaluated using the point biserial correlation at the 95% confidence level. As shown in Table 6, there were no correlations found between TTV and other parameters in feces or drinking waters. Both of these datasets had a low percentage of TTV-positive samples. In wastewater, TTV presence was correlated to male-specific coliphage. All of the raw/primary wastewater samples with relatively low male-specific coliphage concentrations (on the order of 105/100 mL or less) were negative for TTV, and only one of the treated wastewater samples with a relatively low male-specific coliphage concentration (on the order of 102/100 mL or less) tested positive for TTV. There were also samples with relatively high male-specific coliphage concentrations (greater than 105/100 mL for raw wastewater and greater than 102/100 mL for treated wastewater) that tested negative for TTV. TTV and human adenovirus results were not consistent in wastewater or drinking water samples. An overall lack of correlations between viruses and indicators is consistent with the limited literature data available (Noble and Furhman, 2001; Payment and Locas, 2011). In this study, results indicate that TTV is not strongly correlated to either fecal indicators or human adenoviruses, and thus is not a suitable fecal indicator in the United States.
p-values in parentheses. Statistically significant correlations in bold.
NT=not tested as all adenovirus results were negative.
Summary
Enteric viruses transmitted through water system via the fecal-oral route cause a significant disease burden worldwide. The ability to accurately predict fecal pollution and thus disease risk is thus critical for protecting human health. While coliforms and coliphages provide some benefits as indicators, a reliable indicator for viral pathogen risk has yet to be established. This study provides new data on TTV occurrence in animal feces, domestic wastewater, and drinking waters in the United States, and compares these data to indicator concentrations and adenovirus presence to determine the usefulness of TTV as a fecal pollution indicator.
TTV occurrence was low in nonhuman animal feces (4.0%), demonstrating the specificity of TTV for human fecal contamination. In domestic sewage, 50.0% of raw wastewater samples were positive for TTV, and TTV occurrence in wastewater was not correlated to fecal indicator bacteria. Occurrence was low in drinking waters, including source drinking water (5.3%), treated/partially treated drinking water (15.2%), and distribution system samples (20.0%). While TTV presence was correlated to male-specific coliphages in wastewaters, no correlations were found between TTV and indicators in feces or drinking waters. Adenoviruses were detected in all raw wastewater samples (indicative of human fecal contamination), and analysis of nonhuman animal feces showed the human adenovirus assay to have a higher degree of specificity than TTV. In addition, all drinking waters were negative for adenoviruses, corresponding to low or below detection limit values of fecal indicators in these samples. The lower detection rate of TTV versus adenoviruses in samples with known fecal contamination (raw wastewater) demonstrates that TTV is not an ideal indicator in the United States, where blood serum levels of TTV are low compared to global prevalence.
Footnotes
Acknowledgments
Daniel Roop was a student at WPI at the time of this study and assisted with indicator organism monitoring data collection. We would also like to acknowledge the assistance of Samantha Scott, Jeremy Olstadt, Beth Pfotenhauer, Mark D. Walter, and Jonathan Wenzel who assisted with project work. This work was funded in part by the National Science Foundation (CBET-0853459) and Water Research Foundation (Project #04288). The conclusions and opinions are those of the authors and do not necessarily reflect those of the funding agencies.
Author Disclosure Statement
No competing financial interests exist.