
Abstract
Abstract
Chemical modeling calculations and batch tests were carried out to investigate the effect of solution chemistry on formation of phosphate precipitation in synthetic flushed dairy manure wastewater for phosphorus recovery. Saturation index (SI) of different calcium phosphate precipitates in solution with a PO43− concentration range of 0.032–9.8 mM (1–300 mg P/L), Ca/P molar ratio of 1–20, pH value of 5.0–12.0, and the CO32− concentration of 0–100 mM was calculated separately using the geochemical aquatic modeling program, PHREEQC. Results show that the SI of calcium phosphate is the logarithmic function of Ca2+ and PO43− concentration, increasing with the increase of Ca2+ and PO43− concentrations. SI of calcium phosphate is the polynomial function of the solution pH value. SIs of hydroxyapatite (HAP) and tricalcium phosphate (TCP) increase with the growth of the pH value, while the SIs of octacalcium phosphate (OCP) and dicalcium phosphate dehydrate (DCPD) reach the maximum value at pH 9.0–9.5 and 7.0–7.5, respectively. The SI of calcium phosphate decreases with the growth of the CO32− concentration following a linear function pattern. Meanwhile, the SI of calcium phosphate decreases with growth of ionic strength following a logarithmic function pattern. In the case study of phosphate removal from synthetic flushed dairy manure wastewater, the PO43− removal trend under a different pH value and Ca/P molar ratios was closer to the predictions of thermodynamic modeling. CO32− can affect the PO43− removal efficiency and turn on the marked inhibiting effect on HAP growth, but does not obviously affect the structure of the precipitate.
Introduction
P
A large number of studies have been conducted to correlate specific reaction conditions with the formation order of the phosphate precursor phases, but the results often vary from study to study (Van Der Houwen and Valsami-Jones, 2001). Barone et al. (1976) observed a precipitation of DCPD onto the HAP seed crystals. Frèche and Heughebaert (1989) observed the precipitation of OCP and DCPD onto the seed crystals of OCP and DCPD, but no HAP precipitation was observed. Kim et al. (2006) were able to identify TCP, DCP, and HAP, using converter slag as the seed material for P crystallization. Similarly, by means of XANES (X-ray absorption near-edge structure) spectroscopy, Sato et al. (2005) found that TCP and DCP were important phases in poultry manure and no OCP or HAP was found, although both these more crystalline phases are common in soils (Beauchemin et al., 2003).
There are a lot of factors that may control or influence the precipitation of calcium phosphates in solution, such as the concentrations of PO43− and Ca2+, the pH value (Verbeeck and Devenyns, 1992; Hosni et al., 2007), the ionic strength, the temperature, and the impurities of solution (Feenstra et al., 1981; Melikhov et al., 1989). It is still not very clear how these factors affect the precipitation of calcium phosphates, especially under the conditions of PO43− recovery from wastewater. There is a great need of additional information about the effects of the controlling and influencing factors on the precipitation of calcium phosphates from solution (Song et al., 2002). Thermodynamic calculation is an effective approach to evaluate the effects of solution conditions on the precipitation of calcium phosphates (Koutsoukos et al., 1980) with the continuously developing computer programmer supplying researchers with convenient tools to realize these calculations.
In this article, a geochemical aquatic modeling program, PHREEQC version 2.11 (Parkhurst and Appelo, 1999), was applied to the calculation of the speciation and saturation index (SI) for the precipitation of different forms of calcium phosphate from a chemically defined precipitation system, with the effects of Ca2+ and PO43− concentrations, pH value, and ionic strength on the precipitation reaction being evaluated. The model calculations were compared with experimental results for phosphate precipitation in synthetic flushed dairy manure wastewater. The thermodynamic calculations provided a basis for design and optimization of technologies for phosphate recovery from wastewaters.
Methods
Model simulation systems
SI of phosphate precipitates was calculated under a wide range of solution conditions, including the following: PO43− concentration ranging from 0.03226 to 9.677 mM, calcium to P molar ratios (Ca/P ratio) from 1 to 20, pH value from 5.0 to 12.0, and CO32− concentration from 0 to 100 mM. The 0.01 M KNO3 is taken as the inert electrolyte to adjust the solution ionic strength.
The following precipitation reactions in the Ca2+-PO43−-CO32− system were considered in the thermodynamic calculations:
SI is used to describe the saturation state of the reaction system for calcium phosphate,
where IAP and Ksp represent the free ionic activity product and the thermodynamic solubility product of the precipitate phase, respectively. For the Gibbs free energy change of the reaction, ΔG and the SI, there is (Song et al., 2002)
where R is the ideal gas constant, T is the absolute temperature, n is the number of ions in the precipitate compound.
When SI=0, hence ΔG=0, the solution is in equilibrium;
When SI<0, ΔG>0, the solution is undersaturated and no crystallization occurs;
When SI>0, ΔG<0, the solution is supersaturated and crystallization occurs spontaneously.
Therefore, the SI value and its variation with the solution conditions can be used to evaluate the effect of solution conditions on the tendency and extent of crystallization (Wang et al., 2006).
Before the calculations, the PHREEQC database should be amended to identify the key for the formation of each calcium phosphate crystal and thermodynamic control factors according to the need thereof. The main thermodynamic parameters reported by McDowell et al. (1977) were adopted.
Batch experiments
Experiments were conducted in a 2,000-mL plexiglass precipitation reactor with a stirring rate of 1,000 rpm at room temperature of 25°C±2°C. Before the experiments, three stock solutions containing Ca2+, PO43−, and CO32− were prepared by dissolving CaCl2·2H2O, KH2PO4, and Na2CO3 into deionized water, respectively. Referencing to the component analysis of flushed dairy manure wastewater (Cao and Harris, 2008), the PO43− concentration of the reaction solution was kept at 0.645 mM and the molar ratio of Ca/P was set as 1.67, 3.33, and 5.01 in all the experiments. Meanwhile, a certain amount of CO32− aqueous solution (0.5 M) was mixed with the reaction solution in the reactor. Chemicals were introduced sequentially to avoid possible preemptive chemical reactions. When addition of chemicals was finished, the solution pH was immediately brought to and maintained at the defined constant value (±0.02) with 5.0 M NaOH and 5.0 M HCl and remained stable during the precipitation process. The precipitation was performed for 2 h, and water samples of 5.0 mL were collected at various time intervals and filtered (0.45 μm). The filtrate was immediately acidified with 2 μL of 6.0 M HNO3 to prepare samples for chemical analyses.
Analytical methods
The PO43− concentration was measured according to the standard method of the State Environmental Protection Administration of China (SEPA) (2002). The collected precipitate was washed with deionized water and then dried naturally at room temperature. To elucidate the possible mechanism responsible for the inhibitory effect, a portion of the as-precipitated solids were heated at 550°C for 3 h and cooled down at room temperature (Cao and Harris, 2008). The phases of the as-precipitated and heat-treated solids were identified using an X-ray diffractor (XRD, D8 Advance; Bruker).
Results and Discussion
Effect of PO43− concentration and Ca2+ concentration
The PO43− concentration is the determining factor to affect the SI of calcium phosphate. Thus, the impact of phosphate concentration on SI values of different calcium phosphate precipitates under varied pH, Ca/P molar ratios, and CO32− concentrations was studied. Within a chemically defined precipitation system, besides calcium phosphate at varied forms, the products may also be calcium carbonate. To illustrate the results, simulation calculation was conducted to find out the relationship between the PO43− concentration and SI of calcium phosphate and calcium carbonate precipitates under a pH of 9.0, Ca/P molar ratio of 1.67, CO32− of 5 mM, and PO43− concentration at 0.0323–9.677 mM (Fig. 1). It is shown in Fig. 1 that the SI values of HAP, OCP, TCP, and DCPD increase with increasing phosphate concentrations. The SI values are in the order of HAP>OCP>TCP>DCPD, indicating that HAP is the least soluble mineral in the system. Since CO32− coexists with Ca2+ in the system, the SI value of aragonite and calcite was also calculated, finding that the SI value of the calcium carbonate presents the rule of increasing first and then decreasing slightly with the increase of the PO43− concentration (Fig. 1). However, as for calcium carbonate, the relationship between its SI value and PO43− concentration is actually related with Ca2+. Although the relationship between the SI value of calcium carbonate and the PO43− concentration also agrees with the logarithmic relationship, it is shown by a relevant correlation coefficient that such fitting does not go on well with practical situations.

Effect of PO43− concentration on saturation index (SI) values of precipitates formed in the Ca2+-PO43−-CO32− system at 25°C, Ca/P=1.67, CO32−=5.0 mM, pH=9.0. Eight P concentrations (0.323, 0.645, 0.968, 1.290, 1.613, 1.936, 2.581, and 3.226 mM) used in the experiment were marked with grey. HAP, hydroxyapite; TCP, tricalcium phosphate; OCP, octacalcium phosphate; DCPD, dicalcium phosphate dehydrate.
The effect of the Ca2+ concentration on the SI of calcium phosphate was studied under the example condition of PO43− 0.645 mM, pH 9.0, and CO32− 5 mM. The simulated calculation results (Fig. 2) show that with the increase of the Ca2+ concentration, the SI values of HAP, OCP, TCP, and DCPD turn on a logarithm growing pattern thereof, presenting the general rule of SI values as HAP>OCP>TCP>DCPD. As for aragonite and calcite, it is found that the SI value of calcium carbonate will increase gradually as the Ca2+ concentration grows under a certain PO43− concentration, presenting the logarithmic relationship (Table 1).

Effect of Ca2+concentration on the SI value of the precipitation system with respect to calcium phosphate and calcium carbonate (25°C, PO43−=0.645 mM, CO32−=5.0 mM, pH=9.0). Three Ca concentrations (1.08, 2.15, and 3.23 mM) used in the experiment were marked with grey.
SI=Aln CCa+B, R2 is correlation coefficient.
DCPD, dicalcium phosphate dehydrate; HAP, hydroxyapatite; OCP, octacalcium phosphate; SI, saturation index; TCP, tricalcium phosphate.
As for the impact of Ca2+ concentration on the SI value of calcium phosphate and calcium carbonate at different forms, Equation (6) could be used to convert precipitation Equations (1)–(5) into the following:
where Cx is the concentration of the x ion, fi is the activity coefficient of the i-valent ion.
The effect of Ca2+ concentration, PO43− concentration, pH value, and CO32− concentration on the SI value of calcium phosphate and calcium carbonate would be clearly calculated by Equations (8)–(12), which indicates that a solution background value like ion strength could also affect the SI value. Thus, the slope and constant in each equation of Table 1 are determined by solution conditions.
Since different types of wastewaters have different PO43− concentrations, the adjustment of the Ca/P molar ratio becomes the important method to control the precipitation of calcium phosphate for P recovery.
Effect of pH value
The effect of the pH value on the SI of calcium phosphate and calcium carbonate at different forms was studied under the example condition of PO43− at 0.645 mM, CO32− at 5 mM, and Ca/P molar ratio at 1.67. The calculation results are shown in Fig. 3 and Table 2, in which it is found that the SI values of calcium phosphate and calcium carbonate turning out to be of polynomial function of the solution pH value. The variation situation of calcium and phosphate ion species and the ionic activity under variation of pH value are clearly identified by Fig. 4. With the increase of solution pH value, the SI value of HAP increases, becoming the highest SI value among varied calcium phosphate products. The SI value of TCP also increases as the pH value grows, which is just lower compared with HAP. As for OCP, from Equation (2), we could see that the configurational ions participating in the crystallization and precipitation reaction include Ca2+, H+, and PO43−. Within the pH value 5.0–9.5, the Ca2+ concentration decreases slightly and the PO43− concentration increases greatly with the increase of pH value. Although H+ decreases continuously during the process (Fig. 4), it does not become the limiting factor of the reaction. Thus, the SI value of OCP increases gradually and reaches the peak at pH value 9.0–9.5. Within the pH value 9.5–12.0, the PO43− concentration increases greatly and the H+ concentration decreases continuously with the growing of pH value. However, H+ decreases continuously during the process (Fig. 4), becoming the limiting factor, which leads to a gradual decrease of the SI value of OCP. Concerning DCPD, from Equation (4), we could see that the configurational ions participating in the precipitation reaction include Ca2+ and HPO42−. The HPO42− concentration increases first and then decreases with the growing of pH value (Fig. 4) and reaches the peak at pH 8.0. As a result, the SI value of DCPD reaches the peak at pH 7.5–8.0. The SI values of aragonite and calcite reach the peaks at pH 10.0–10.5.
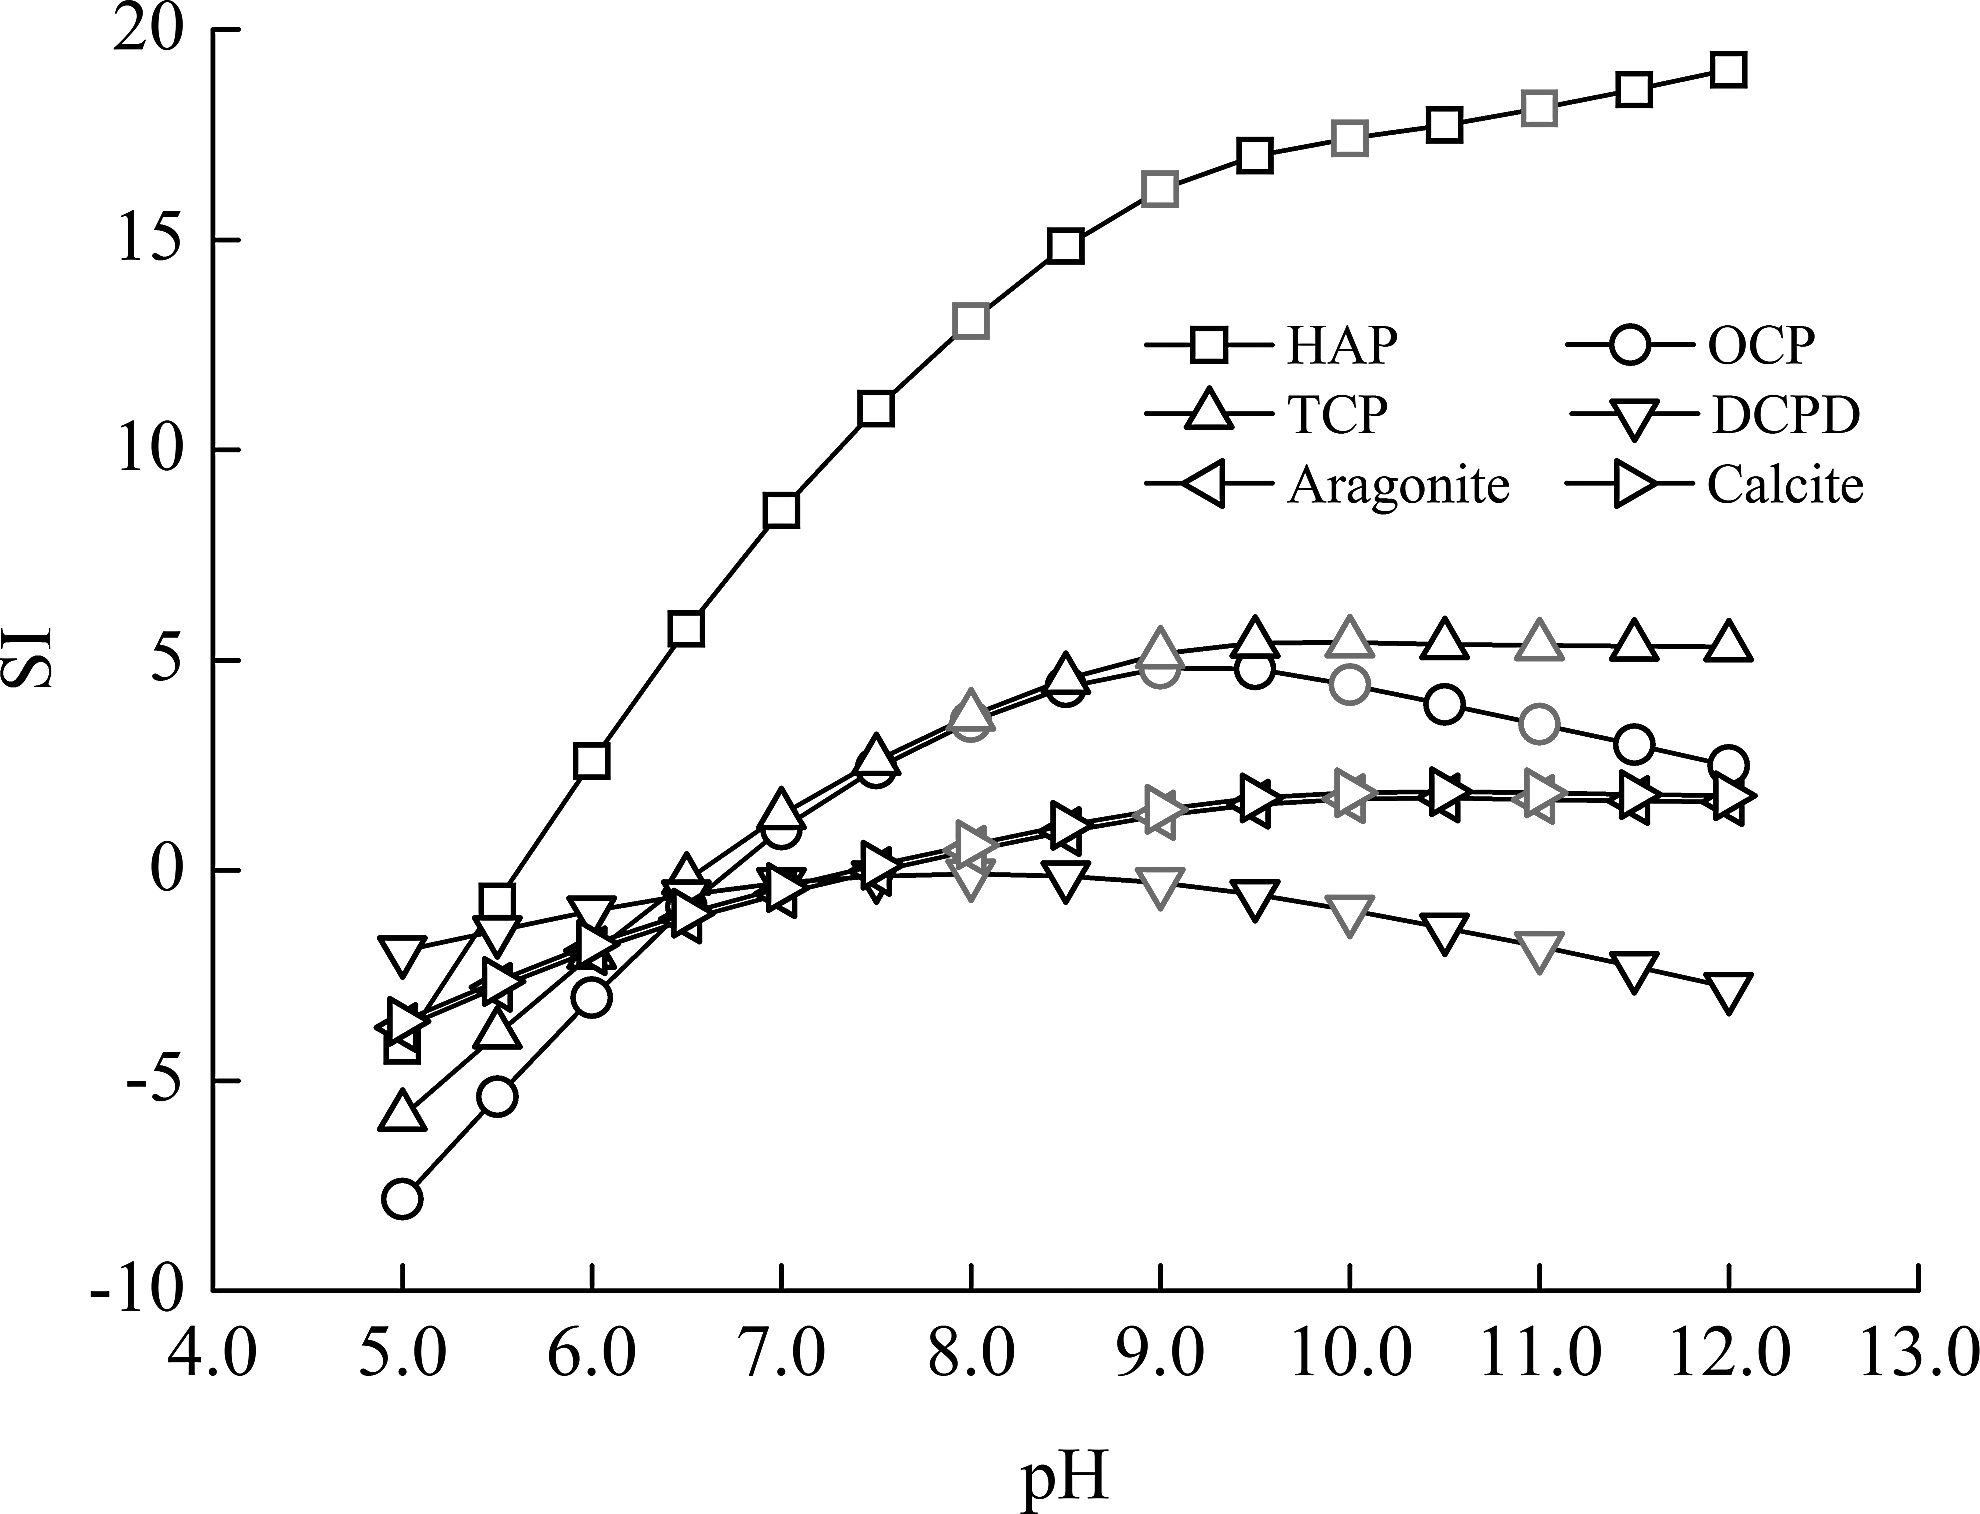
Effect of solution pH on SI value of the precipitation system with respect to different forms of calcium phosphate and calcium carbonate (25°C, PO43−=0.645 mM, Ca/P=1.67, CO32−=5.0 mM). Four pH values (8.0, 9.0, 10.0, and 11.0) used in the experiment were marked with grey.

The influence of pH value on the speciation with respect to different forms of calcium phosphate (25°C, PO43−=0.645 mM, Ca/P=1.67, CO32−=5.0 mM). Four pH values (8.0, 9.0, 10.0, and 11.0) used in the experiment were marked with grey.
y=SI, x=pH, R2is correlation coefficient.
Based on the above results, we can see that the adjustment of pH value in solution is another important method to control the precipitation reaction of calcium phosphate during P recovery. The adjustment of pH value to be within 8.0–9.0 is feasible in practical P recovery from wastewater.
Effect of CO32− concentration
The CO32− concentration is the key factor maintaining pH value stability in solution for natural water or the wastewater system (Danen-Louwerse et al., 1995; Hartley et al., 1997). In this part, the effect of solution's CO32− concentration on the SI value was studied under the example condition of PO43− at 0.645 mM, pH value at 7.0 and 9.0, and Ca/P molar ratio at 1.67. The results are shown in Figs. 5 and 6.

Influence of CO32− concentrations on the speciation of calcium and carbonate (25°C, PO43−=0.645 mM, Ca/P=1.67). Four carbonate concentrations (2.5, 5.0, 10.0, and 15.0 mM) used in the experiment were marked with grey.
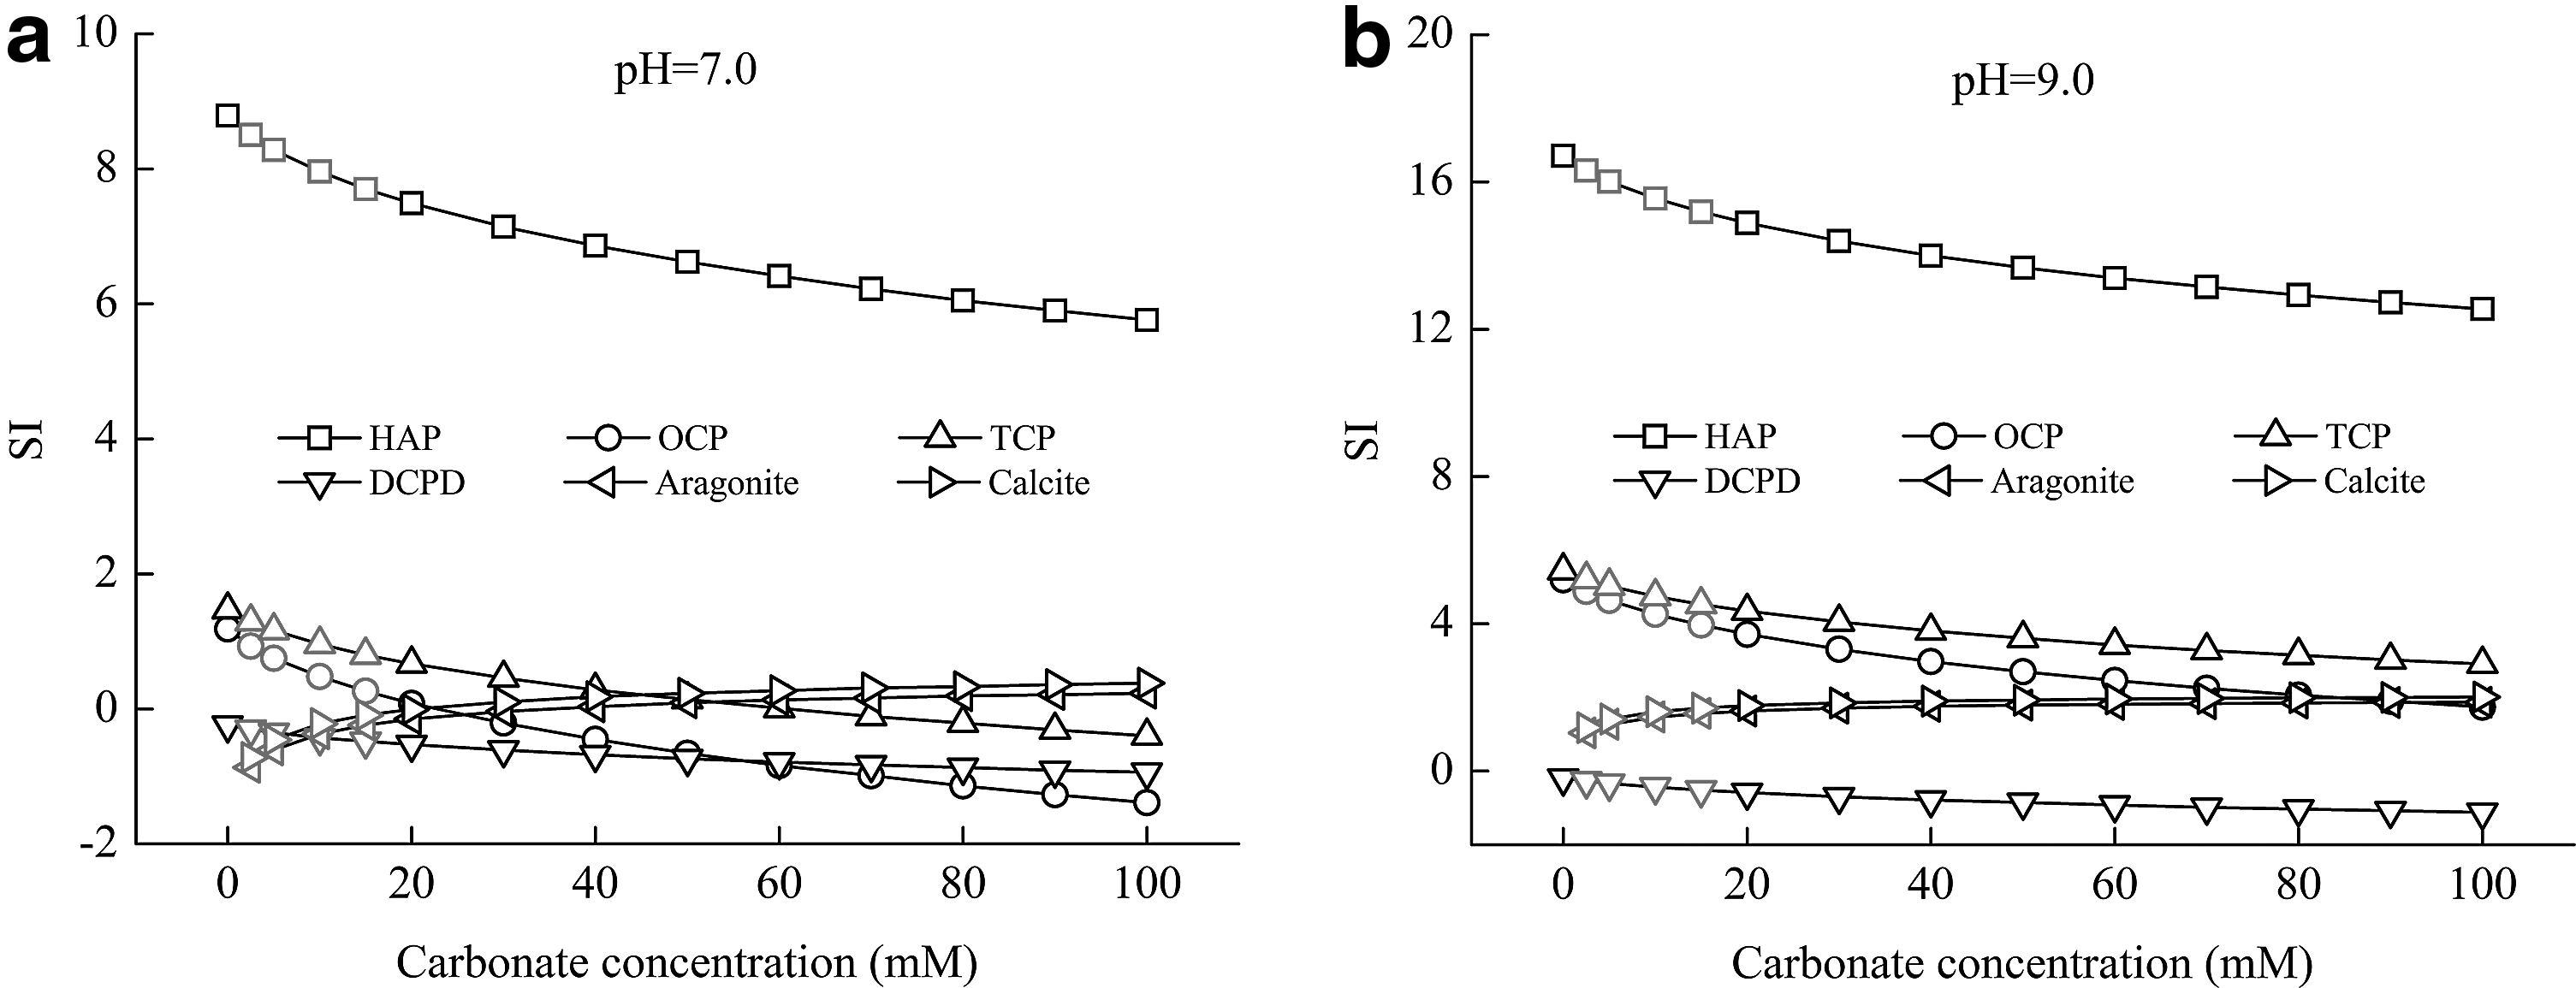
Effect of CO32− concentrations on the SI value of the precipitation system with respect to calcium phosphate and calcium carbonate (25°C, PO43−=0.645 mM, Ca/P=1.67). Four carbonate concentrations (2.5, 5.0, 10.0, and 15.0 mM) used in the experiment were marked with grey.
When adding calcium salt to recover P in the water solution system containing CO32−, CO32− may precipitate in the form of calcium carbonate, which will affect the precipitation of calcium phosphate inevitably. The ion pair formed by CO32− and Ca2+ will affect the activity and concentration of free Ca2+. In Fig. 5, it is found that under the same pH value, the activity and concentration of CaCO3(aq) and CaHCO3+ both increase as the CO32− concentration increases, while that of Ca2+ decreases. However, under the same CO32− concentration, the growing of pH value leads to decrease of CaHCO3+ activity and concentration. All these result in variation of the supersaturation state in solution. In Fig. 6, it is shown that under the same pH value, the SI value of calcium phosphate decreases as the CO32− concentration increases, turning on a better linear relationship to the CO32− concentration. Regarding calcium carbonate, the SI value increases gradually with the growing of the CO32− concentration, turning out to be the logarithmic function of CO32− concentration. The SI values of calcium phosphate and calcium carbonate both grow with the increase of pH value under the same CO32− concentration. However, at a pH value of 7.0, the calcium carbonate SI value would be more than 0 only at the CO32− concentration >20 mM. With the pH value of 9.0, the SI value of calcium carbonate is more than 0 under simulated conditions.
Thus, in the wastewater containing CO32−, the pH value should be increased appropriately to reduce the impact of CO32− on the precipitation reaction of calcium phosphate.
Effect of ionic strength
The concentration of ions in different wastewater differs, since the wastewater source differs. Besides, the ion concentration in aqueous solution is quite different because of regional differences. All these differences cause an influence on the crystallization of calcium phosphate. It was reported that in the hard water area of Germany, the ionic strength of wastewater was 0.021 M, nevertheless the Japanese wastewater had an ionic strength of 0.011 M (Donnert et al., 1988; Zhang et al., 2010).
To study the effect of solution ionic strength on the SI of calcium phosphate and calcium carbonate at different forms, simulated calculation was conducted under the condition of PO43− at 0.645 mM, pH value at 7.0 and 9.0, Ca/P molar ratio at 1.67, and CO32− at 5.0 mM. The results are shown in Fig. 7, in which it is clear that the SI value of calcium phosphate at different forms decreases with the increase of ionic strength in solution under the same pH value. As for calcium carbonate, the SI value thereof turns on the same rule decreasing with the growth of ionic strength. Although the ionic strength was difficult to adjust for the treatment of hard wastewater, after the effect of the ionic strength is understood, we could consider reducing the concentrations of the reactant at certain conditions or to improve the pH value so as to eliminate the negative influence of ionic strength.

Effect of solution ionic strength on the SI value of the precipitation system with respect to calcium phosphate and calcium carbonate (25°C, PO43−=0.645 mM, CO32−=5.0 mM, Ca/P=1.67). Four ionic strengths (0.03, 0.04, 0.05, and 0.06 M) used in the experiment were marked with grey.
Phosphorus removal from synthetic flushed dairy manure wastewater
Compared with thermodynamic modeling of calcium phosphate precipitation, the experiments on phosphate removal from synthetic flushed dairy manure wastewater by calcium phosphate precipitation were investigated.
P removal efficiency under varied solution pH value and Ca/P molar ratios is shown in Fig. 8 with the reaction time of 120 min. It shows that the precipitation of phosphate was positively correlated with the solution pH value, following polynomial function relationship thereto. The experimental results were closer to the predictions of thermodynamic modeling (Fig. 3).

Precipitated P with respect to solution pH value at different Ca/P molar ratios.
XRD patterns are shown in Fig. 9. As expected from the modeling results, the most thermodynamically stable HAP formed in solution without CO32−, although it was poorly crystalline as indicated by three broad HAP-derived main peaks at 2θ=25.8°, 28.3°, and 31.9° (Fig. 9a). Thermal treatment of the HAP powder improved resolution of the XRD peaks (Fig. 9b), especially the peak at 2θ=34.0°, due to the increased crystallization of HAP at an elevated temperature (Suchanek et al., 2004). When the CO32− concentration was 5.0 mM in solution, ACP precipitated as showed by a typical broad peak of the ACP between 2θ=25.0° and 35.0° (Fig. 9a). Thermal treatment induced crystallization of ACP, forming crystalline HAP, but affects the purity of HAP. Thus, CO32− can affect the P removal efficiency with an apparent inhibiting effect on HAP growth, yet no obvious effect on the structure of the precipitate.

X-ray diffractor spectra of precipitation product dried at room temperature
Conclusion
(1) The calcium phosphate SI value is the logarithmic function of Ca2+ and PO43− concentration, increasing with the growth of its composing ion concentration.
(2) The calcium phosphate SI value is the polynomial function of solution pH value. The SI value of HAP and TCP increases as the solution pH value grows. The SI value of OCP and DCPD reached the maximum value at pH 9.0–9.5 and pH 7.0–7.5, separately.
(3) The calcium phosphate SI value is the linear function of CO32− concentration, decreasing with the increase of CO32− concentration. The calcium phosphate SI value is also the logarithmic function of ion strength in solution, decreasing with the increase of ion strength.
(4) As the side reaction of calcium phosphate crystallization, the calcium carbonate SI value turns out to be a logarithmic function of Ca2+ concentration and CO32− concentration. It is also the polynomial function of solution pH value, decreasing with the increase of ion strength.
(5) In the case study of P removal from synthetic flushed dairy manure wastewater, the PO43− removal trend at different pH values and Ca/P molar ratios fits to the predictions of thermodynamic modeling. CO32− can affect the phosphate removal efficiency with an apparent inhibiting effect on HAP growth, yet no obvious effect on the structure of the precipitate.
Footnotes
Acknowledgment
The study was supported by the National Natural Science Foundation of China No. 51078339 (2011.1–2013.12).
Author Disclosure Statement
No competing financial interests exist.