
Abstract
Abstract
Transport of dissolved organic matter (DOM) from the Suwannee River and of synthetic polystyrene sulfonates (PSSs) was investigated in columns packed with naturally Fe/Al-oxide-coated sands from Oyster, Virginia. Surface-water samples were collected in May 2012 and processed by XAD-8 (humic substances; HPOA), XAD-4 (transphilic acids [TPIAs]), and reverse osmosis (broad range of components; NOM). Median transport time (Ro) of PSSs increased with molecular weight (MW) from 1,000 to 8,000 Da but decreased for the largest PSS (18,000 Da), which is consistent with previous observations of MW effects on DOM adsorption and transport. Breakthrough curves (BTCs) of HPOAs and NOM were similar whereas TPIA transport was distinct; although all DOM samples had similar Ro values, BTC asymmetry and dispersivity were greater for TPIAs. All samples exhibited power-law tailing that is characteristic of heterogeneous sorbent/sorbate interactions, potentially including kinetic effects. The one-dimensional advection-dispersion equation was unable to capture the tailing but it was captured well using a continuous-time random walk (CTRW) model. CTRW parameters were similar for the NOM and HPOA samples but distinctly different for TPIAs, which had more pronounced tailing. While retardation of organics generally tends to increase with MW, the lower average MW of TPIAs did not result in decreased overall retardation, which suggests the importance of compositional differences. Results suggest that while TPIAs tend to be a relatively minor component of DOM, their transport behavior differs from that of the predominant HPOA fraction, and they might thus have different impacts on pollutant transport.
Introduction
A
Cabaniss et al. (2000) summarized how molecular weight (MW) may affect sorption and mobility of aquatic humic substances (HSs), which represent an important fraction of DOM in many environments. Smaller (i.e., lower MW) HS components diffuse rapidly and tend to be more hydrophilic, leading to greater mobility, whereas higher MW compounds tend to sorb more slowly but preferentially to Fe and Al oxide and aluminosilicate surfaces (Gu et al., 1995; Wang et al., 1997; Cabaniss et al., 2000; Namjesnik-Dejanovic et al., 2000; Zhou et al., 2001; Hur and Schlautman, 2003). Preferential adsorption of intermediate-to-high MW components leads to “adsorptive fractionation” wherein the composition of the dissolved phase becomes different from that of the adsorbed phase (McKnight et al., 1992; Zhou et al., 2001). Aromaticity, carboxyl group content, and the presence of amino acid residues might also affect HS adsorptive fractionation (McKnight et al., 1992), although these characteristics often correlate in some manner with MW.
Meier et al. (1999) showed that DOM from the Suwannee River (GA, USA) adsorbed more strongly onto goethite than onto kaolinite. High-pressure size exclusion chromatography (HPSEC) analysis of solution-phase DOM suggested that reactive surface sites were occupied disproportionately by large- and intermediate-MW components. Zhou et al. (2001) observed that lower MW DOM components adsorbed more quickly to goethite but were gradually replaced by intermediate-to-higher MW components. They also observed that a fraction of very-low-MW components tended to be nonadsorbing and that the highest-MW components did not adsorb at high organic matter surface coverages, perhaps due at least in part to electrostatic repulsion (large molecules would also have high overall charge). Recently, Lippold and Lippmann-Pipke (2014) showed that fulvic acid adsorption onto kaolinite attained dynamic equilibrium and was reversible, which is an important prerequisite for application of widely used transport models.
Dunnivant et al. (1992) measured breakthrough curves (BTCs) for DOM in columns packed with aquifer sediments and observed delayed breakthrough of more hydrophobic (i.e., HS-like) subcomponents. McCarthy et al. (1993, 1996) noted greater mobility of smaller (<3 kDa), more hydrophilic DOM relative to larger, more hydrophobic, HS-like components in a field-scale study of a sandy aquifer. Seders Dietrich et al. (2013) applied HPSEC to analyze HS-rich DOM MW distributions in column influent and effluent and showed that retardation factors increased with increasing MW except for the highest-MW fraction. BTCs for HS-rich DOM samples in sand-packed columns are generally characterized by an initial steep rise followed by extensive power-law tailing. This suggests rapid breakthrough of some components followed by slower breakthrough of others (Johnson and Amy, 1995; Seders Dietrich et al., 2013; McInnis et al., 2014). The mechanisms controlling this tailing are not clear, but for hydrologically homogeneous porous media they have been attributed to time-dependent adsorption (Dunnivant et al., 1992), heterogeneous adsorption kinetics (Jardine et al., 1992), and/or different and nonlinear adsorption affinities (Seders Dietrich et al., 2013).
This article examines differences in the transport behavior of XAD-8 (HS, designated HPOA) and XAD-4 (“transphilic” acids [TPIAs]) isolates and a reverse osmosis (RO) (designated “NOM” by the International Humic Substances Society [IHSS]) concentrate from the Suwannee River (SR) in columns packed with naturally Fe- and Al-oxide-coated aquifer sands. Given that the average MW, polydispersity, and aromaticity of an aquatic DOM sample tend to be sensitive to the method of isolation (Maurice et al., 2002, and articles in this issue), we hypothesized that the different processing methods could result in different transport behaviors. SR DOM tends to be dominated by relatively large HS (i.e., HPOAs) components. Thus, we further hypothesized that transport of NOM and HPOAs would be broadly similar but distinctly different from that of TPIAs.
The physicochemical complexity of DOM samples makes it impossible to determine the effects of MW, alone, on transport. Therefore, we conducted a series of analogous column experiments using polystyrene sulfonates (PSSs), polyelectrolytes, that are often used as MW standards for DOM analysis (Chin et al., 1994; Kuhn et al., 2014) and sometimes as “chemically homogeneous” DOM surrogates in adsorption experiments (e.g., Karanfil et al., 1996). Although PSS standards have different functional groups and charge distributions than HSs and higher radii of gyration, they allow for determination of MW effects without compositional complexities. MWs of the PSS standards used here ranged from 1,000 to 18,000 Da.
BTCs were modeled using a conventional one-dimensional advection-dispersion equation (1D ADE) approach and a more general nonlocal-in-time, continuous-time random walk (CTRW) model (Cortis and Berkowitz, 2004; Berkowitz et al., 2006; Dentz and Castro, 2009; Dentz and Bolster, 2010). The theoretical considerations behind the CTRW (and the ADE) approach and relevant equations are described in detail in the Supplementary Data. In brief, the CTRW is a theoretical generalization of the ADE that allows for modeling of more complex behaviors. The ADE assumes that the amount of time it takes for a solute to traverse a given distance is narrowly distributed. However, when dealing with complex heterogeneous systems, such as arise with DOM, this distribution can be broad as indicated, for example, by power-law tails in BTCs. Using CTRW, the multicomponent DOM system is represented as a continuum containing an infinite number of individual fractions, and parameters for individual solute “particles” are sampled from a distribution function. Application of CTRW modeling to DOM transport was recently developed by McInnis et al. (2014). The main parameters associated with the 1D ADE and CTRW and some of their implications for transport are summarized in Table 2.
An asymmetrical BTC will result in divergent Ro and Rm values.
The earliest part of a DOM BTC tends to be dominated by V, the latter part by the power-law structure. Distinct behaviors in V, D, and β can lead to BTC crossovers. However, caution must be taken in interpreting these parameters as nontrivial interactions may occur between them. For a more in-depth and quantitative understanding of CTRW as applied to DOM, see McInnis et al. (2014).
Materials and Methods
Natural organic matter samples
SR DOM was collected on May 3–17, 2012, as part of an IHSS sampling trip led by E.M. Perdue (Green et al., 2014). The SR water had average temperature of 25°C, pH of 3.68, and a dissolved organic carbon (DOC) concentration of 82.7 mg C/L (Green et al., 2014). Sample collection and processing are described by Kuhn et al. (2014) and Green et al. (2014). Briefly, bulk river water was filtered through a 1-μm polypropylene filter, a 0.40-μm Nuclepore® filter, and a digital flow totalizer into a polypropylene sample reservoir to produce raw filtered surface water (RFSW) from which 36,000 L was processed by RO following the methods of Serkiz and Perdue (1990) to produce the sample designated “NOM” by the IHSS (reference sample 2R101N).
RFSW was filtered as described previously at various intervals over the sampling period, stored in refrigerated 20-L Nalgene® HDPE (high-density polyethylene) carboys, and shipped to the U.S. Geological Survey Laboratory of Dr. George Aiken (Boulder, CO) in ice-filled coolers. DOM was fractionated using Amberlite® XAD-8 and XAD-4 resins (Thurman and Malcolm, 1981; Aiken et al., 1992). The XAD-8 isolate is designated HPOAs (for “hydrophobic acids”) and the XAD-4 isolate, TPIAs (for “transphilic acids”). The RFSW contained 60% hydrophobic organic acids, 18% transphilic organic, 13% hydrophilic acids, 4% hydrophobic organic neutrals, and 5% transphilic and hydrophilic neutrals (Kuhn et al., 2014).
13C NMR analysis (Nwosu and Cook, 2014) showed that the TPIA sample was considerably less aromatic than the HPOA sample with the NOM sample intermediate (11.7%, 17.8%, and 14.8%, respectively); similarly, TPIAs had more heteroaliphatic character than the HPOA or NOM samples (24.4%, 14.5%, and 17.4%, respectively). This agrees with previously observed trends (Maurice et al., 2002). The “molar absorptivity” (ɛ280), which has been shown to correlate with HS aromaticity, was calculated from absorbance at λ at 280 nm and DOC concentrations to be in L/(mol C·cm): 486 for NOM, 461 for HPOAs, and 262 for TPIA. The number average MW (Mn) values determined by vapor pressure osmometry (VPO) (Pavlik and Perdue, 2014) were 634 g/mol for NOM, 583 g/mol for HPOAs, and 498 g/mol for TPIA. Mn values determined by asymmetrical flow field-flow fractionation (AsFlFFF) using absorbance detection at 254 nm were 1,461±7 Da for RFSW, 1,517±8 Da for NOM, 1,471±7 Da for HPOAs, and 1,095±5 Da for TPIAs (Kuhn et al., 2014). AsFlFFF values tend to be much higher for DOM than are values determined by VPO (Pavlik and Perdue, 2014). The AsFlFFF values may be useful for comparison between samples but should not be thought of as true MWs. Both types of measurements suggest that the TPIAs are of considerably lower MW than either HPOAs or NOM, as observed previously (Maurice et al., 2002).
Solutions containing SR TPIAs, HPOAs, or NOM (10.5±0.5 mg C/L) were made by dissolving freeze-dried samples in 0.01 M NaCl at pH 7 and readjusting pH with HCl and NaOH. We chose a pH higher than that of the original river water to be more representative of a typical shallow, sandy ground-water environment than an acidic stream. Seders Dietrich et al. (2013) and Mcinnis et al. (2014) showed that DOM retardation factors tend to decrease as pH increases from acidic to circum-neutral.
PSS samples
PSSs of nominal MW 1,000, 4,600, 8,000, and 18,000 Da (herein after referred to as PSS1, PSS4, PSS8, and PSS18) were obtained from Polysciences, Inc., and used without further purification. Individual PSS standards contain a reasonably narrow but not completely monodisperse MW distribution, as the manufacturer reports Mw/Mn<1.2. Electrolyte solutions (I=0.01 M NaCl, pH 7) containing 10.5±0.5 mg/L PSS were prepared by dissolving PSSs and ACS-grade NaCl in deionized (MilliQ®) water. Solution pH was adjusted to 7 using NaOH.
Oyster sand
The sand was from the U.S. Department of Energy research site in Oyster, Virginia. X-ray diffraction analysis revealed predominantly quartz with minor feldspar and clay (Seders, 2010). The grain surfaces are coated with metal hydroxides and clays (Dong et al., 2002); X-ray photoelectron spectroscopy analysis showed enrichment in Al/Si and Fe/Si relative to the bulk composition (Seders, 2010). Penn et al. (2001) observed nanometer-scale heterogeneity in surface coatings on Oyster sand. Prior to its use in column experiments, the sand was sieved to 0.420–0.842-mm diameter using 20–40 mesh sieves and rinsed repeatedly with distilled, deionized water following Seders (2010) and then baked in glassware covered with aluminum foil at 400°C for 2 h to remove naturally associated organics.
Column experiments
Chromaflex® columns (Kimble-Chase) consisting of a borosilicate glass barrel (2.5-cm inner diameter, 15-cm length) and 20-μm-porosity polyethylene bed support were used. Columns were slurry packed by suspending 55.0±0.5 g Oyster sand in deionized (MilliQ) water and allowing the sand settle to the base of the columns while tapping gently to remove air bubbles. A polyfluorotetraethylene flow adapter allowed the bed length within the column to be adjusted to the height of the packed sand. Average packed height was 6.7±0.1 cm, with an average pore volume of 12.5±0.1 mL. Calculations of pore volume based on packed bed height were verified by examining transport of Br− as a conservative tracer (I=0.01 M, pH 7).
Columns were pre-equilibrated by pumping ∼10-pore-volume background electrolyte (0.01 M NaCl, pH 7) through the packed bed. Influent solution containing PSSs, TPIAs, HPOAs, or NOM (at pH 7; note that effluent solution pH was not monitored) was directed to the column using a three-way valve that allowed air to be purged from the tubing prior to the start of flow. A constant flow rate of 2.1±0.1 mL/min was maintained using a Masterflex L/S Digital Drive peristaltic pump (Cole-Parmer). This relatively high flow rate was chosen to be broadly representative of a shallow sandy aquifer and to avoid potential microbial growth over time that could impact transport and degradation of DOM. DOM experiments were run in triplicate using newly prepared column for each run.
PSSs were detected by absorbance at 225-nm wavelength using a Cary 300 UV/visible spectrophotometer (Varian, Inc.) with a 1.0-cm quartz flow cell. DOM was detected by absorbance at 254 nm, a wavelength widely used for indirect (DOC) determination (Dobbs et al., 1972). Breakthrough of the Br− tracer was monitored by absorbance at 218 nm, following Duster (2013). Absorbances were normalized to influent solution absorbance.
Analysis using the ADE
Experimental BTCs were plotted as relative concentration (C/C0) versus T=Qt/Vp, the number of pore volumes eluted from the column (Tables 1 and 2). Equation (2) in the Supplementary Data was fit to experimental data using least-square optimization by adjusting retardation factor R and dispersivity D. Optimized parameter values are presented here as Rm and Dm, respectively. A second form of retardation factor based on the number of pore volumes at which C/C0=0.5 is denoted the “observed” retardation factor Ro.
CTRW modeling
Equations (3) and (4) in the Supplementary Data were solved and parameters were chosen to best match observed results by minimizing an objective function that compares the data to model predictions. This process was conducted with the well-validated CTRW Toolbox (Cortis and Berkowitz, 2005), which is a collection of algorithms for fitting BTC data with a range of CTRW models with different travel time distributions, including the TPL model in Equation (4) of the Supplementary Data.
Results and Discussion
BTC and ADE fits for PSS and DOM samples
The BTC and ADE fits for the nonreactive conservative tracer are shown in Fig. 1. The ADE matches the observed behavior, capturing both mean breakthrough and the complete rising limb. This suggests that potential heterogeneity associated with physical hydraulic conductivity is minimal and does not contribute to observations of anomalous transport observed for PSS or natural DOM samples.

Conservative tracer (Br−) breakthrough curve (BTC) data and one-dimensional advection-dispersion equation (1D ADE) fit.
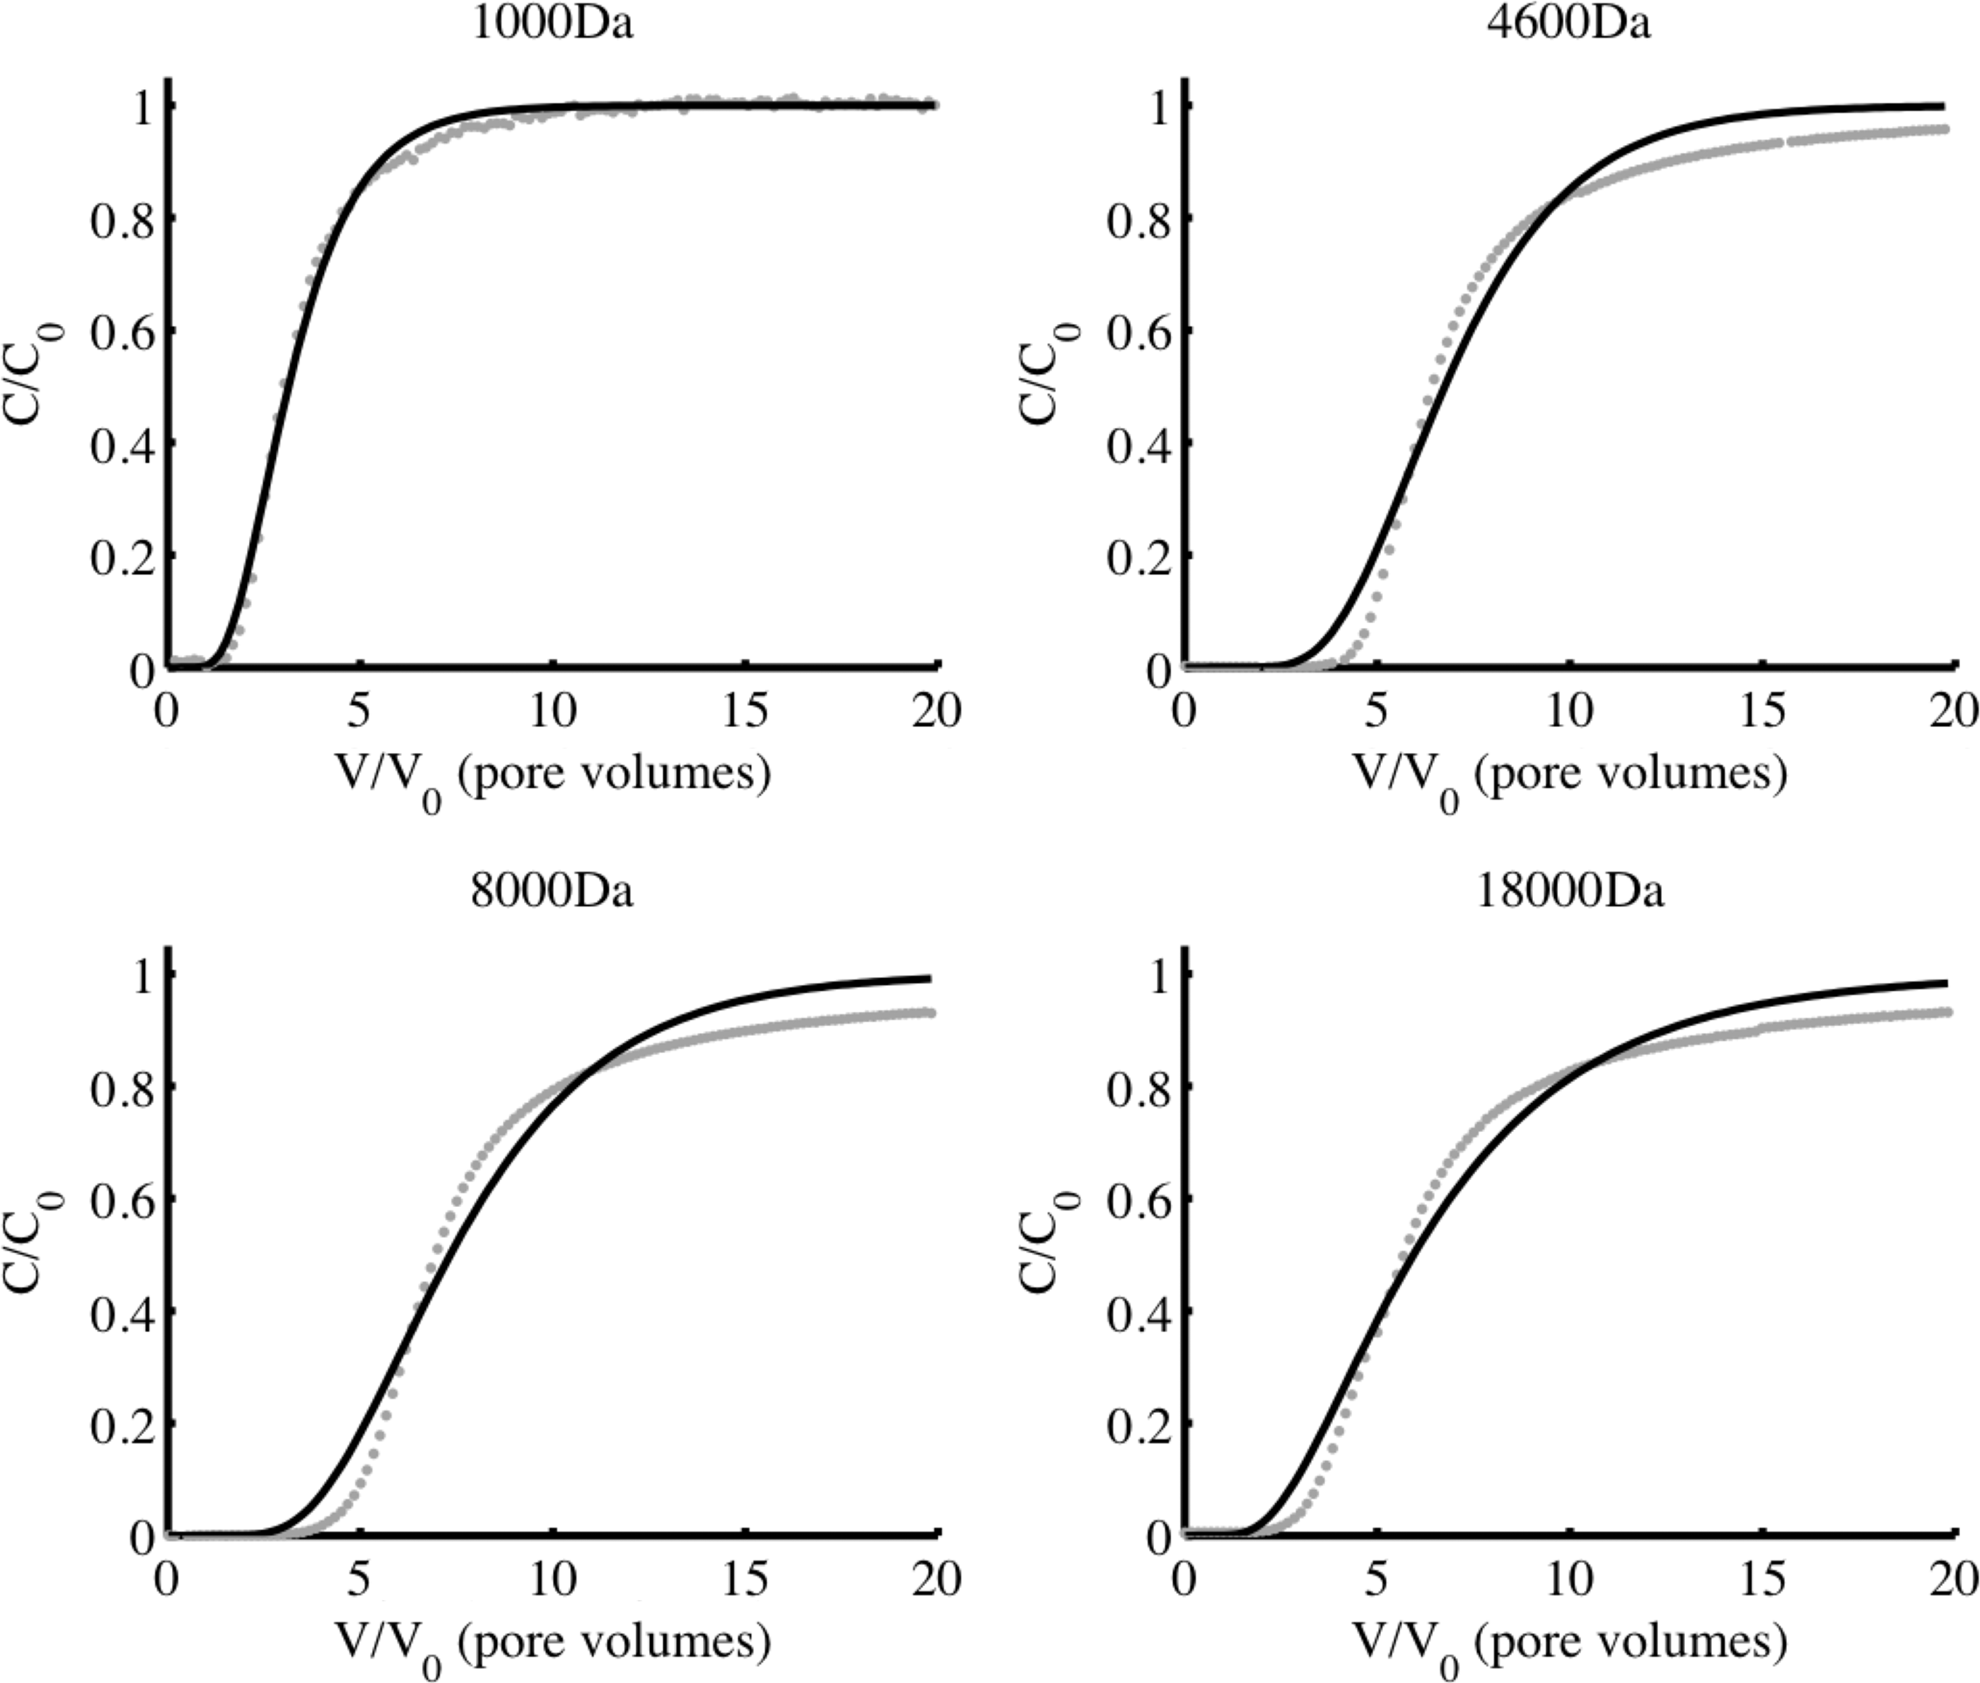
BTCs resulting from column experiments using PSS samples are shown in Fig. 2. ADE fits to these BTCs are shown in Fig. 3. Model-independent and ADE-fit parameter values are summarized in Table 3 with the coefficient of determination (r2) provided as a measure of goodness-of-fit, as well as mean absolute residual (MAR), which is a measure of the mean error between model and data. Both the median transport time Ro and the retardation factor Rm increase with MW for PSS1–PSS8, but retardation of the highest-MW standard (PSS18) is less than that of PSS8. These results agree with the observation by Seders Dietrich et al. (2013) that retention of DOM components tends to increase with MW except for the highest-MW fraction (>3,300 Da for the NOM they used). Values of Dm are similar for PSS1, PSS4, and PSS8 but considerably greater for PSS18. Despite the fact that r2 values for fits to the ADE equation are >0.98 for all four PSS samples (Table 3), the ADE fails to capture certain features, including persistent power-law tailing (Fig. 3, and see “CTRW Modeling” heading). In all cases except PSS1, the ADE tends to overpredict concentrations at early and late times but underpredict at intermediate times.

BTCs of various polystyrene sulfonate (PSS) samples in columns of Oyster sand at pH 7 in 0.01 M NaCl. Retention increases with molecular weight (MW) to 8,000 Da but decreases for the highest-MW sample (18,000 Da).
Fits (black lines) of the 1D ADE to the BTC (gray dots) for the PSS samples. Note that the ADE fails to capture persistent power-law tailing that occurs at more than ∼10 pore volumes for most of the PSS samples.
Acronyms and symbols are defined in Table 1. The ADE is described in detail in the Supplementary Data.
BTCs for the natural DOM samples are shown in Fig. 4, fits to the 1D ADE are shown in Fig. 5, and fit parameters are summarized in Table 3. All three samples show a small “hump” in the BTCs at <5 pore volumes; this hump is not captured by the ADE. The presence of an initial hump suggests that there is some highly mobile component(s) that breaks through very quickly. Zhou et al. (2001) observed in batch adsorption experiments that the lowest-MW component of DOM tended not to adsorb to goethite at any sorbate/sorbent concentration ratios, and a high-MW component tended not to adsorb at low sorbate/sorbent concentration ratios (i.e., overall high surface coverages). A nonadsorbing component would pass through the sand-packed column quickly and would be expected to break through the column at a time around one pore volume, consistent with the breakthrough of this hump. Based on Fig. 4, the total amount of DOM associated with this hump is <5% of overall material for all three samples.

BTCs for dissolved organic matter (DOM) samples (10 mg C/L) that had been processed by reverse osmosis (RO) (NOM), XAD-8 (HPOA), and XAD-4 (TPIA), at pH 7 (in 0.01 M NaCl). Each curve represents the mean of three separate experiments. An indication of experimental variability is provided by the standard deviations of Rm and Dm in Table 3.
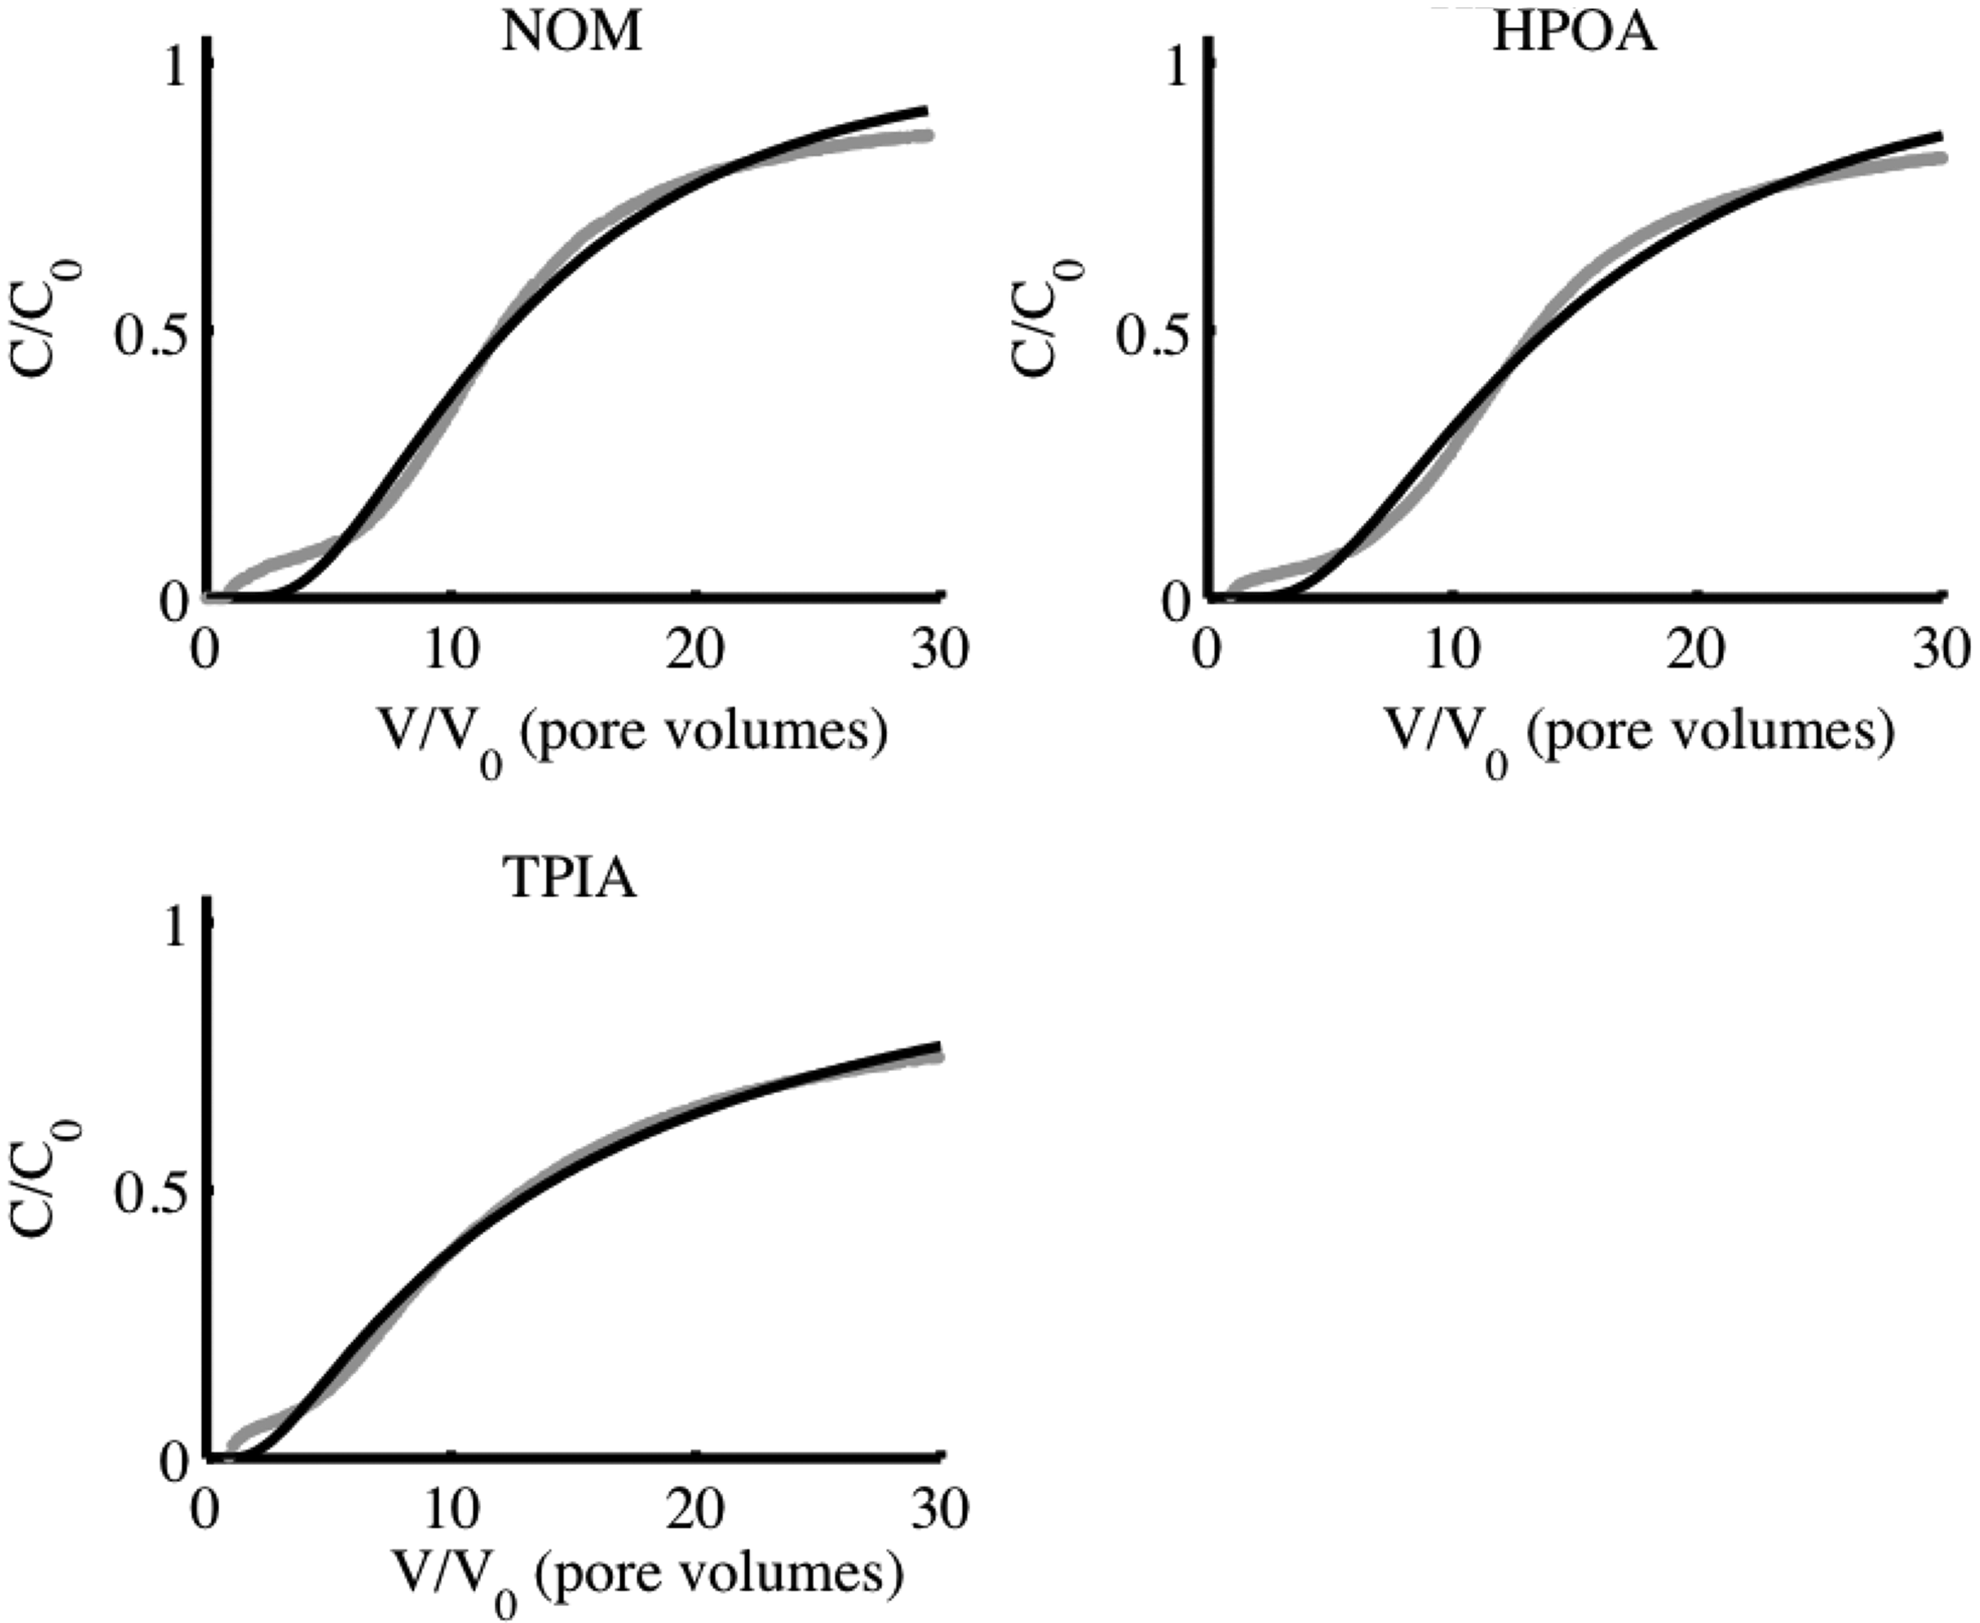
Fits (black lines) of the 1D ADE to BTCs (gray lines) of DOM samples.
In general, the ADE underpredicts the observed DOM concentration at earliest times, goes through a period of overprediction and then underprediction at intermediate times, and finally overpredicts concentrations at the latest times. The late-time overprediction would likely persist for longer times (and was observed for HPOA data). The trends in under/overprediction occur for all three DOM samples. At later times, the ADE fails to fit the observed power-law tailing.
Simple visual inspection of the BTCs shows that the TPIAs appear initially to be more mobile than the HPOA and NOM samples (NOM should be predominantly HPOAs), but that the BTCs cross over at about 10 pore volumes. Ro values for the three samples are similar. Rm increases in the order NOM<HPOAs≪TPIAs. Difference in Ro and Rm for a given sample is indicative of BTC asymmetry. Given that the Mn increases from TPIAs≪HPOAs<RO, one might expect that retention of TPIAs would be much less than for the other two samples. But, the actual BTCs show a more complex picture and demonstrate that compositional differences may override MW considerations, alone, and need to be explored in greater depth.
CTRW modeling
The CTRW model was designed to deal with complex transport behaviors that cannot be captured by the 1D ADE, including the presence of extensive power-law tailing in BTCs. Theoretical considerations in CTRW modeling and appropriate equations are described in the Supplementary Data; parameters are defined and described in Tables 1 and 2. Tailing was not observed for the nonreactive tracer and the power-law function had an exponent β>2 (Table 4), which indicates Fickian transport. This indicates that any anomalous transport behavior in the PSS and DOM samples is due to diverse adsorption behavior rather than to physical (i.e., purely hydrologic) heterogeneity of the porous medium.
Acronyms and symbols are defined in Table 1. CTRW modeling is described in detail in the Supplementary Data.
Fits to the CTRW model for PSS BTCs are shown in Fig. 6 and fit parameters are summarized in Table 4. Table 2 summarizes some of the key meanings or implications of these parameters as applied in this context. Values of the power-law function β range from 0.97 to 1.18; since all β<2, transport is strongly non-Fickian, meaning that there is power-law tailing. This is also apparent in the log-log plots shown in Supplementary Fig. S1. As noted previously, PSS samples, while often used as MW standards in HPSEC and AsFlFFF applications, are not fully monodisperse. There is no apparent trend in β value with average MW for these samples.
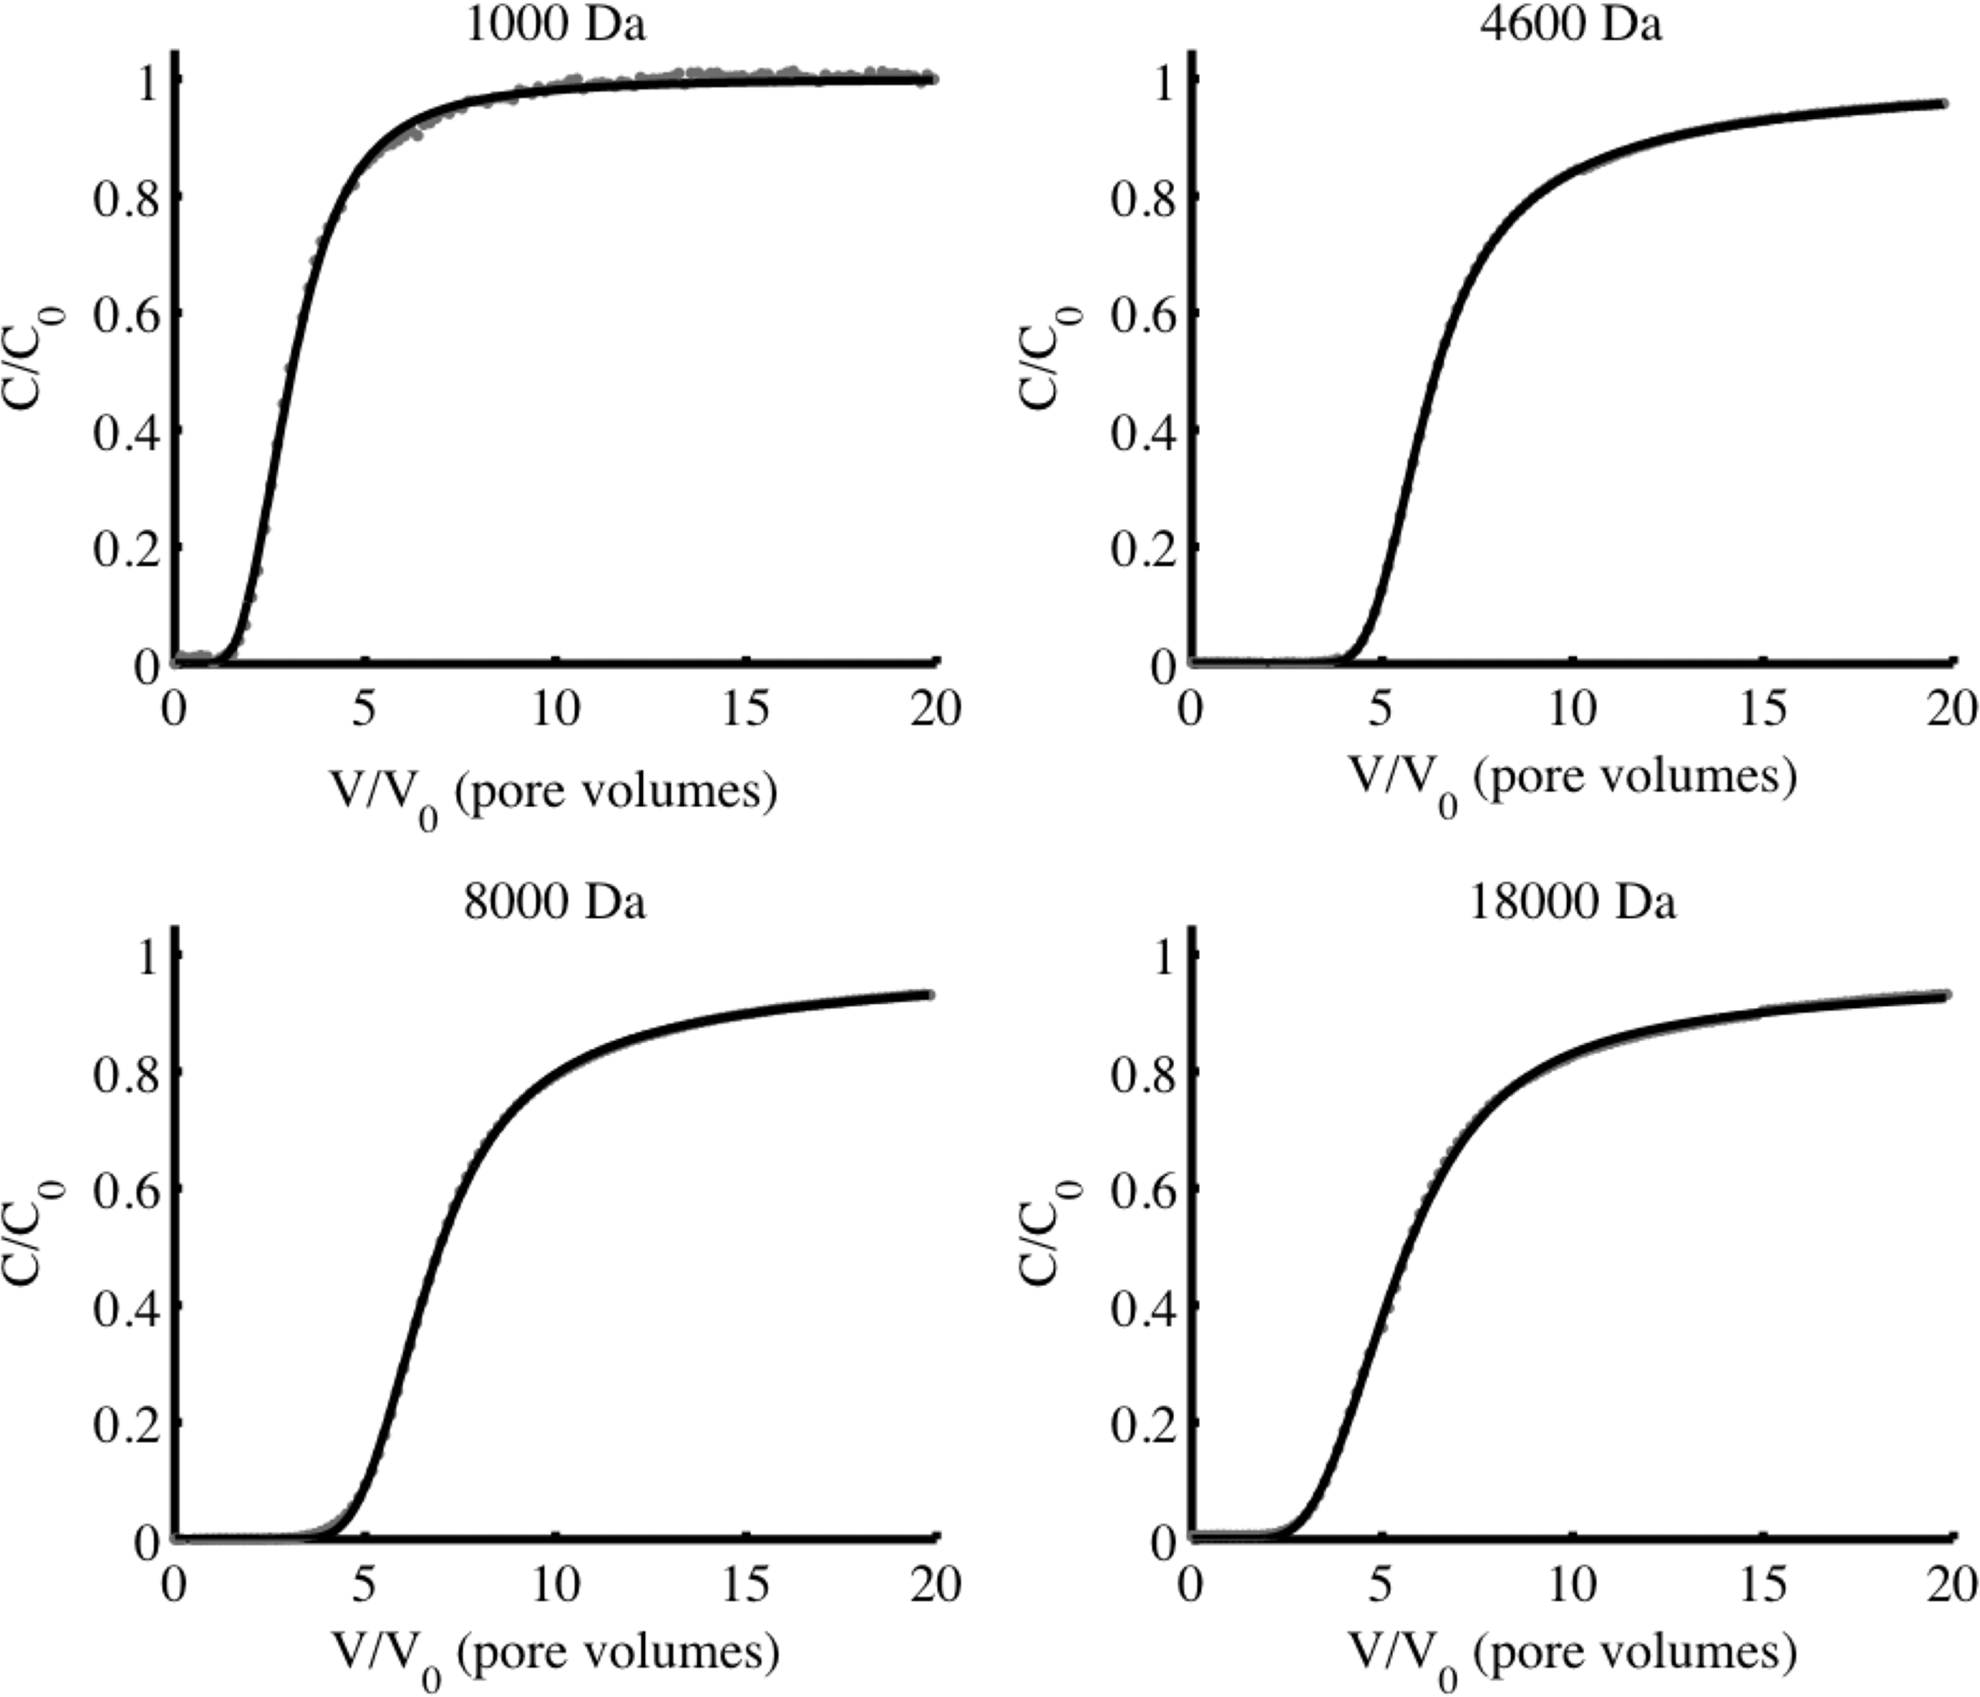
Continuous-time random walk (CTRW) model fits (black lines) for the PSS BTCs (gray dots). Note that in some cases the fit is so good that it is difficult to distinguish from the data.
There is no discernible trend in the “characteristic time” (after which tailing becomes important) t1 with MW for the PSS standards, but the model is relatively insensitive to changes in t1, particularly as all fit values are small relative to the times over which measurements were actually taken. However, the “cutoff time” t2 shows a monotonic increase with increasing MW. The parameter t2 is a measure of how long anomalous power-law tailing is expected to persist in the system, thus suggesting that the larger the MW of PSSs, the more persistent in time power tails will be.
Fits to the CTRW model for DOM BTCs are shown in Fig. 7 and fit parameters are summarized in Table 4. Values of the power-law function β range from 0.81 to 1.25, and all are β<2, indicating that transport is non-Fickian; that is, there is power-law tailing. The power-law tailing is most pronounced for the TPIA sample. The power-law tailing is even more apparent in the log-log plots shown in Supplementary Fig. S2. TPIA samples tend to have lower average MW and less polydispersity than HPOA or RO samples (Maurice et al., 2002; Kuhn et al., 2014). The value of t2 for TPIAs is much lower than for HPOAs or NOM, and the TPIA sample has lower Mn and is less polydisperse, less hydrophobic/more hydrophilic, and less aromatic than the other samples.

CTRW fits (black lines) to the DOM sample BTCs (gray lines). Note that plots of 1−C/C0 against time can be found in Supplementary Fig. S2.
Effective solute velocity V, a measure of how quickly the solute can move through the column, is similar for HPOAs and NOM, which also have comparable values of β, but substantially larger for TPIAs, which also has a much smaller power-law-exponent β. The larger value of V for TPIAs is a reflection of the faster earlier rise in the BTCs in Fig. 4. However, this faster effective velocity is competing with the stronger power-law tail that retains solute for longer periods of time. Hence, a crossover occurs in the BTCs for TPIAs versus HPOAs and NOM at about 10 pore volumes so that, late in the curves, TPIA is retarded to a greater extent than the other samples. The larger value of D for the TPIA curve also indicates that there is greater dispersion about V.
In terms of model fit, in all cases, the CTRW outperforms the ADE with improved r2 values, although the values obtained by the ADE fits are already quite high (r2>0.98). However, given the apparent visual mismatch between data and model for the ADE, this may call into question the utility of r2 as a metric in these cases; indeed, r2 only quantifies the fraction of the variance about the mean of the data that the model is able to capture. The alternative metric MAR quantifies the mean error between model and data and can demonstrate the relative change in reduction of error by applying different models to the same data set. For all PSS cases, the CTRW model provides about an order of magnitude improvement in this mean error. For the DOM, the improvement appears less substantial. However, if we exclude data from the first five pore volumes, corresponding to the initial hump in BTCs, MAR for the CTRW model provides an order of magnitude reduction relative to the ADE fits. In general, the maximum error between model and data was reduced by a factor of 5 with the CTRW relative to the ADE for DOM (typically about 0.05 for the ADE and 0.01 for the CTRW, again excluding the initial hump in the BTCs) and a factor of 10 for the PSS standards (on the order of ∼ 0.1 for the ADE and 0.01 for the CTRW).
Comparison of mobilities of DOM samples
Although model-independent median arrival time (Ro) and retardation factor (Rm) as determined from fit to the 1D ADE are often used to compare the mobilities of different solutes, neither of these parameters gives a comprehensive picture of relative transport for these complex and polydisperse solutes. Ro values for the three DOM samples are similar, indicating similar median transport. But Rm increases in the order NOM<HPOAs≪TPIAs. Intersample comparisons of either Ro or Rm obscure nuances that could be important for contaminant transport, especially if a given contaminant associated preferentially with certain components of a complex DOM mixture. While the Rm values might be taken to suggest that TPIAs are least mobile, comparison of Ro/Rm, where deviations from 1 indicate BTC asymmetry, indicates that the TPIA BTC is the most asymmetrical. The dispersivity, as either D or Dm, of TPIAs is also considerably greater than for the other two DOM samples, and the substantially lower value of the power-law function β indicates greater tailing. Based on comparison of ADE and CTRW parameters (Tables 3 and 4), HPOAs and NOM tend to show similar transport whereas TPIA transport is substantially different—with more asymmetrical breakthrough, greater dispersivity, and greater tailing.
Summary and Conclusions
MW has been proposed as a key parameter that helps to control the reactivity—including adsorption and transport—of DOM, particularly aquatic HSs (Cabaniss et al., 2000). Column experiments showed that retention of PSS samples increased with MW from 1,000 to 8,000 Da but decreased for the highest-MW sample (18,000 Da), which is consistent with trends observed by Seders Dietrich et al. (2013) for an aquatic NOM (RO) sample. Based on observations of polyacrylic acid adsorption to BaTiO3, de Laat et al. (1995) suggested that once a surface becomes coated in an organic polyelectrolyte, adsorption of very-high-MW (hence high total charge) components might be inhibited by electrostatic repulsion. Considering the general trend of increased retention with increasing MW, one might expect that the lower-average-MW TPIA sample would show considerably less adsorption, hence less retention than either the NOM or HPOAs. However, while HPOAs and NOM show broadly similar transport, and all three samples have similar values of median arrival time Ro, values of retardation factor Rm as determined by the 1D ADE actually increase in the order NOM<HPOAs << TPIAs. The BTC for TPIAs shows considerably greater asymmetry, dispersivity, and tailing than those of the other two samples. Hence, compositional and/or structural differences between the more “transphilic” TPIAs and the more hydrophobic HPOAs and HPOA-rich NOM samples appear to override MW considerations, alone.
BTCs for all three DOM samples showed an initial hump indicative of nonadsorbing, highly mobile component(s). Considering that any contaminant that might associate with such highly mobile material might itself be highly mobile, further research is needed to better understand the composition and reactivity of the material.
DOM BTCs showed persistent power-law tailing indicative of heterogeneous solute-sorbent interactions, perhaps including kinetic effects on adsorption. Since power-law tailing can create challenges in developing risk assessments at contaminated sites (de Barros and Rubin, 2008; Bolster et al., 2009) or for design of effective remediation strategies (de Barros et al., 2013), it is important to characterize tailing carefully. In agreement with many previous laboratory and field observations, the 1D ADE provided a poor fit to the nuanced features of DOM BTCs, particularly the extended power-law tailing. The CTRW provided a considerably better fit to BTCs and better captured DOM tailing phenomena.
Given that HPOAs and TPIAs show different BTC asymmetries, dispersivities, and retardation factors (Rms) but similar median arrival time (Ros), contaminants bound to the two different types of DOM could themselves show similar or different transport behaviors. It is also possible that the presence of a contaminant could affect DOM transport (e.g., Seders Dietrich et al., 2013). Although the SR samples used here were collected at the same time, they contain different concentrations of metals and sulfate (Kuhn et al., 2014), which could also affect adsorption and transport. NOM (i.e., RO concentrate) transport tends to be similar to that of the dominant HPOA fraction, but these two DOM samples do not show identical transport behavior, which indicates that other components, including TPIAs, can be important. Overall, results of these column transport experiments re-emphasize that DOM is complex and heterogeneous not just in composition and structure but also in function, in this case, transport. No single parameter, such as Rm or Ro, can adequately describe DOM transport. Given that experimentalists often rely on the use of freeze-dried DOM, particularly NOM and HPOA samples from the SR, studies such as this that compare properties and transport of different DOM samples using a variety of approaches are important.
Footnotes
Acknowledgments
The authors thank the IHSS for funding the sampling trip to collect DOM from the SR, E.M. Perdue (Ball State University) for organizing and running the sampling trip, and George Aiken (USGS), Keshia Kuhn (UND), and Kenna Butler (USGS) for the XAD-8/XAD-4 isolation. D.M. was funded by a National Science Foundation graduate student fellowship and a Bayer Predoctoral Fellowship (UND). We gratefully acknowledge funding from the United States National Science Foundation under grants EAR-1113704 and EAR-1351625 (to D.B.). We thank R. Cook and E.M. Perdue for providing advance NMR and VPO data, respectively, and two anonymous reviewers whose suggestions greatly improved this article.
Author Disclosure Statement
No competing financial interests exist.
References
Supplementary Material
Please find the following supplemental material available below.
For Open Access articles published under a Creative Commons License, all supplemental material carries the same license as the article it is associated with.
For non-Open Access articles published, all supplemental material carries a non-exclusive license, and permission requests for re-use of supplemental material or any part of supplemental material shall be sent directly to the copyright owner as specified in the copyright notice associated with the article.