
Abstract
Abstract
Suwannee River natural organic matter (SRNOM) is a well-known end member of NOM from an aquatic system, and is a reference material of the International Humic Substances Society (IHSS). In May 2012, an expedition to the Suwannee River to replenish this reference material yielded over 6 kg of freeze-dried NOM. The quantity of isolated NOM was unprecedented, easily exceeding the combined recoveries of the standard and reference samples that were collected by the IHSS from the Suwannee River in 1983, 1999, and 2003. The NOM was acquired from 36,890 L of filtered river water, which was concentrated 40-fold on-site using two portable reverse osmosis (RO) systems. After RO, the concentrated sample was desalted by cation exchange (CEX), freeze dried, and homogenized. Overall yield of dissolved organic carbon (DOC) was 84.2%, which is slightly lower than the yield of 88% in 1999 when RO and CEX were used to isolate the first sample of SRNOM, which is designated 1R101N. The final NOM sample supplied to the IHSS, which is designated 2R101N, contains only 3.89% inorganic ash, which reasonably allows most chemical analyses. Average river DOC concentration of 82.7 mg/L was higher than during prior sampling trips, which contributed to the historically high recovery of NOM. Increased DOC concentration may be related to the removal of water control structures from the river. This article describes the methods of isolation used in collecting the 2R101N reference sample as background for other articles in this special issue of Environmental Engineering Science and for future researchers who will use this IHSS sample.
Introduction
T
The Suwannee River, a black-water river that drains the Okefenokee Swamp in southeastern Georgia, United States, contains a high concentration of natural organic matter (NOM), a low concentration of inorganic salts, and a minimal input of anthropogenic contaminants within the drainage area (i.e., Okefenokee Swamp), which is ideal for collecting aquatic humic materials. Samples from the Suwannee River are chemical end members and quintessential samples of terrestrial-derived organic matter coming from terrestrial plants, as nearly all other aquatic systems have a greater fraction of microbial-derived organic matter (Cawley et al., 2013).
Six standard and reference FA and HA were extracted from the Suwannee River in 1983 and 2003 using XAD-8 resin (Malcolm et al., 1989). The IHSS has assigned identification codes of 1S101F, 1R101F, 1S101H, 1R101H, 2S101F, and 2S101H to these samples (E.M. Perdue, personal communication). These codes uniquely identify a sample by batch [#], status [Standard or Reference], location [3-digit #], and type [Fulvic acid, Humic acid, Natural organic matter or Bulk]. Another reference sample collected at the same location in 1999, using reverse osmosis (RO) and cation exchange (CEX), is designated 1R101N and is often referred to as Suwannee River natural organic matter (SRNOM). That same methodology was used in the most recent expedition in May 2012 to replenish the supply of SRNOM. The IHSS code of the new reference sample of SRNOM is 2R101N, and this sample is the focus of this article. For this article, NOM will refer to the isolated sample and natural organic matter will refer to the organic matter that is actually present in the river. NOM and natural organic matter may differ compositionally.
This article provides a background on the history of the IHSS sampling at the Suwannee River and describes the methods used to concentrate, desalt, freeze dry, and homogenize the new sample of SRNOM (2R101N). The stepwise and overall percent yields of dissolved organic carbon (DOC) and the mass of the final freeze-dried sample are also provided. It is evident that many researchers from around the world use the IHSS Suwannee River samples for a wide array of experiments involving aquatic NOM, given that a query of the topics (Suwannee River) AND (natural organic matter) on Web of Science (http://isiknowledge.com/wos; Accessed August 20, 2014) finds 365 articles with 11,324 citations, and it is essential that information on the isolation of this reference sample be readily available and widely disseminated. Moreover, this information serves as essential background for other articles in this special issue of Environmental Engineering Science.
Experimental Protocol
Field location
The IHSS reference sample was collected from the headwaters of the Suwannee River (30°48′14′′N, 82°25′03′′W) as it flows out of the Okefenokee Swamp (Fig. 1). Specifically, the sample was collected at the southernmost dam on the Suwannee River sill, where the previous IHSS samples from the Suwannee River were collected. Malcolm et al. (1989) reported that this sampling site was selected as a source of a standard aquatic HA and FA for several reasons, including the fact that the headwaters of the Suwannee River occur in the remote, sparsely populated Okefenokee Swamp of southeastern Georgia–an area that was expected to be generally free of anthropogenic inputs (e.g., wastewater, farming runoff, industrial waste) because of the protected wildlife refuge.
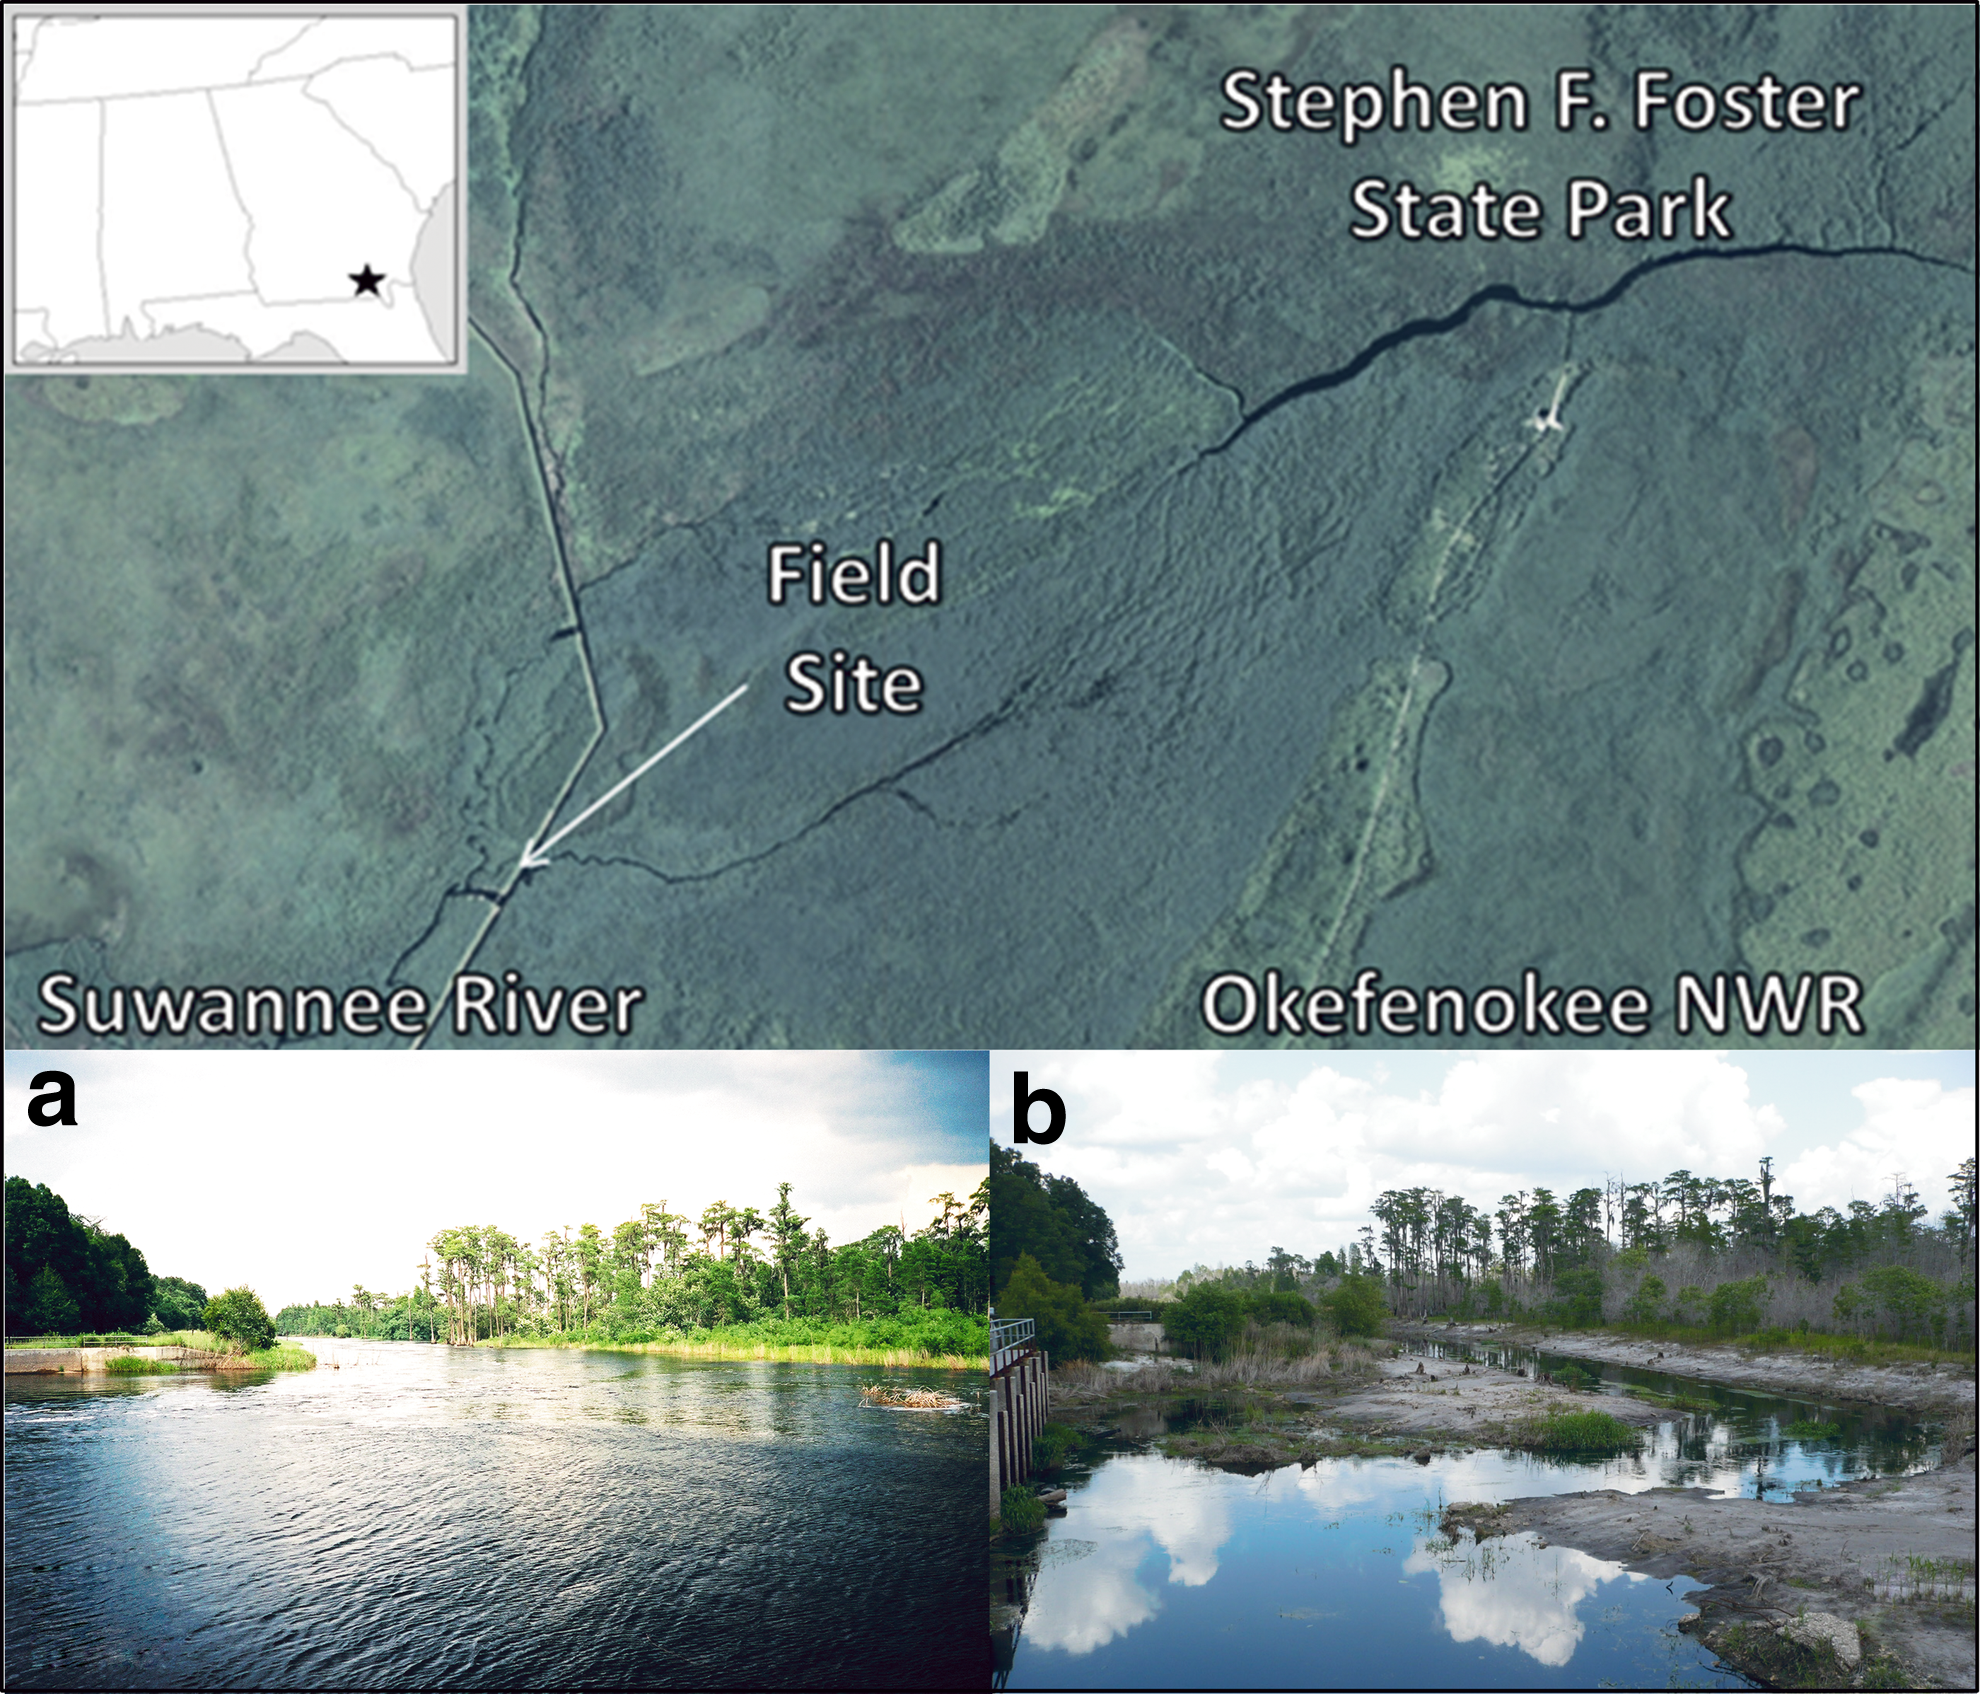
*The field location in southeastern Georgia at the Suwannee River sill (top) (30°48′14′′N, 82°25′03′′W). The water level in the river is shown
Following extensive fires in the Okefenokee Swamp in the mid-1950s, the Suwannee River sill was constructed in 1960–1962 to maintain a relatively high water level in the Okefenokee Swamp. The water level was controlled by two concrete dam structures in the sill. At the time of 1983 and 1999 sampling, the water level in the Okefenokee Swamp immediately upstream from the IHSS sampling site was regulated by these two dams in the Suwannee River sill. Vehicle access to the sill and the dams was restricted, requiring a permit from the Okefenokee National Wildlife Refuge (ONWR). In the early 2000s, the ONWR began to implement a long-term plan to restore the natural variability of water levels in adjacent areas of the Okefenokee Swamp. The plan called for removal of the two dams on the Suwannee River sill and for breaching the sill in several other locations. By the time the IHSS sample was collected in 2003, the ONWR plan was partially implemented by removal of water-retaining structures at the southernmost dam on the sill. Vehicle access to the sill was still restricted and the site could still be considered as relatively pristine. By the time of the IHSS sampling trip in 2012, the southernmost dam structure had been further degraded and the sill had been breached a short distance north of the dam. Vehicle access was completely open to the public, the sill road had been paved all the way to the dam, and parking areas and toilets had been installed for public use. The river channel was not changed, and vehicle access upstream of the site was restricted by a gate. Public access into the swamp through the state park was not noticeably different from the past sampling trips. It is no longer possible to consider the site to be a pristine sampling location, and it is unclear how this sampling site will change in the future.
During the past IHSS sampling expeditions, water levels at this site were sufficiently high that samples could be collected anywhere along the dam. But because the water level of the river was much lower in 2012 (Fig. 1), the sample was collected in the main channel on the downstream side of the dam. Samples were collected during the daylight hours on May 3–15, 2012. The downstream U.S. Geological Survey (USGS) water station available through the national water information system (NWIS) measured an average flowrate of 0.46 m3/s and gage height of 0.33 m at Fargo, GA (Station ID 02314500) during sampling. This was well below the median flowrate of 15.15 m3/s and gage height of 0.86 m. The low water level was likely due to an ongoing regional drought, which the US Drought Monitor (http://droughtmonitor.unl.edu/; Accessed May 28, 2014) classified as extreme (D3). The average flowrates during previous sampling expeditions were 34.54 m3/s in 2003 (05/18-06/14), 1.96 m3/s in 1999 (05/01–05/09), and 9.72 m3/s in 1983 (∼12/01/1982–01/31/1983). In 1983 and 1999, the dam retained water in the swamp and controlled the release of water downstream.
Concentration of the Suwannee River water by RO
The Suwannee River water was concentrated using two portable RO systems (PROS/2S; Realsoft), each capable of concentrating a sample at a maximum rate of 4 L/min (Fig. 2). For simplicity, the following description of the field work will refer to one RO system, with the understanding that the process occurred in duplicate (two RO systems, two sampling reservoirs, two generators, etc.). The unpublished procedure used by E.M. Perdue to collect the first IHSS reference sample of NOM in 1999 was followed closely. That procedure, in turn, was based on the procedure used by Serkiz and Perdue (1990) and Sun et al. (1995). The main difference was the need to assemble and disassemble the entire field worksite daily, because the sampling permit from the ONWR only allowed sampling during daylight hours.

Schematics of reverse osmosis (RO) concentration and cation exchange (CEX). The raw river water was put through successive 1 and 0.45 μm filters into the sample reservoir. The sample was pumped into the RO system where relatively pure permeate water was discarded and the concentrated sample (retentate) recirculated back to the sample reservoir. After a 40-fold concentration, the RO concentrate was passed through a H+-form CEX resin column yielding a desalted NOM sample. Periodically, the exhausted resin was regenerated with acid, which displaced sorbed cations to waste.
Each morning, the field worksite was set up by deploying a submersible pump (KP 250; Grundfos) in the river, filtration equipment (tandem 1 μm [Hytrex GX01; GE] and 0.45 μm [Flotrex FPN941CGE; GE] cartridge filters), flow totalizer (A1; GPI), sample reservoir (60 L high-density polyethylene [HDPE]; Nalgene, Thermo Fisher), portable RO system (PROS/2S; Realsoft), power cables, water hoses, and a gasoline-powered generator (Handi EU3000i; Honda).
To begin the field processing, a minimum of 20 L of raw river water was pumped from the river using the submersible pump, which was placed south of the center of channel in the deepest part of a flow channel. This water passed directly through the filtration system to rinse new filters and was discarded. Then, filtered water was transferred directly through the flow totalizer, which determined the total volume of processed feed water to an accuracy of ±2%, and into the sample reservoir until the sample reservoir contained 40 L of filtered river water.
In 1999, a cartridge filled with coarse (20–50 mesh) CEX resin (Dowex 50Wx8, H+ form; Dow Chemical Co.) was inserted between the sample reservoir and the RO system to remove polyvalent cations and thus prevent fouling of the RO membranes by precipitates such as CaCO3(s), CaSO4(s), or Fe(OH)3(s). In this expedition, however, it was decided to proceed without CEX, based on previous experience at the Suwannee River that the relatively low concentration of inorganic solutes and the very low pH (∼3.3) would prevent the formation of inorganic precipitates within the RO system. No pH adjustments were made during processing.
Once 40 L of filtered water was in the sample reservoir, the submersible pump in the sample reservoir (Fig. 2) was activated to begin circulating water through the RO system. This system includes two RO membranes (TW30-4021; Filmtec, Dow) that are operated in parallel to separate relatively pure water (the permeate solution) from the concentrated sample (the retentate solution), and are capable of rejecting 99.5% of all salts. When it was evident visually that air had been largely displaced from the RO system, the high-pressure pump on the RO system (PA1011; Berns Corp.) was activated, and pressure was adjusted to 200 psig. At this pressure, ∼20% of the feed flow is transferred across the RO membranes and discarded permeate solution with a permeate flux of ∼0.001 cm/s. The retentate solution was returned to the sample reservoir (Fig. 2). Additional filtered, metered river water (the feed solution) was added as needed to maintain a volume of ∼40 L in the sample reservoir, with the rate of addition of feed solution roughly matching the rate of removal of permeate solution. Samples were processed in batches of ∼1,000 L and were concentrated 40-fold by RO and stored in prerinsed (see General Operations section) 25 L HDPE carboys (Nalgene, Thermo Fisher).
At the end of each day, ∼1 h before sunset, all processing was stopped, samples were drained from the sample reservoir, RO system, etc., and all deployed equipment was removed from the sampling site. The RO concentrate was stored out of direct sunlight in an air-conditioned (∼20°C) environment until the end of sampling. Forty-two 25 L carboys of RO concentrate were transported under ice and stored in a dark, walk-in cold room (4°C) at Ball State University while awaiting further processing.
Desalting of RO concentrate sample
On average, the samples were concentrated 40-fold by RO with both organic and inorganic solutes being concentrated together. The only added inorganic solute in the RO concentrate was NaOH used in cleaning the RO membranes (see General Operations section). If not removed, the inorganic solutes would remain as ash in the freeze-dried NOM sample. The ash content of a desalted NOM sample should be less than 5% (Huffman and Stuber, 1985). The equivalent Na/C molar ratio is 0.022, when considering NaCl as the only source of ash.
As was done previously for the first IHSS NOM sample (1R101N), the ash content of this sample was reduced by CEX, which replaces the cations from the RO concentrate with H+. Anions that form volatile acids (e.g., Cl−) were removed when the desalted sample was freeze dried. Anions that form nonvolatile acids (e.g., SO42−) and nonvolatile weak inorganic acids such as Si(OH)4 were not removed during the freeze-drying process, but were instead converted to H2SO4 and SiO2(s).
The CEX apparatus consisted of two large glass columns (10×120 cm, aqueous type, Spectrum Chromatography) connected to peristaltic pumps with 1/4′′ (6.35 mm) Teflon tubing and short lengths of peristaltic pump tubing (Masterflex) (Fig. 2). Each column was packed with ∼7 L of CEX resin (Dowex 50Wx8, H+ form; Dow). The CEX resin was prepared initially by rinsing with 18.2 MΩ-cm ultrapure water (Nanopure, Thermo Fisher), followed by 1 M NaCl (ACS grade; Fisher), ultrapure water, and ∼1 M HCl (ACS grade; Fisher), all of which were pumped at 500 mL/min into the bottom of each column. While rinsing with HCl, the pH was monitored in the effluent and the rinse was stopped when it approached the pH of the incoming solution. The column was flushed with ultrapure water until Cl− was no longer detected as a precipitate in 0.1 M AgNO3.
RO concentrate was pumped upward through the resin bed at 100 mL/min and collected. When the effluent pH began to increase, indicating that the CEX capacity of the resin was exhausted, the process was stopped. To regenerate the resins, ultrapure water was first used to pump out the remaining sample in the columns. Then the resins were rinsed with HCl and ultrapure water following the methods used in the initial preparation. After all the RO concentrate was pumped through the columns, the Na+ concentration of a composite sample was measured by atomic absorption spectroscopy (AAnalyst 100; Perkin Elmer). To further lower the Na/C molar ratio toward the goal of 0.022, the RO concentrate was desalted a second time. After all the sample was desalted, the columns were rinsed with 0.01M NaOH to recover any adsorbed or precipitated organic matter. After an additional CEX step to remove the added Na+, the recovered NOM was mixed into the main sample. A small aliquot was reserved before and after cation exchange for comparison of major elements and trace metals (Kuhn et al., 2014, this issue).
Freeze drying of the desalted RO concentrate sample
Forty-five 25 L carboys of desalted, concentrated NOM were taken to Van Drunen Farms in Momence, IL for freeze drying in October 2012. Fifty-six steel trays (109×76×3.2 cm), lined with low-density polyethylene (LDPE) sheets, were filled up to ¾ full and frozen for 2½ days. The trays were moved into the freeze dryer, and the sublimation of water was driven by gradual variation of the temperature of the heating elements of the freeze dryer from 120°C to 32°C. The sublimation of water was sufficient to keep the sample frozen while it was being processed. The complete freeze-drying process lasted ∼72 h, including a break to check dryness after 48 h, and an unplanned power outage of 3–4 h, which occurred 12 h into the process. During the unplanned power outage, the vacuum chamber was repressurized rapidly (15 min) so the sample could be returned quickly to a freezer. At the end of the freeze-drying process, the freeze-dried NOM sample was transferred from the trays into LDPE bags, and the LDPE tray liners were collected in separate bags. The freeze-dried sample and liners were returned to the Ball State University.
Preparation of NOM sample
The freeze-dried sample was initially a mixture of coarse dry flakes. The sample was made into a consistent fine powder by sieving through a 100-mesh (152 μm) stainless steel sieve (ASTM E-11). This also removed any coarse debris, such as CEX resin beads or polyethylene pieces, from the sample.
The liners from freeze drying were rinsed with 0.01 M NaOH to redissolve any sorbed NOM. The rinse solution was desalted by CEX and freeze dried in the lab (Freezone 6; Labconco), before being blended into the main sample. Thereafter, the SRNOM sample (2R101N) was transferred to Prof. Paul Bloom, who currently (since 1999) maintains and distributes the IHSS standard and reference samples at the University of Minnesota in St. Paul, MN.
General operations
Materials that contacted the sample during processing were polyamide in RO membranes, sulfonated polystyrene in CEX resins, polypropylene in submicron filters, HDPE for storage containers, Teflon, borosilicate glass, stainless steel, styrene acrylonitrile, ethylene vinyl acetate, vinyl, LDPE, and rubber (nitrile and EPDM) for gaskets.
Before sampling, the RO systems and other sample handling equipment (i.e., carboys, tubing) were cleaned using successive rinses of 0.01 M NaOH (ACS grade; Fisher) and 0.01 M HCl (ACS grade; Fisher). As noted earlier, new filters were rinsed with 20 L of river water before being used to filter a sample for processing.
The yield of DOC during the field processing by RO is the ratio of mass of recovered DOC to the mass of processed DOC, expressed as a percentage. Four parameters must be known to calculate the yield: the total volume and average DOC concentration ([DOC]) of processed water and the total volume and average [DOC] of the RO concentrate. The total volume of processed water was measured to an accuracy of±2% by the flow totalizer. The total volume of RO concentrate was obtained from the number of filled carboys of RO concentrate and the average volume of sample per carboy.
A volume-weighted average sample of filtered river water was collected. At each 100 L interval, a 15 mL aliquot of filtered river water was collected into a 2-L HDPE bottle. At the end of each day, this sample was transferred to a 4-L HDPE bottle and stored in a refrigerator. The volume-averaged composite sample for the entire sampling trip was used to determine the average [DOC] in the filtered feed water for the entire processed sample.
A volume-weighted average sample of the concentrated SRNOM was created in the laboratory for analyses. The mass of each of the 42 carboys was adjusted to 24.5±0.1 kg by transfer of concentrated sample between carboys. Each carboy then contained ∼22.75 kg of concentrated solution. A 40 mL aliquot was taken from each carboy, and the aliquots were combined to produce the volume-weighted average sample of the concentrated SRNOM, which was used to determine the average [DOC] in the concentrated NOM.
During field sampling, the deposition of organic matter fouled the RO membrane surface, which gradually decreased the flowrate of permeate solution. The RO membranes were, therefore, rinsed periodically with 0.01 M NaOH (ACS grade; Fisher) to restore permeate flow rates. The organic matter that desorbed during rinsing with 0.01 M NaOH was either left in the sample reservoir and processed immediately along with additional feed water or collected in a carboy and later added back gradually to the concentrated sample in the sample reservoir.
An Orion 720A pH meter with a ROSS combination electrode was used for pH measurements in the field, and a Sievers 900 total organic carbon (TOC) analyzer (GE) was used to measure [DOC] in the field. In the laboratory at the Ball State University, pH and [DOC] of the volume-averaged composite samples of river water and concentrated NOM were determined using the same instruments as above. In addition, the two composite samples were analyzed for nonpurgeable organic carbon (NPOC) and total dissolved nitrogen (TDN) (Shimadzu TOC-LCSH & TNM-L), conductivity (Oakton). Concentrations of Na+ were determined by the atomic absorption spectroscopy (AAnalyst 100; Perkin Elmer) and/or ion chromatography (ICS-5000 w/CS15; Dionex, Thermo Fisher). These analyses and methods were used to monitor the removal of Na+ and retention of DOC as samples were processed further in the laboratory. Elemental composition, moisture, and ash content were determined for the freeze-dried samples at Huffman Laboratories in Golden, CO.
Yields of DOC were calculated for each processing step (i.e., RO, CEX, freeze drying) by dividing the final DOC mass by the initial DOC mass for each step. The mass is calculated either as the sample volume multiplied by the [DOC], or the NOM mass (Extend, Sartorius) multiplied by percent carbon (%C) in the NOM, as determined by measuring [DOC].
Results and Discussion
Composition of raw water
Average [DOC], pH, and conductivity of surface water in the Suwannee River for all the IHSS sampling expeditions are shown in Table 1 (Malcolm et al., 1989; E. M. Perdue, unpublished data). [DOC] and conductivity were substantially greater in 2003 and 2012 than in 1983 and 1999. Because higher [DOC] and conductivities were observed when water levels were very high (2003) and when water levels were very low (2012), it is unlikely that [DOC] and conductivity are simple functions of dilution by meteoric waters. These changes coincide with the degradation of the water-retaining dam structures and breaching of the Suwannee River sill, which allowed much greater natural fluctuation in the water level in the Okefenokee Swamp. Kalbitz et al. (2000) review controls on the dissolved organic matter in soils with one of several conclusions being that the rewetting of dry soils increases the dissolved organic matter concentration. The [DOC] data from four sampling trips in 30 years are too sparse to discern trends and was supplemented by NWIS data for TOC at Fargo, GA (Station ID 02314500). For the time period of 1982 to 2003 the average TOC concentration was 46.8 mg/L (n=235) and from 2003 to 2014 it was 59.4 mg/L (n=114), which agrees with the higher [DOC] seen in the samples after 2003. It is plausible that these physical changes could be the cause of the increased [DOC], as the changes may have modified the redox chemistry and microbiology in local soils to favor increased oxidation of organic matter.
Reference samples, 1R101F and 1R101H, were also collected and are included in the final DOC yield and mass.
DOC, dissolved organic carbon.
Yield of DOC
Another trend in Table 1 is the increasing quantities of FA, HA, and RO isolate (NOM) that have been isolated in successive sampling trips. The quantity of FA and HA isolated was 40% greater in the 2003 sampling trip than in 1983. In 2012, the quantity of isolated NOM is a factor of two greater than the total quantity of isolated samples from the three earlier sampling trips combined. This trend toward collecting an ever-increasing quantity of sample is driven by the continuous growth in demand for the Suwannee River samples of all types.
Table 1 also includes the field yields for the sampling trips in 1999, 2003, and 2012, as well as the overall yields of DOC for all the four IHSS sampling trips. The field yields in 1999 and 2012, when NOM was isolated using RO, are comparable (92.9% and 94.2%, respectively) and much greater than the field yield in 2003 when FA and HA were isolated using XAD-8 resin. The overall yields are limited and hence reflect all losses of DOC during isolation, purification, lyophilization, and homogenization of the sample. For the two samples of NOM that were isolated using RO, the overall 84.2% yield of DOC in 2012 compares well with the 88% yield obtained in 1999. The overall yields by XAD-8, including FA and HA, were 75% and 51% in 1983 and 2003, respectively, both of which were lower than the yields obtained by RO. This reflects the fact that XAD-8 specifically isolates the humic and FAs whereas RO concentrates a much broader range of the aquatic organic matter. As described in Kuhn et al. (2014, this issue), the raw filtered surface water from the Suwannee River collected during the May 2012 sampling contained 60% hydrophobic organic acids (i.e., the combined HA/FA fraction).
The total mass of isolated NOM in this study was 6,124 g. The individual yields of each processing step (i.e., RO, CEX, and freeze drying /homogenization) were calculated based on the mass of DOC at the beginning and end of each process. The yields of DOC were 94.2% for RO, 96.2% for CEX, and 92.9% for freeze drying/homogenization processes. The overall yield of DOC (84.2%) is the product of the individual yields. The largest loss of DOC occurred during the freeze drying/homogenization process. In addition to completely unavoidable losses of DOC in the form of volatile organic compounds during the freeze-drying process, finely powdered NOM could easily have escaped while harvesting the freeze-dried product from the LDPE liners and during subsequent sieving and homogenization.
Other sample analyses
Sodium was concentrated with NOM during the RO process. The initial concentration of Na+ was 9.9 mM. The RO concentrate was passed twice through CEX columns. After the first pass, the concentration of Na+ was 7.2 mM and after the second pass it was 2.2 mM, which was a 78% removal of Na+. The molar Na/C ratio was 0.018 after desalting, which is lower than the value (0.022) needed for less than 5% ash as NaCl. The ash analysis of the final sample (2R101N) determined that the weight percent of ash was 3.89%, which is approximately half the ash content of the previously collected IHSS sample of NOM from the Suwannee River (1R101N, 7.0% ash, www.humicsubstances.org/elements.html). The ash likely contains SO42− and SiO2(s), which were not removed by CEX or freeze-drying. In the future, the coupled RO/electrodialysis process may enable more complete removal of Si(OH)4 and SO42− (Koprivjnak et al., 2006).
The molar nitrogen-to-carbon ratios (N/C), as TDN/NPOC, before and after desalting were 0.028±0.001 (n=3) and 0.022±0.001 (n=3), respectively. The samples were not analyzed for NH4+; however, the decrease in N/C may be from the removal of NH4+ or nitrogen-containing molecules that are cations (e.g., protonated amines) during CEX, which are not later recovered. The USGS NWIS dataset of river water from the Suwannee River at Fargo, GA (Station ID 2314500) includes hundreds of measurements of NH4+, TOC, and TON that were taken between 1971 and 2014. From the USGS dataset, the average TON/TOC molar ratio was 0.020±0.011 (n=145) in the raw water. The excellent agreement between USGS estimates of N/C ratios in the bulk river water (0.020±0.011) and the N/C ratio of the isolated and desalted NOM sample (0.022±0.001) indicates that there was very little selective gain/loss of nitrogenous organic solutes during the isolation of this sample of SRNOM.
Summary
In the past, the Suwannee River has been an ideal river for isolation of aquatic humic materials because of its high [DOC], low concentration of inorganic solutes, and relatively pristine character. In May 2012, a large volume of river water (36,890 L) was concentrated by RO, desalted by CEX, and freeze dried to generate a new NOM sample, which is designated by the IHSS as 2R101N. During sampling, the river level was lower than in the past sampling trips and the [DOC] and conductivity were higher, which may be from drought and may reflect the removal of flow controls for the Okefenokee Swamp sometime in the early 2000s. The increase in public access to the site may have an impact on its pristine nature, and this potentiality should be considered when planning future sampling expeditions to this sampling site.
Overall, there was an 84.2% yield of the initial DOC for the complete sample (2R101N), which compares reasonably well with the 88% yield for 1R101N. The ash content of 2R101N (3.89%) was lower than for the previous 1R101N (7.0%) sample, due to a more complete desalting of the sample. The mass of NOM collected for 2R101N (6,124 g) was four to six times the mass collected at any single time previously at the Suwannee River.
The 2R101N sample is distributed by the IHSS to scientists who study aquatic NOM (https://ihss.humicsubstances.org/orders.html). Further chemical analysis of the 2R101N sample is forthcoming and is the subject of other articles in this special issue.
Footnotes
Acknowledgments
The authors would like to thank the IHSS for the financial support for this project. Additionally, Ball State University provided reduced overhead to help fund this project. The authors thank the Okefenokee National Wildlife Refuge for site access and housing in a cabin near the site. The authors appreciate help from Dr. Michael Gonsior, who provided assistance in the field work, from Shamus Driver, who assisted in desalting/homogenizing the sample, and from several personnel at Van Drunen Farms who worked diligently to ensure the successful freeze drying of the concentrated NOM sample and harvesting of the freeze-dried product.
Author Disclosure Statement
No competing financial interests exist.