
Abstract
Abstract
Concentrations and distributions of metals in Suwannee River (SR) raw filtered surface water (RFSW) and dissolved organic matter (DOM) processed by reverse osmosis (RO), XAD-8 resin (for humic and fulvic acids [FA]), and XAD-4 resin (for “transphilic” acids) were analyzed by asymmetrical flow field-flow fractionation (AsFlFFF). SR samples were compared with DOM samples from Nelson's Creek (NLC), a wetland-draining stream in northern Michigan; previous International Humic Substances Society (IHSS) FA and RO samples from the SR; and an XAD-8 sample from Lake Fryxell (LF), Antarctica. Despite application of cation exchange during sample processing, all XAD and RO samples contained substantial metal concentrations. AsFlFFF fractograms allowed metal distributions to be characterized as a function of DOM component molecular weight (MW). In SR RFSW, Fe, Al, and Cu were primarily associated with intermediate to higher than average MW DOM components. SR RO, XAD-8, and XAD-4 samples from May 2012 showed similar MW trends for Fe and Al but Cu tended to associate more with lower MW DOM. LF DOM had abundant Cu and Zn, perhaps due to amine groups that should be present due to its primarily algal origins. None of the fractograms showed obvious evidence for mineral nanoparticles, although some very small mineral nanoparticles might have been present at trace concentrations. This research suggests that AsFlFFF is important for understanding how metals are distributed in different DOM samples (including IHSS samples), which may be key to metal reactivity and bioavailability.
Introduction
D
Evidence from redox experiments (Rose and Waite, 2005; van Schaik et al., 2008), cation and ligand exchange experiments (Schmitt and Frimmel, 2003), and spectroscopic analysis (Allard et al., 2004; Karlsson et al., 2008; Karlsson and Persson, 2010) suggests that DOM may form both strong and weak complexes with Fe and Al. These trivalent metals tend to bind particularly well to larger, more aromatic humic (i.e., XAD-8 resin extractable) molecules containing abundant carboxyl and phenolic functional groups (Weber et al., 2006; Cabaniss, 2009, 2011). Observations of increases in DOM MW upon addition of Fe or Al (Jones et al., 1993; Nierop et al., 2002; Murray and Parsons, 2004) and of decreases in average MW upon their removal (Pullin et al., 2007) suggest that these trivalent metals may potentially bridge smaller DOM molecules into larger components.
Cu and Zn also readily associate with DOM (Taylor and Garbarino, 1989; Ephraim, 1992)—weakly with carboxyl groups, but strongly with amine groups on smaller, less aromatic DOM components (Croué et al., 2003; Glover et al., 2005; Cabaniss, 2011) common to XAD-4 resin isolates (Aiken et al., 1992; Croué et al., 1999). Craven et al. (2012) found that the binding affinity of DOM for added Cu decreased as the Cu:DOM ratio increased, which they suggested might be due to associations with different functional groups. Pb and Ni also bind to amine groups, although Pb more readily binds to high MW DOM components, whereas Ni associates with smaller, more aliphatic DOM components (Cabaniss, 2011). Rare earth elements (REEs) bind to humic and FA with stability constants similar to those of Cu and Zn (Stern et al., 2007). Carboxylic groups appear to be the main REE-binding sites (Yamamoto et al., 2005; Pourret et al., 2007), although both weak and strong complexes exist (Dupré et al., 1999; Kubota et al., 2002). In filtered river water, REEs typically associate with DOM molecules of higher than average MW (Ingri et al., 2000; Neubauer et al., 2013a).
Although scientific understanding of metal distributions as a function of DOM component MW is growing for bulk (i.e., unfiltered) or filtered water (e.g., Krachler et al., 2010; Stolpe et al., 2010; Neubauer et al., 2013a; Stolpe et al., 2013), little is known about the effects of DOM isolation procedures on metal distributions. This research compared concentrations and distributions of metals and REEs in raw filtered surface water (RFSW) to XAD-8, XAD-4, and reverse osmosis (RO) samples obtained from a May 2012 IHSS sampling effort at the SR. Distributions of metals associated with DOM molecules of different MWs were determined by asymmetrical flow field-flow fractionation (AsFlFFF) with in line ultraviolet/visible light absorbance spectroscopy (UV/Vis), fluorescence, and inductively coupled plasma mass spectrometer (ICP-MS) detectors. Extensive background on AsFlFFF applications to organic-rich aquatic samples is supplied in the Supplementary Data.
SR sample results were compared to the following: (1) DOM processed by XAD-8, XAD-4, or RO from Nelson's Creek (NLC, MI, USA); (2) IHSS aquatic DOM RO reference sample 1R101N from the SR; (3) IHSS FA standard 2S101F from the SR; and (4) DOM isolated by XAD-8 from Lake Fryxell (LF; Taylor Valley, Antarctica). SR DOM is considered to be an end-member for DOM of a primarily plant-derived origin (McKnight et al., 2001), whereas the LF sample represents an end member of microbial (algal) origin since plants are essentially absent in Antarctica (Horowitz et al., 1972).
Materials and Methods
DOM collection sites
SR DOM was collected May 3–17, 2012 (Green et al., 2014); river water had average temperature=25°C, pH=3.68, and dissolved organic carbon concentration [DOC]=82.7 mg C/L. The study also used samples that had been collected; processed by XAD-8, XAD-4, and RO; and freeze dried in 2001 from NLC, a humic-rich first-order stream in the Ottawa National Forest (MI, USA) (Pullin et al., 2004). DOM isolated by XAD-8 from LF, an oligotrophic lake in the McMurdo Dry Valleys Region of Antarctica, was also used (sample courtesy D. McKnight, University of Colorado; McKnight et al., 1991). Samples that were isolated by XAD-8 or -4 resins or concentrated by RO are collectively referred to as “processed,” herein. Elemental analysis and ash content of processed SR DOM and NLC samples are presented in Kuhn et al. (2014) and Pullin et al. (2007), respectively.
SR RO concentration procedure
As described in detail by Green et al. (2014), more than 36,000 L of RFSW was processed by RO in May 2012 following the procedure outlined by Serkiz and Perdue (1990). Given the extremely large sample volume, the sample was postprocessed using cation exchange resin (Chelex® 50 resin, Na form) rather than cation exchanged (Dowex® 50 resin) prior to entering the RO system, as done on previous sampling trips. A small sample that did not undergo cation exchange (designated SR RO PreCX, here) was retained for comparison. The cation-exchanged RO sample was freeze dried, splits were separated for use by several researchers, and the bulk concentrate was delivered to the IHSS to become aquatic NOM reference sample 2R101N. RO concentration had been conducted in a similar manner at NLC, but the RFSW was cation exchanged using Dowex-50 resin prior to entering the RO system (Pullin et al., 2004).
SR XAD isolation procedure
SR RFSW was filtered in the same manner as the RO sample (Green et al., 2014) at various intervals over the 15-day sampling period, stored in refrigerated 20 L Nalgene® HDPE (high-density polyethylene) carboys, and shipped to Boulder, CO (Aiken USGS laboratory) in ice-filled coolers. DOM was fractionated in June 2012 using Amberlite® XAD-8 and XAD-4 resins (Thurman and Malcolm, 1981; Aiken et al., 1992). The isolates were H+ saturated using AG-MP 50 cation exchange resin (Biorad), lyophilized, and stored in a desiccator in the dark. LF DOM was isolated following the same methodology. For the May 2012 samples, trace-metal grade reagents were used throughout. Previous XAD samples from the Aiken lab (LF, NLC, and SR 2S101F used here) were processed using only analytical grade reagents, which could explain higher concentrations of some metals and REEs in these earlier samples (see Results, below). The percentages of different organic components in the 2012 sample of SR RFSW determined using a slightly modified version of the fractionation scheme outlined by Aiken et al. (1992) are presented in the Supplementary Data. We note that the XAD-8 isolate from the May 2012 sampling was not separated into humic versus FA because not enough material was available to produce a substantial humic sample for analysis.
Measurements of DOC, absorbance, and fluorescence indices
Freeze-dried DOM was resolubilized in ultrapure (18 MΩ; Millipore® Advantage A10 system) water prior to analysis. [DOC] was measured using a Shimadzu-TOC-V and absorbance was measured using a Varian Cary 5000 UV/Vis spectrometer (University of Notre Dame). The absorbance at λ=280 nm was normalized to moles C to provide “molar absorptivity” or ɛ280 (in L/[mol C·cm]), which has been shown to correlate with DOM aromaticity (Traina et al., 1990). The fluorescence index (FI) (McKnight et al., 2001) was calculated from emission values of λ=450 nm/500 nm at excitation at λ=370 nm (Horiba Fluoromax-4; University of Colorado, USA). Lower FI values indicate more plant-derived, terrestrial DOM origins, whereas higher FI values indicate microbial/algal origin (McKnight et al., 2001; Cory and McKnight, 2005).
Analysis of total metal, REE, and anion concentrations
Total metal and REE concentrations were analyzed using an Agilent Technologies 7700x ICP-MS and a Perkin Elmer 5300 DL ICP-OES. Ultrapure water and acid (2% HNO3, Merck Suprapure Grade, 65%) blanks were also analyzed. Resulting data were normalized to organic C on a weight basis to account for differences in RFSW and resolubilized sample [DOC]s. Major anion concentrations were analyzed by ion chromatography (Dionex ICS-1000) and were also normalized to [DOC].
Multi-detection AsFlFFF analysis
The pH of each DOM sample was adjusted to seven (with NaOH, Trace Metal Grade; Sigma-Aldrich) prior to analysis by AsFlFFF. As described in detail by Kuhn et al. (2014), this pH adjustment is needed to match the pH of the mobile phase and to maximize DOM recovery by AsFlFFF (Neubauer et al., 2011). This pH adjustment did not appear to substantially impact DOM MW or metal distributions (Supplementary Fig. S4). Samples were analyzed using a multi-detection AsFlFFF system (Environmental Geosciences Laboratory, University of Vienna) following methods of Neubauer et al. (2011) (See the Supplementary Data).
In order to compare data, it is helpful to calculate average MWs from fractograms (Bolea et al., 2006), although these values should not be considered “true” MWs. Number-average MW (Mn) is routinely calculated from size exclusion chromatography data as (Chin et al., 1994):
where hi is the height of the detector signal response (after baseline correction) from retention time i to N and Mi is the MW at retention time i. A similar equation was used to analyze fractogram data, but with elution time/volume replacing retention time. The resulting values based on UV/Vis fractograms are designated DOM-Mn whereas values resulting from ICP-MS fractograms for various metals are designated “metal-Mn” (where “metal” may be Fe, Al, etc.). As outlined in the Distributions of Metals and REEs with DOM MW section, the metal-Mn calculations are provided for comparative purposes and are not meant to imply that the metals are directly bound to DOM or that inorganic (mineral) nanoparticles are not present.
Results
Bulk analysis of DOM samples
Values of ɛ280 for SR RFSW, RO, and XAD-8 samples (Table 2 and Fig. 1) are similar to one another, which is consistent with the fact that the SR RFSW was 60% “hydrophobic organic acids” (i.e., XAD-8 isolate; humic and FA). However, the XAD-4 isolate has substantially lower ɛ280 (262 for XAD-4 versus >450 L/[mol C·cm] for the other samples), as DOM processed by XAD-4 tends to be lower MW and less aromatic (Aiken et al., 1992; Nwosu and Cook, 2014, in this issue). NLC XAD-4 also has a relatively low ɛ280 (Table 2 and Fig. 1). The ɛ280 of the May 2012 SR RO (2R101N) sample is higher than that of the older SR RO (1R101N) sample, indicating greater aromaticity. The ɛ280 of the new SR XAD-8 isolate is substantially higher than that of an IHSS FA standard (2S101F) collected in 2003, perhaps at least in part because the new XAD-8 sample likely contains at least some humic acid, which tends to be more aromatic than FA (Thorn et al., 1989).
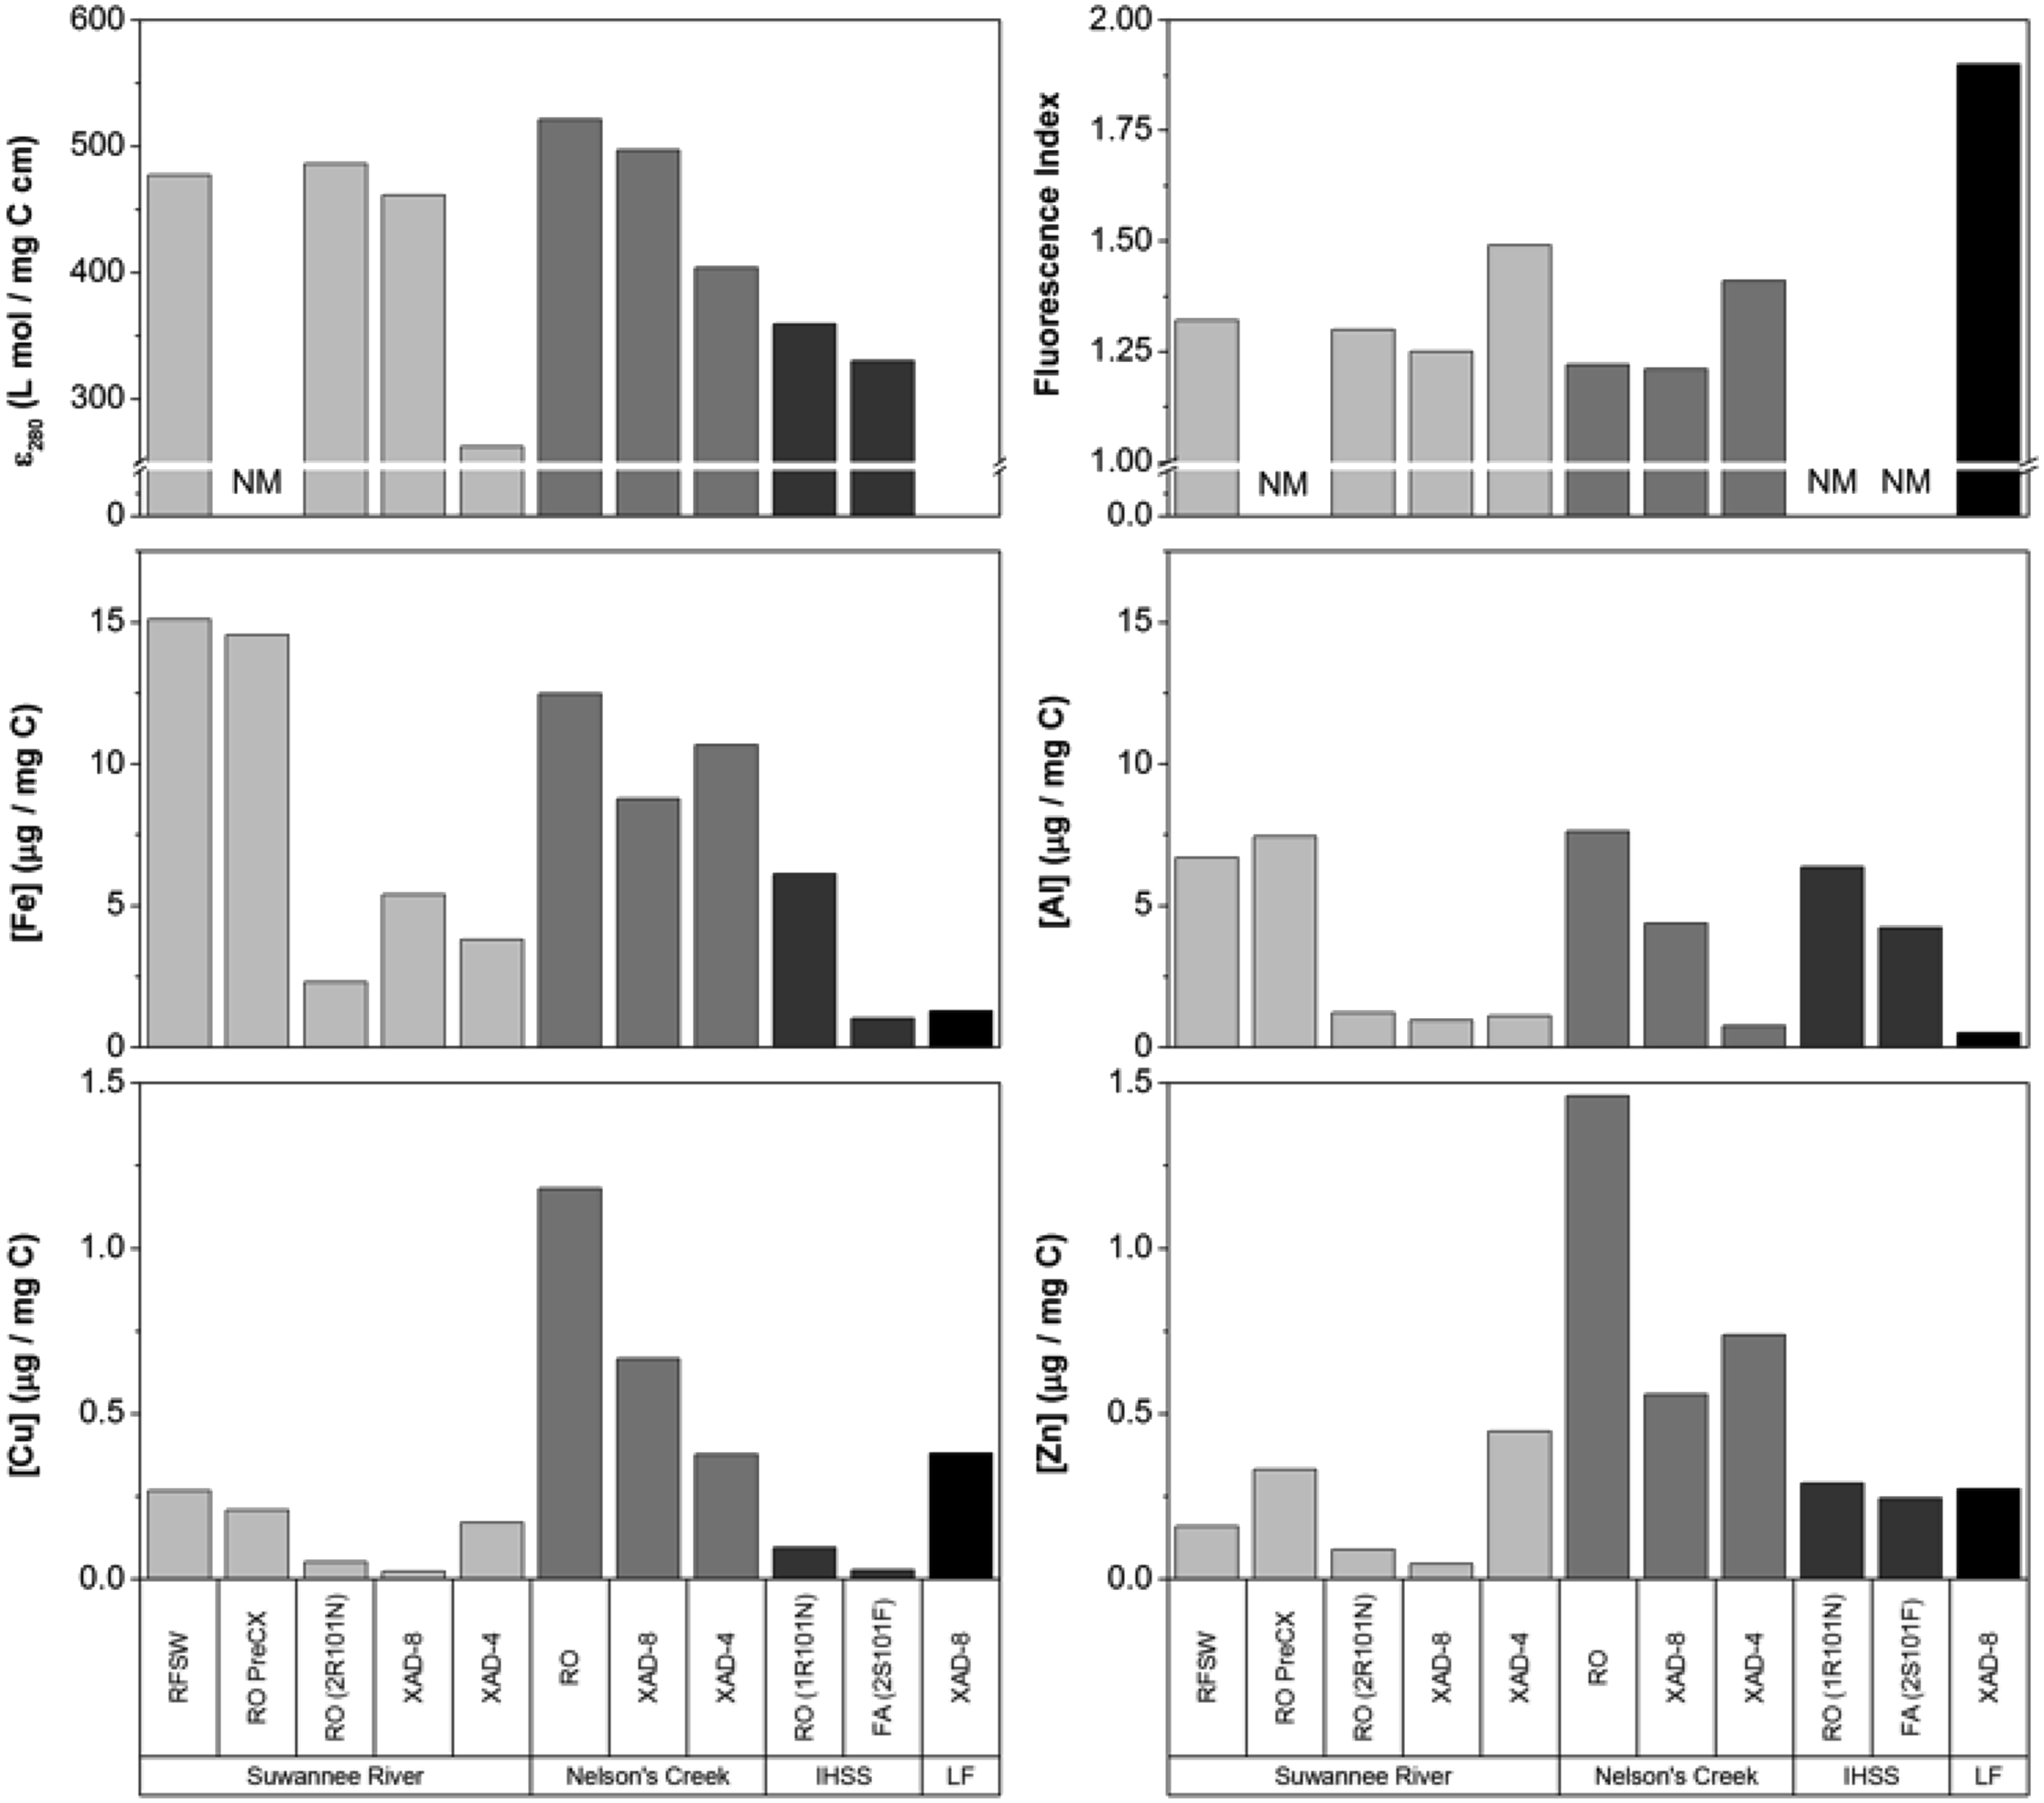
Comparison of molar absorptivity at λ=280 nm (ɛ280), fluorescence index (FI), and bulk metals concentrations of raw filtered surface water (RFSW), pre- and post-Chelex®-treated reverse osmosis (RO PreCX, RO 2R101N), and XAD-8 and XAD-4 DOM from the Suwannee River (SR); XAD-8 isolate Nelson's Creek (NLC); FA from Lake Fryxell (LF); IHSS SR RO sample 1R101N; and SR FA 2S101F. The white horizontal bar in ɛ280 and FI subfigures denotes a break in vertical scale. DOM, dissolved organic matter; FA, fulvic acid; IHSS, International Humic Substances Society; NM, not measured.
Samples include (left to right) RFSW, pre- and post-Chelex-treated reverse osmosis (RO PreCX, RO 2R101N) and XAD-8 and XAD-4 DOM isolated from the SR (May 2012), NLC (2002), and Lake Fryxell (LF, 1987) in addition to a resolubilized International Humic Susbtances Society (IHSS) aquatic NOM reference sample (RO 1R101N, 1999) and a fulvic acid standard (FA 2S101F, 2003). ɛ280 is the molar absorptivity at λ=280 nm. FI is the fluorescence index (450/500 nm emission at 370 nm excitation). NM, not measured due to limited sample quantity. Concentrations of other anions (F, NO2, Br, and NO3) were below detection for RO, XAD-8, and XAD-4 isolates from the SR and not measured for other samples (NM).
From Young et al. (2006).
McKnight et al. (2001) showed that higher values of FI suggest a more algal/microbial source of DOM whereas lower values suggest more terrestrial origins. As shown in Table 2 and Fig. 1, the SR XAD-4 isolate FI (1.49) is somewhat higher and the XAD-8 FI slightly lower (1.25) than the RFSW or RO FI values (1.32 and 1.30, respectively). The NLC XAD-4 also has higher FI than the RO or XAD-8 samples from this site. LF XAD-8 FI is substantially higher than values for SR or NLC XAD-8 isolates, which is consistent with the fact that plants are essentially absent in Antarctica (Horowitz et al., 1972). Values of FI significantly decrease with increasing ɛ280 (analysis of variance [ANOVA] analysis: r=−0.92; p<0.05).
Most of the processed SR samples contain lower concentrations of major cations, except K+, compared to the RFSW relative to organic C on a weight basis (Table 2). The high SO42− concentration of 2R101N is typical of RO samples that have not undergone electrodialysis (Sun et al., 1995) and the high Na+ concentrations of the XAD-processed samples are consistent with the use of NaOH in elution and pH adjustment that are essential parts of the fractionation procedure (Aiken et al., 1992).
Concentrations of trace metals
Figure 1 and Table 3 and Supplementary Table S2 present data on concentrations of trace metals normalized to mg C (to account for resolublization of freeze-dried samples that results in somewhat different C contents). All samples contain substantial concentrations of metals despite treatment by cation exchange using Chelex® resin (all RO samples except Pre-CX RO) or AG-MP 50 (XAD isolates); REEs also are present (Fig. 2 and Supplementary Table S3). Chelex treatment of the SR RO (2R101N) sample decreased concentrations of all REEs and metals other than 52Cr. For SR RO (PostCX and 2R101N), XAD-8, and XAD-4 samples collected in May 2012, the concentrations of most metals and REEs are lower than in RFSW on an organic C weight basis.
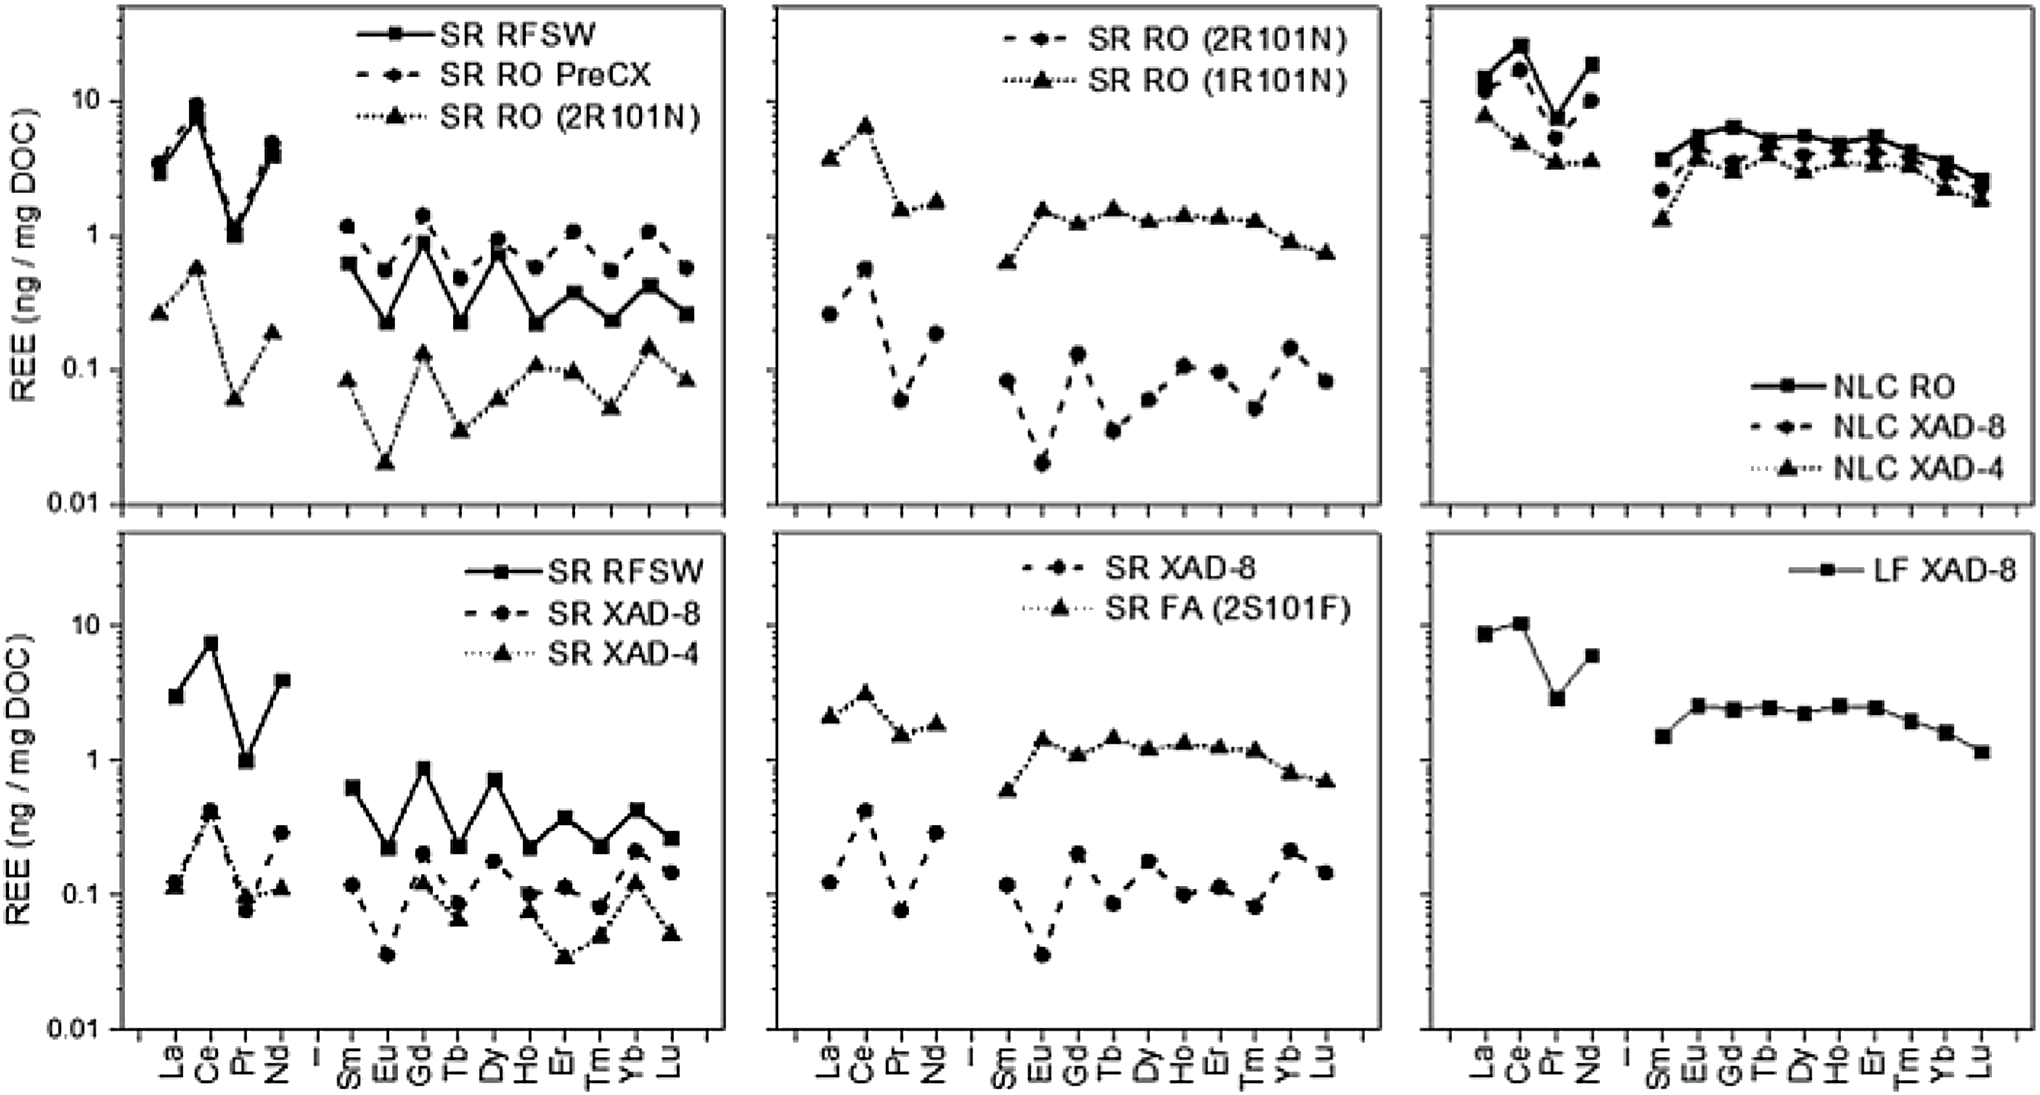
Selected REE concentrations (normalized to the [DOC] of the injected solution). Data points with [REE] below analytical limits of quantification by ICP-MS are not shown. DOC, dissolved organic carbon; ICP-MS, inductively coupled plasma mass spectrometer; REE, rare earth element; RFSW, raw filtered surface water.
For explanation of sample acronyms, see Table 1. Analytical error of three replicate measurements made by ICP-MS are <0.1%.
Al and Fe are the most abundant trace metals, with concentrations generally in the range of ∼1–10 μg/mg C, likely reflecting the strong binding affinities of DOM for these trivalent metals (Kerndorff and Schnitzer, 1980). Concentrations of Cu and Zn are generally ∼1 μg/mg C or less. Ni, and Cr concentrations are <1 μg/mg C except for the NLC XAD-4 isolate. Concentrations of Cu, Zn, and Ni in SR samples and of Ni and Cr in NLC samples are an order of magnitude or more higher in XAD-4 isolates than in XAD-8 isolates, perhaps at least in part because N-containing amine functional groups that bind these metals tend to be abundant in lower MW, nonhumic components (Croué et al., 2003). The SR XAD-8 sample contained 1.02 weight% N compared to 1.82 weight% N for the XAD-4 sample (on an ash-free basis; Kuhn et al., 2014), which is consistent with potentially higher amine concentrations in the XAD-4 material. Mn is associated with all samples at concentrations within an order of magnitude of those of Cu and Zn. Comparison of DOM samples from SR and NLC shows no clear trend in isolate/concentrate type and concentration of Fe, Al, Cu, or Zn (the four metals for which excellent AsFlFFF metals distribution data could be obtained).
Concentrations of REEs
All samples contained REEs, (Fig. 2 and Supplementary Table S3) which is consistent with previous observations that REEs strongly associate with aquatic DOM (Dupré et al., 1999; Ingri et al., 2000). The enrichment of light REEs (La-Gd) compared to heavy REEs (Tb-Lu) (Fig. 2) is typical of river water (Goldstein and Jacobsen, 1988; Johannesson et al., 2004). There are differences in REE concentrations between the different source environments and collection times, but no consistent trends are observed between RO and XAD processing methods. Differences in REE patterns (Fig. 2) and concentrations between DOM samples collected at different times from the SR might be due to factors such as seasonal fluctuations, different cation-exchange procedures, or changes in the purity of acid used during isolation. Although Tang and Johannesson (2010) measured a substantially higher complexation capacity of 1R101N compared to 1S101F for added REEs, there is little difference in the concentrations of associated REEs between 1R101N and 2S101F or between RO and XAD-8 samples from May 2012.
Distributions of metals and REEs with DOM MW
We were only able to obtain consistently high quality ICP-MS fractograms for Al, Fe, Cu, and Zn (Figs. 3–5) and more “noisy” fractograms for La, Ce, Nd, and Pb (Supplementary Figs S2 and S3). Mn did not yield useful fractograms despite being present at substantial concentrations. Note that DOM (absorbance data) and metal (ICP data) fractograms are at different vertical scales in these figures.

UV/Vis (at λ=254 nm) and Fe and Al ICP-MS fractograms measured using AsFlFFF. Factograms are normalized to [DOC] of the injected solution. Calculated DOM-Mn, Al-Mn, and Fe-Mn values are given next to each fractogram. Note that higher molecular weight components appear at higher elution volumes in these and subsequent fractograms. AsFlFFF, asymmetrical flow field-flow fractionation; UV/Vis, ultraviolet/visible light absorbance spectroscopy.
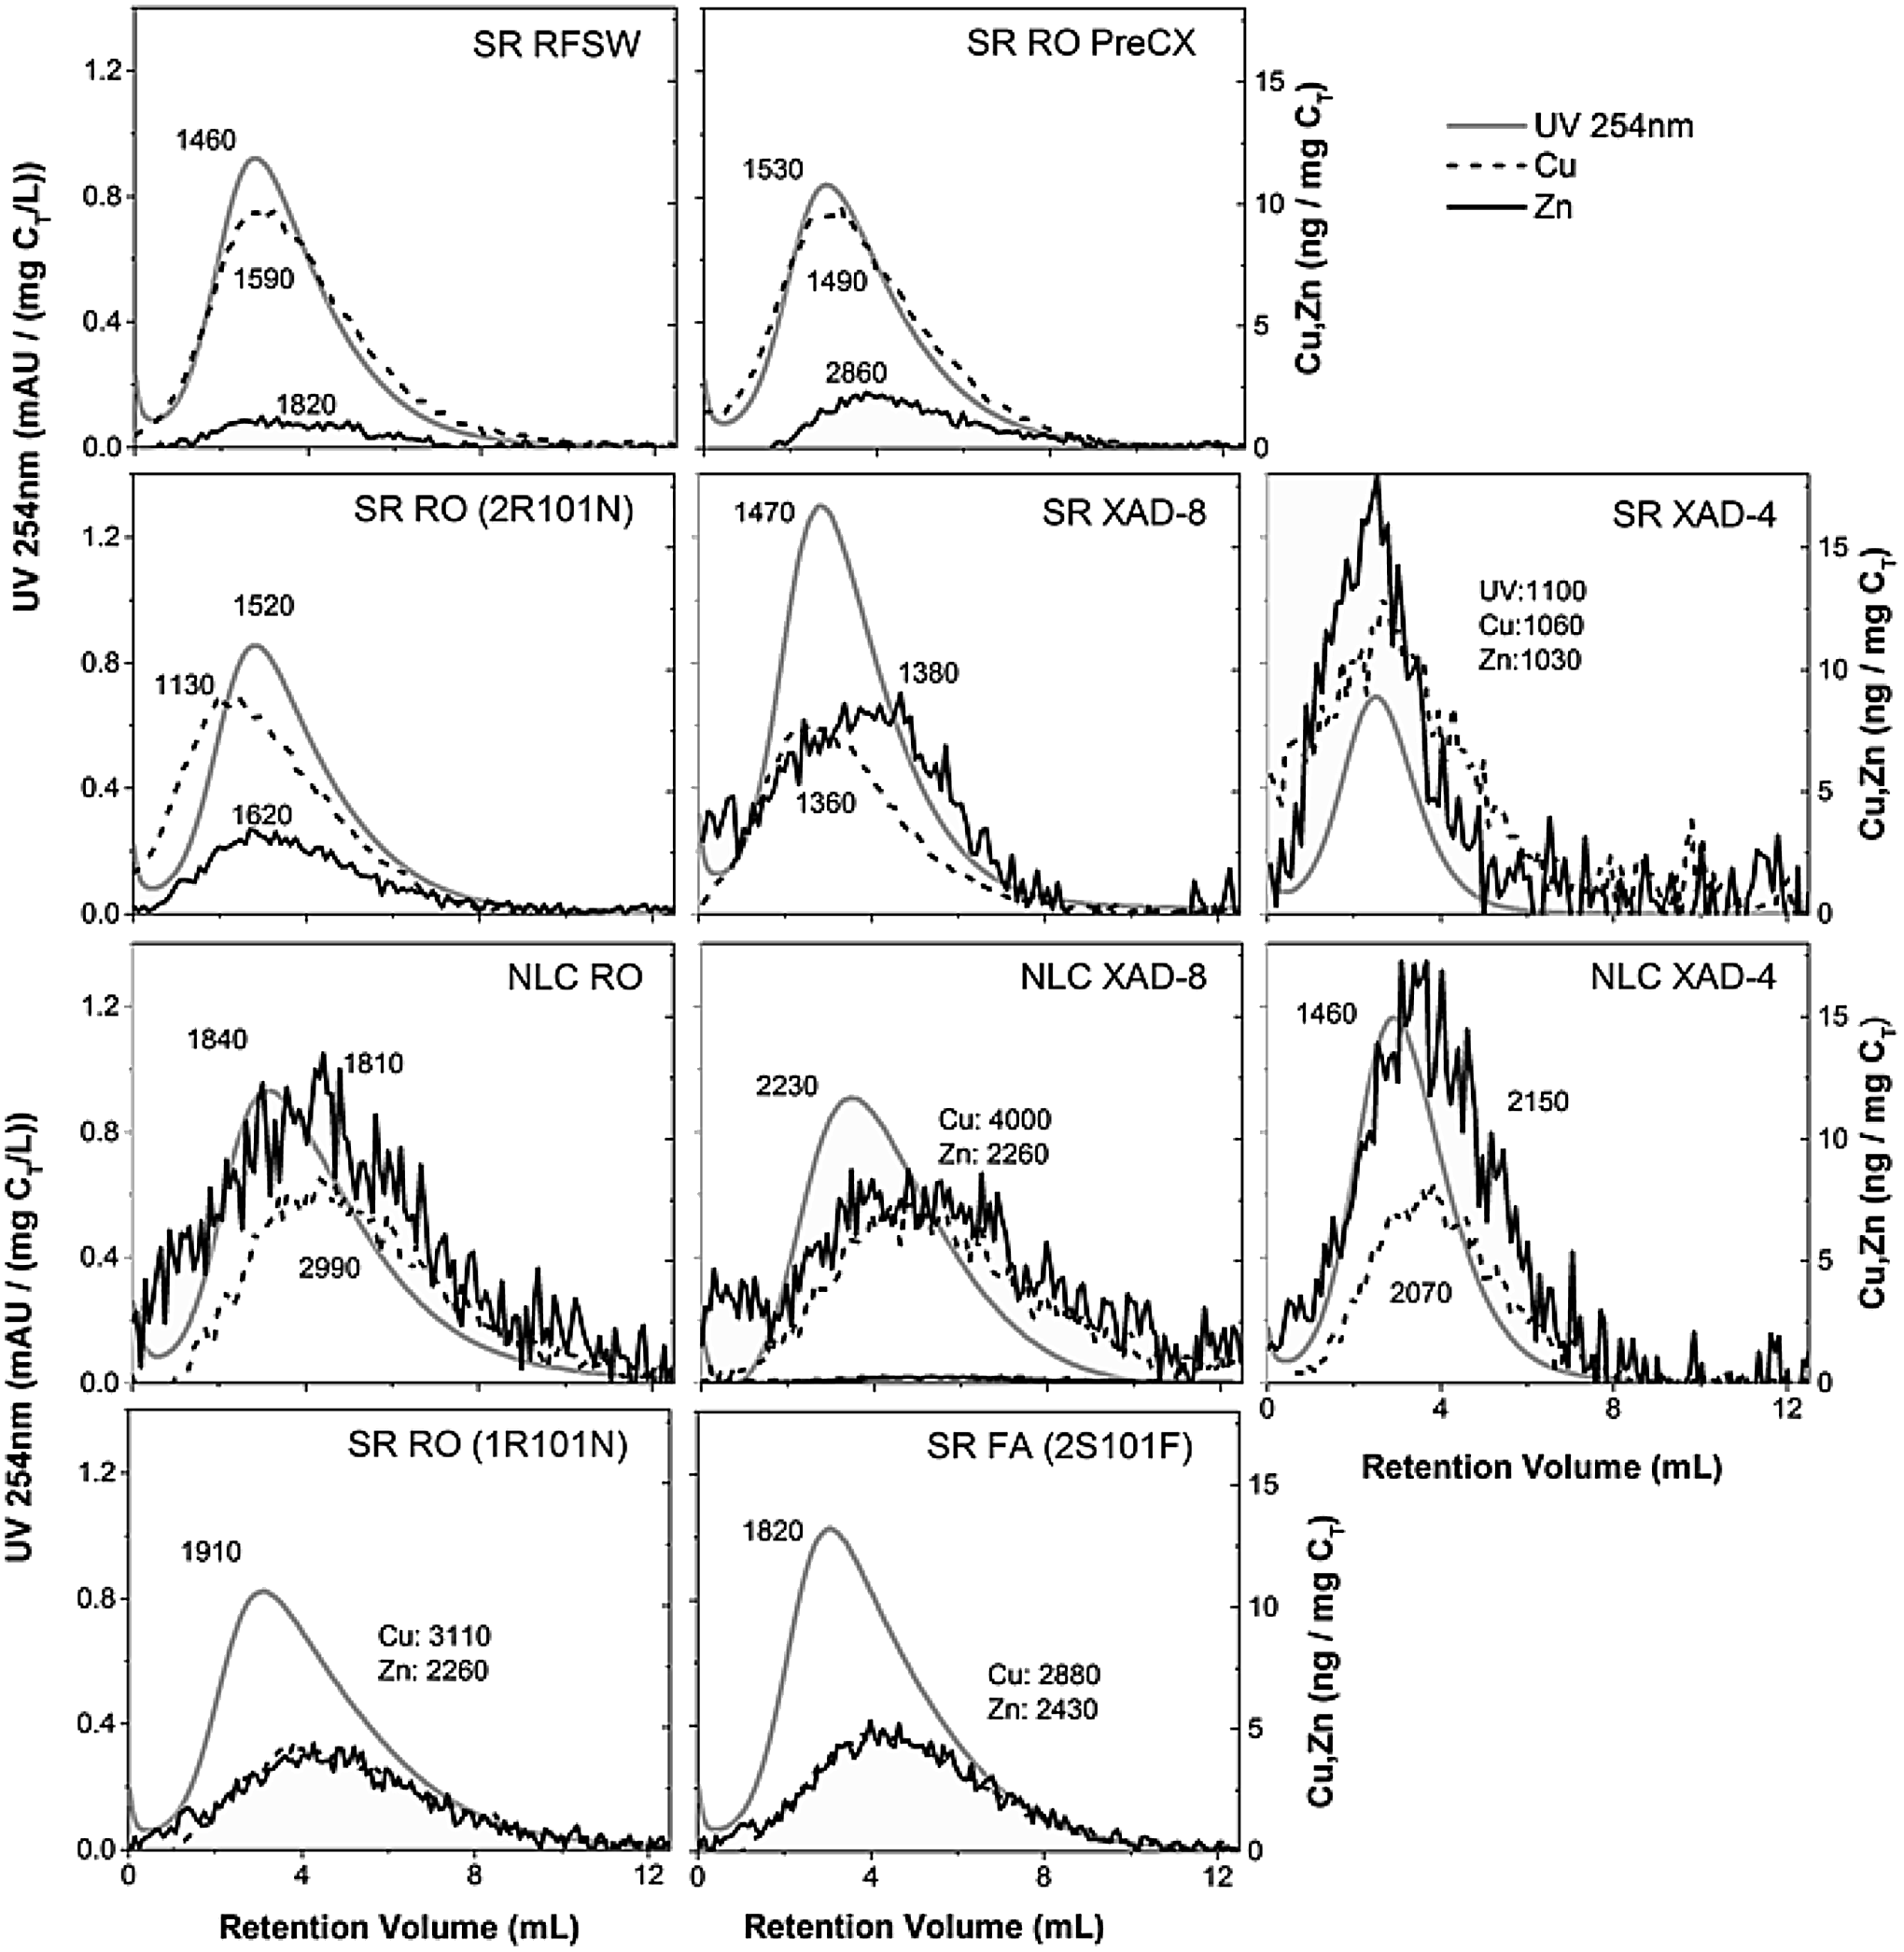
UV/Vis (λ=254 nm) and Cu and Zn ICP-MS fractograms (Cu and Zn) measured using AsFlFFF. Sample acronyms as in Fig. 1. Fractograms are normalized to [DOC] of the injected solution. Calculated DOM-, Cu-, and Zn- Mn values are given next to each fractogram.

UV/Vis (λ=254 nm) and Cu and Zn ICP-MS fractograms for the LF XAD-8 isolate analyzed by AsFlFFF. Fractograms are normalized to [DOC] of the injected solution. Calculated DOM-Mn, Cu-Mn, and Zn-Mn values are given next to each fractogram.
Nanomaterials of different forms have been identified in AsFlFFF fractograms of river waters, and their presence has to be considered when discussing the metal distributions of these samples. Recently, Stolpe et al. (2013) identified three types of nanomaterials in Alaskan rivers: organic/fulvic rich, organic-Fe rich, and Fe-rich. Neubauer et al. (2013a, 2013b) observed that inorganic (mineral or amorphous) nanoparticles (NPs) appeared as a second peak in the AsFlFFF fractograms, at between 10–14 mL, corresponding to ∼10,000–60,000 Da. The fractograms of the various samples investigated here did not contain such a second peak that would clearly indicate the presence of inorganic NPs. Given that there is no direct evidence in the fractograms for inorganic nanoparticles, we speak of metal associations in terms of DOM MW and calculate metal-Mn values accordingly. However, we cannot assume that all metals are directly bound to DOM, especially in the RFSW sample, or rule out very small mineral NPs that might not appear as a distinct second peak because of low concentrations.
In SR RFSW, Al and Fe associate with DOM components of higher retention volume, hence higher MW, than does Cu (Figs. 3 and 4). Similar associations have been observed over a wide range of source environments and geochemical conditions (Stolpe et al., 2005; Bolea et al., 2006; Dahlqvist et al., 2007; Neubauer et al., 2013a). Previous research suggests that Fe and Al tend to bind to larger, more aromatic DOM molecules whereas Cu binds to smaller, more aliphatic, N-rich DOM molecules (Kaschl et al., 2002; Croué et al., 2003; Cabaniss, 2009). Al- and Fe- bridging of smaller molecules into larger components could also play a role in observed MW trends (Kuhn et al., 2014). The SR RO and XAD samples from May 2012 show similar trends to the RFSW; however, in the other SR and NLC samples, Cu tends to associate more with average- to higher-than-average MW components. For some samples, Zn distributions are similar to those of Cu whereas for other samples, the two are substantially different. Also with the exception of the SR XAD-4 isolate, the number average MW (Mn) of metal associations increase as: Cu-Mn<Al-Mn<Fe-Mn (Supplementary Table S4).
Despite the similarity in DOM-Mn between SR RFSW and RO (2R101N) and XAD-8 samples (within 4%, relative percent error), there are differences in metal distributions, hence metal-Mn values, between SR RFSW and processed (by RO or XAD) samples. The differences might be due at least in part to nuances in cation-exchange procedures, which can affect metal concentrations and distributions. The Fe-Mn of SR RFSW (2,420 Da) is similar to that of the noncation-exchanged PreCX RO sample (2,480 Da); but upon Chelex treatment, Fe-Mn drops to 1,880 Da. Al-, Cu-, and Zn-Mn in the RO sample are likewise strongly affected by Chelex treatment. The Fe-Mn of the XAD-8 isolate (3,080 Da) is more than 1.5 times that of the RO concentrate (1,880 Da), which would contain XAD-4 components (with Fe-Mn=1,320 Da) in addition to other fractions.
Zn did not show any consistent association with higher or lower MW components. Potentially, (1) Zn may not preferentially bind to DOM molecules of specific size/aromaticity or (2) since measured and predicted Zn-DOM complexation is weak (Cabaniss, 2011), competition with Fe, Al, and Cu may control the extent of binding and distribution of Zn.
ICP-MS fractograms for La, Ce, Nd, and Pb are presented for SR DOM samples in the Supplementary Data (Supplementary Figs S2 and S3), although the low concentrations and overall noisy fractograms made it difficult to quantify values of metal-Mn. Similar to Fe and Al, La, Ce, Nd, and Pb appear to associate with DOM molecules of average- and higher-than-average MW, a result that was also observed by Neubauer et al. (2013a) for organic-rich wetland runoff.
Linear regression analysis was performed to search for potential correlations between values of Al-Mn, Fe-Mn, Cu-Mn, or Zn-Mn and values of ɛ280, FI, or DOM-Mn of DOM samples (excluding RFSW and RO PreCX); statistical significance was tested by ANOVA (p=0.05). Although the DOM-Mn of SR, NLC, and IHSS samples correlates significantly with the Al-Mn (r=0.87 and 0.81, respectively), Fe-Mn (r=0.95 and 0.85, respectively), and Cu-Mn (r=0.87 and 0.82, respectively), it does not correlate with the Zn-Mn. There are no statistically significant correlations between any of the values of metal-Mn and either ɛ280 or FI.
Although Fe and Al are present in the resolubilized bulk solution of the LF XAD-8 isolate (Table 3), Al and Fe ICP-MS signal recoveries on the AsFlFFF system were low (Supplementary Table S2). Al and Fe might be associated in a different manner with the LF sample than with the other DOM samples; perhaps Al and Fe are bound to very small organic molecules that pass through the membrane or they are in colloidal form that is beyond the size range of particles measured here (i.e., beyond the highest polystyrene sulfonate calibration standard of 145,000 g/mol; see Neubauer et al. [2011] for calibration and NP size considerations). Cu-Mn and Zn-Mn are lower than DOM-Mn for the LF sample, indicating preferential association of these metals with intermediate- to lower- MW components (Fig. 5).
Environmental Implications
Although treatment of the May 2012 SR samples using Chelex (RO concentrates) or AG-MP 50 (XAD isolates) resins lowered the concentrations of many metals (relative to C on a weight basis) by an order of magnitude relative to RFSW, substantial concentrations of metals remained, reflecting the inherent metal-binding affinities of both humic (Tipping, 2002) and nonhumic (Croué et al., 2003) components. The presence and distributions of metals in processed DOM samples, including those available from the IHSS, could potentially affect measured DOM physiochemical properties. As observed by AsFlFFF, Fe and Al tend to associate with higher MW components. Kuhn et al. (2014) found that removal by reaction with the strong metal chelating ligand desferrioxamine B (DFOB) of substantial Fe and lesser amounts of Al from the RO, XAD-8, and XAD-4 samples used here shifted AsFlFFF UV/Vis fractograms (λ=254 nm) to lower MWs. Measurements of DOM MW by VPO or SEC could also be affected by the presence and potentially the distributions of metals.
Fluorescence analysis can provide information about DOM source environments (Pullin and Cabaniss, 1997; McKnight et al., 2001; Stedmon et al., 2003; Birdwell and Engel, 2009) and composition (Cory and McKnight, 2005). However, the presence of inherent metals may affect fluorescence. For example, Fe is well known to quench fluorescence, whereas Al may either enhance or inhibit fluorescence at different excitation/emission wavelengths (Cabaniss, 2004). Pullin et al. (2007) found that addition of the strong complexing ligand DFOB to the NLC XAD-8 isolate used here increased fluorescence intensity at the “H” peak (excitation 320 nm and emission 450 nm) but decreased intensity at the “A” peak (excitation 230 nm and emission 435 nm), presumably due to removal of the inherent Fe and/or Al. DOM samples are often acidified to decrease the effects of metals on fluorescence measurements made to evaluate source environments (McKnight et al., 2001). Yet, even though XAD isolates are exposed to highly acidic and alkaline conditions during processing, this study shows that they retain substantial metal concentrations.
Many of the DOM metal-binding studies compiled by Tipping (1998) and Milne et al. (2003) to develop the Humic Ion-Binding and NICA-Donnan models added metals to DOM isolates (including IHSS reference samples and standards) without necessarily taking into consideration the metals inherently present in the samples. The metals that are inherently present in RO and XAD samples are likely bound to the highest affinity sites; therefore, metal-binding affinities may potentially be underestimated if these metals are not properly considered. AsFlFFF could prove helpful for determining the distributions of metals added in complexation experiments and whether they match distributions in actual field samples.
The metals and REEs that are associated with RO, XAD-8, and XAD-4 samples also have the potential to affect studies of DOM bioavailability or toxicity (Meems et al., 2004) and of DOM effects on metal or NP toxicity (Kim et al., 1999). Fe, Cu, and Zn are essential nutrients, whereas Cd, Pb, and Al are primarily toxins, though even essential nutrients can be toxic at high concentration and in certain forms (e.g., Merian, 1991; Goyer, 1994). Although it has long been argued that metal binding to DOM decreases bioavailability (e.g., Giesy et al., 1977), Kuhn et al. (2012) observed that the aerobic bacterium Pseudomonas mendocina ymp was able to acquire Fe that was naturally associated with the NLC RO and XAD-8 samples used here. Toxicity studies often do not consider the metals inherently present in DOM or consider whether the speciation and distribution of an added metal match natural environments of interest. AsFlFFF with ICP-MS detection may be especially helpful for such bioavailability and toxicity studies. Although we did not measure Ag concentrations or distributions in this study, SR humic and FA collected for the IHSS in 1982–83 were filtered through silver membranes (Malcolm et al., 1994) and therefore could potentially contribute Ag toxicity to biotic experiments.
AsFlFFF fractograms did not provide unequivocal evidence either for or against the presence of Fe- or Al- bearing mineral nanoparticles in the samples studied here. We did not observe a second peak in fractograms at relatively high retention volume as has been previously attributed to inorganic NPs (Neubauer et al., 2013a, 2013b). However, we did observe that Al and Fe fractograms were shifted to longer retention times relative to DOM fractograms. Whether this is because Fe and Al preferentially bind to higher MW components, they bridge smaller components together, and/or they are present at least in part as tiny inorganic NPs has not been fully resolved at this point. Further research is needed to develop a better understanding of the underlying mechanisms behind the observed distributions.
Conclusions
Aquatic DOM samples, even when treated by cation exchange and processed by techniques such as RO and XAD, contain a variety of trace metals and REEs. The metal concentrations can be high enough to affect fundamental DOM properties such as MW and fluorescence and to serve as a bioavailable pool to aerobic microbes. Any researcher who obtains a sample from the IHSS should take into consideration the inherent metals present in the sample.
AsFlFFF with multiple in line detectors, including ICP-MS, can be useful for characterizing the distributions of at least some metals and REEs as a function of DOM component MW. Fe and Al were generally found to preferentially associate with intermediate- to higher than average MW DOM components. Cu tended to associate more with intermediate to lower MW components in many but not all samples, and Zn distributions were variable. We suggest that AsFlFFF should be used in experiments that add metals to aquatic DOM isolates to determine whether the metal distributions are similar to those inherently present in the samples or in filtered waters from the source environments.
Footnotes
Acknowledgments
We thank the Center for Environmental Science and Technology (CEST) at Notre Dame for use of analytical equipment and personnel support. K. Kuhn was supported by an NSF Graduate Research Fellowship and a Pathfinder Fellowship from the Consortium of Universities for the Advancement of Hydrologic Science, Inc (CUAHSI). We thank the Department of Environmental Geosciences at the Univ. of Vienna for use of the AsFlFFF system, and financial, laboratory, and personnel support. D. McKnight kindly provided the LF sample. Collection of the SR samples was partially funded by the IHSS. We thank E.M. Perdue (Ball State Univ.) for overseeing 2012 sample collection at the SR, D. McInnis (Notre Dame) for valuable discussion, and K. Butler (U.S.G.S) for analytical expertise. We thank C.H. Conaway and two anonymous reviewers for many helpful comments. Any use of trade, firm, or product name is for descriptive purposes only and does not imply endorsement by the U.S. Government.
Author Disclosure Statement
No competing financial interests exist.
References
Supplementary Material
Please find the following supplemental material available below.
For Open Access articles published under a Creative Commons License, all supplemental material carries the same license as the article it is associated with.
For non-Open Access articles published, all supplemental material carries a non-exclusive license, and permission requests for re-use of supplemental material or any part of supplemental material shall be sent directly to the copyright owner as specified in the copyright notice associated with the article.