
Abstract
Abstract
The effect of NaCl deicing salt on compost-included stormwater filtration media (SFM) has not been studied so far. This article presents results of an experimental and analytical study conducted to understand the mechanism of permeability reduction in two SFM caused by the application of a common deicing salt (NaCl). The two SFM used were made up of clayey silty sand with and without added compost (15% by mass). Constant-head flow experiments were conducted applying NaCl at two different concentrations. Permeability of SFM without compost reduced by an average of 19.1%, while the permeability of SFM with compost reduced by an average of 93.7%. Mercury intrusion porosimetry (MIP) tests and chemical analyses were conducted on representative samples of the media, both before and after salt application. MIP results showed that median pore sizes enlarged, while permeability reduced. This is counterintuitive, as we usually expect that permeability reduction would be caused by pore-size reduction. MIP results (enlarged pore sizes) suggest that deicing salts caused flocculation of aggregates. Based on analysis of our experimental results and comparison with similar results in the literature, we conclude that permeability reduction of SFM was due to blocking of pore throats by dispersed particles and biofilms. Permeability reduction of the SFM with compost was larger, because compost-salt interactions were comparatively greater than the soil-salt interactions. Results of this study suggest that salt-laden snow should not be piled up near the bioretention facilities built with compost-included SFM.
Introduction
P
Deicing salts are routinely applied to roads before and during snow storms (for public safety). Snow is sometimes piled up near or in bioretention systems by the snow removal teams. As the snow melts, the deicing salts result in elevated salt concentrations (Fitch et al., 2005) that percolate into the SFM.
Salt-laden flow is considered a potential reason for clogging of SFM and reduced performance of bioretention stormwater systems (Denich et al., 2013; Søberg et al., 2014). Several studies have focused on the capacity of bioretention systems to remove urban pollutants, especially metals (Muthanna et al., 2007; Blecken et al., 2009; Trowsdale and Simcock, 2011). Some studies have also focused on the effect of deicing salts (sodium chloride) in reducing the pollutant removal capacity of SFM (Amrhein et al., 1992, 1993; Blecken et al., 2011; Paus et al., 2014; Søberg et al., 2014). Suarez et al. (2006, 2008) focused on the impacts of salt-laden water on agricultural soils and permeability, while Denich et al. (2013) studied the reduction of hydraulic conductivity of the SFM due to application of deicing salts, focusing on the chemistry of the effluent and media. Both research groups concluded that chemical reactions adversely changed the pore structure of the SFM; however, they did not measure the pore structure using any experimental methods.
The experimental investigations described in this article were designed and conducted to measure the pore-size distribution (poreSD) of two types of SFM, with the objective of understanding the effect of deicing salts on the poreSD of SFM with or without compost. The theoretical analysis described in this article was conducted with the objective of understanding the impact of poreSD on the reduction of hydraulic conductivity of the SFM due to the application of deicing salts.
Experimental Investigations
This study focused on the permeability reduction of two types of SFM due to the use of a common deicing salt (NaCl). Essentially, we studied a clayey silty sand, with and without compost, by infiltrating water through the soil columns at two concentrations of NaCl (150 and 1200 mg/L).
Materials used
We prepared these two SFM using soils from two sources and a yard trimming compost from one source. We used (1) a well-graded clean sand from Home Depot in Harrisburg, PA, (2) a fine-grained soil collected by a soil testing company (Kitlinski & Associates, Inc.) from a construction site in Harrisburg, PA, and (3) compost procured from the campus composting facility. The compost was created primarily from yard waste generated during campus landscaping operations. The raw materials were procured from the minimum number of sources, to minimize variability in physical and chemical properties of the SFM. We used locally available natural materials as any contractor of a bioretention system would use.
SFM used in bioretention systems may contain particles coarser than 4.75 mm. However, we removed all particles larger than 4.75 mm because the sample size for mercury intrusion porosimetry (MIP) is limited to 20 mm, and there is a need to maintain a ratio of 4 (at least) between the sample's smallest dimension and the largest particle size. The fine-grained soil and compost were air dried separately; lumps were broken using a wooden hammer, and screened with standard 4.75 and 0.425 mm sieves. The portions passing through the 0.425 mm sieve were retained for preparation of the SFM, and the portions retained on the 0.425 mm sieve were discarded. The purpose of using particles finer than 0.425 mm was to better study the effects of chemical reactions, because these particles have larger specific surface areas, and interact proportionately more with ions in the permeant. The well-graded clean sand procured from Home Depot was screened through a standard 4.75 mm sieve only, and it contained mostly sand particles (4.75 to 0.075 mm), in addition to some silt and clay.
Using the materials described earlier, we prepared these two SFM types: (1) “Soil only,” consisting of 60% sand from Home Depot, and 40% fine-grained soil (<0.425 mm), and (2) “Soil with compost,” consisting of 60% sand from Home Depot, 25% fine-grained soil (<0.425 mm), and 15% compost (<0.425 mm). All the percentages are by mass. These percentages were chosen based on the suggestions contained in some of the regional stormwater manuals (PA DEP, 2006; NYSDEC, 2008, 2010). The percentage of compost is a median value based on recommendations found in both older and newer stormwater manuals (NYSDEC, 2008, 2010). Newer stormwater manuals are reducing the recommended percentages of compost, primarily for alleviating the problems of nutrient leaching. An objective of this study is to compare the two media for understanding the influence of compost, especially the effects of compost in addition to the effects of NaCl.
Essentially, the SFM contained relatively inert sand particles in the 4.75 to 0.425 mm size range, in addition to a mixture of fine sand, silt, clay, and compost particles that are smaller than 0.425 mm. After preparing the two SFM, sieve analysis and hydrometer analysis were conducted following ASTM D422 (2010)- Standard Test Method for Particle-Size Analysis of Soils. The SFM samples were sieved on a mechanical shaker using a standard set of three sieves (4.75, 0.425, and 0.075 mm). The portions finer than 0.075 mm were tested using an ASTM 152 H soil hydrometer (ASTM E100-14, 2010). The samples were tested following procedures such as chemical dispersion using sodium hexametaphosphate, mechanical stirring, turning the cylinders up and down, and maintaining constant slurry temperature by immersing the cylinders in a constant-temperature waterbath. Seven hydrometer readings were taken at different times after starting the sedimentation test, and were used to calculate the percent finer (by mass) and particle sizes by applying the Stoke's law based on water temperature and specific gravity of SFM particles.
Figure 1 presents the particle-size distribution (PSD) curves of the two SFM. The two filter media shown in Fig. 1 are termed as clayey silty sand according to the Unified Soil Classification System, USCS. The percentage of clay-sized particles is about 4% to 5% (by mass). Statistical testing (one-way ANOVA, α=0.05) was conducted using the PSD data (“particle size” and “percent finer by mass” values). Results suggest that the two SFM are not significantly different (p=0.962) with regard to the mass proportions of different particle-size ranges. Therefore, the differences in their behavior may be attributed to the media's chemical and other physical characteristics that are primarily due to the clay and compost components.
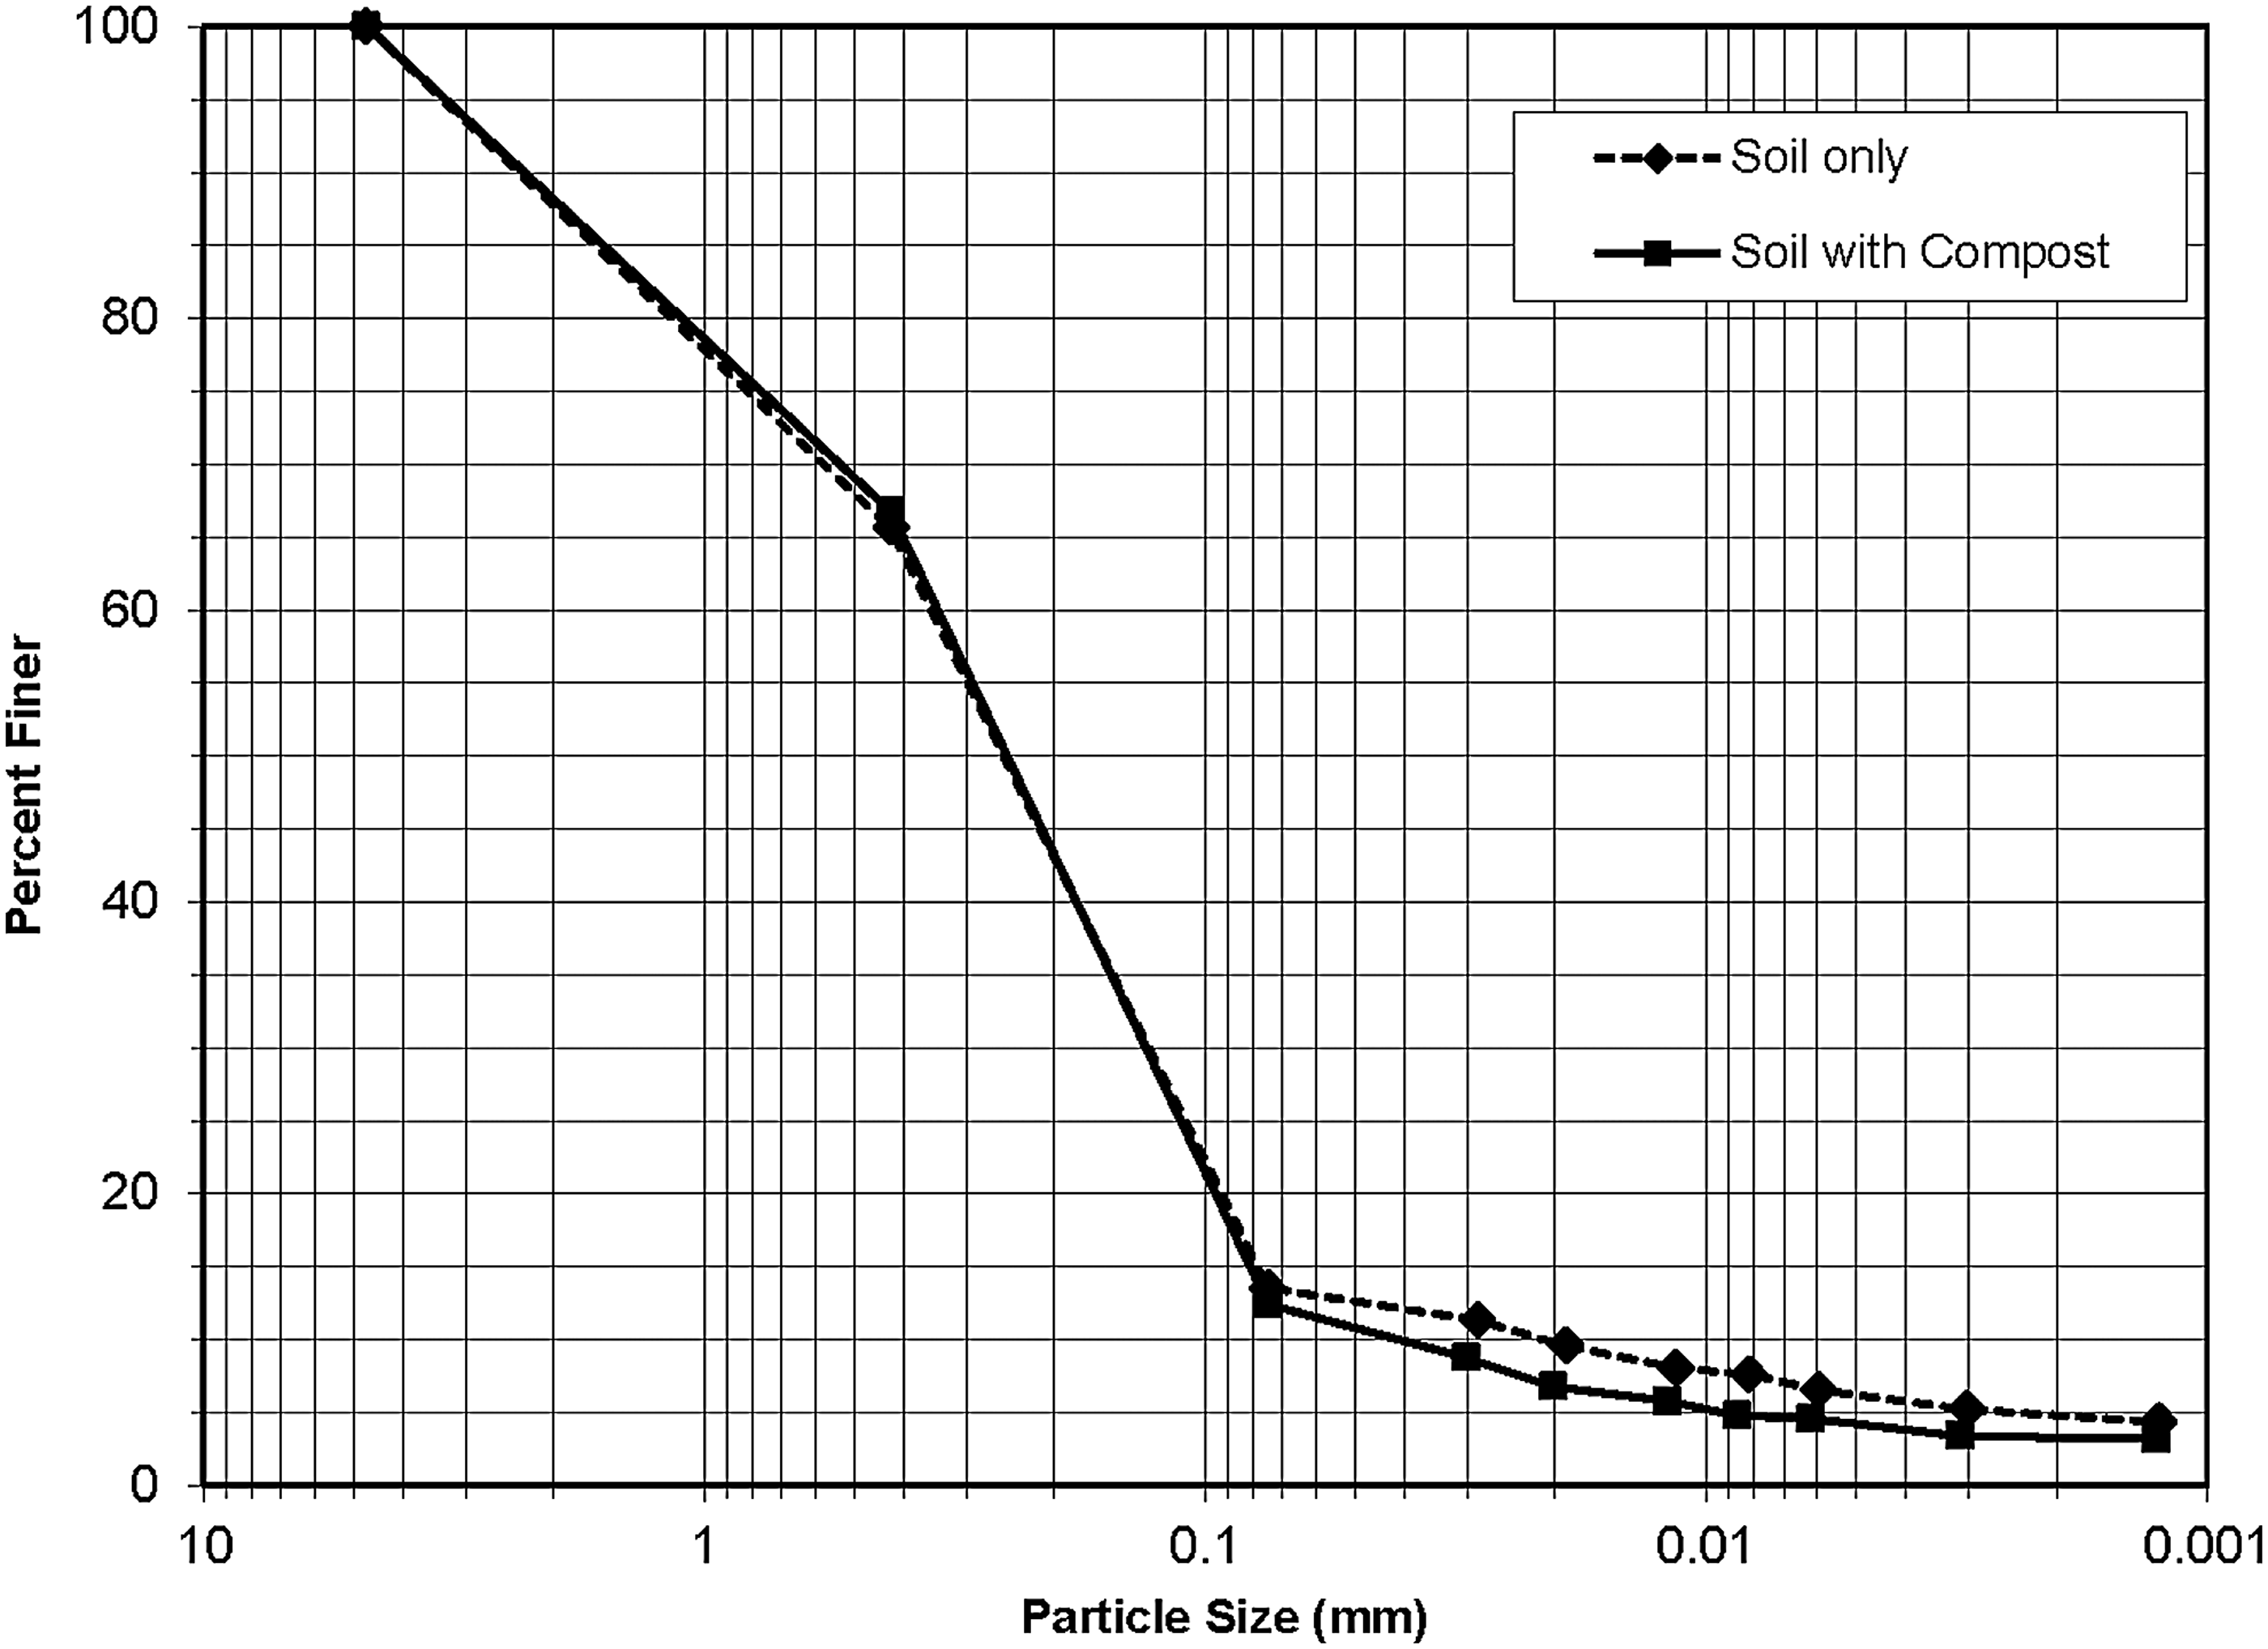
Particle-size distribution of the two stormwater filter media (SFM).
The two SFM described earlier were mixed well with hand and compacted to achieve a uniform mass density using a consistent procedure described in the next paragraph. The poreSD of the two SFM was measured using the MIP technique both before and after the salt application. For this purpose, the two SFM were each compacted in two plastic molds, 20 mm dia.×20 mm length. The plastic molds contained a vertical split for easy separation after drying, but were kept together by tape during compaction and drying. SFM @ 15% moisture content was compacted into each vertically split mold.
We followed a consistent compaction procedure by applying a specific compaction energy of 0.4 J per cm3 of compacted SFM, by dropping a donut-shaped steel mass of 100 g through 8.5 cm height using a guide rod. With the bottom of the guide rod being 1 cm in diameter, the impact pressure was approximately 1.25 N/cm2 on the SFM. Each sample was compacted in three layers with dropping the earlier described mass 10 times for each layer. This procedure is similar to the standard Proctor compaction, ASTM D-698 (2010) applying 0.591 J per cm3 of compacted soil, adopted in engineering construction. We have adopted a smaller specific compaction energy than specified in ASTM D-698 (2010), because bulk density of our SFM needs to be smaller than the typical values in earthen embankments for roads, dams, etc. This procedure was adopted after considering the guidelines in stormwater manuals (PA DEP, 2006; NYSDEC, 2008, 2010) for avoiding over-compaction of SFM. The achieved mass densities were measured in the MIP tests, and are presented in a later section of this article.
Penumadu and Dean (2000) compared the air-drying and freeze-drying methods, and concluded that freeze drying is required for conducting MIP of shrinkable samples (particularly containing highly shrinkable montmorillonite). Our SFM contained less than 5% particles (by mass) that are smaller than clay size (0.002 mm), 12% to 13% “fines” by mass (silt and clay, i.e., particles smaller than 0.075 mm), liquid limit of 45%, and plasticity index of 22%. Therefore, we consider that our SFM do not possess substantial shrinkage properties, and it is not essential to freeze dry them. For MIP before salt application, four samples in plastic molds were air-dried for a week inside the lab. After air-drying, the samples did not apparently experience substantial shrinkage as there were no cracks or gaps between the sample and mold. The split molds were opened, and four samples were shipped to the Micromeritics Instrument Corp, for MIP testing.
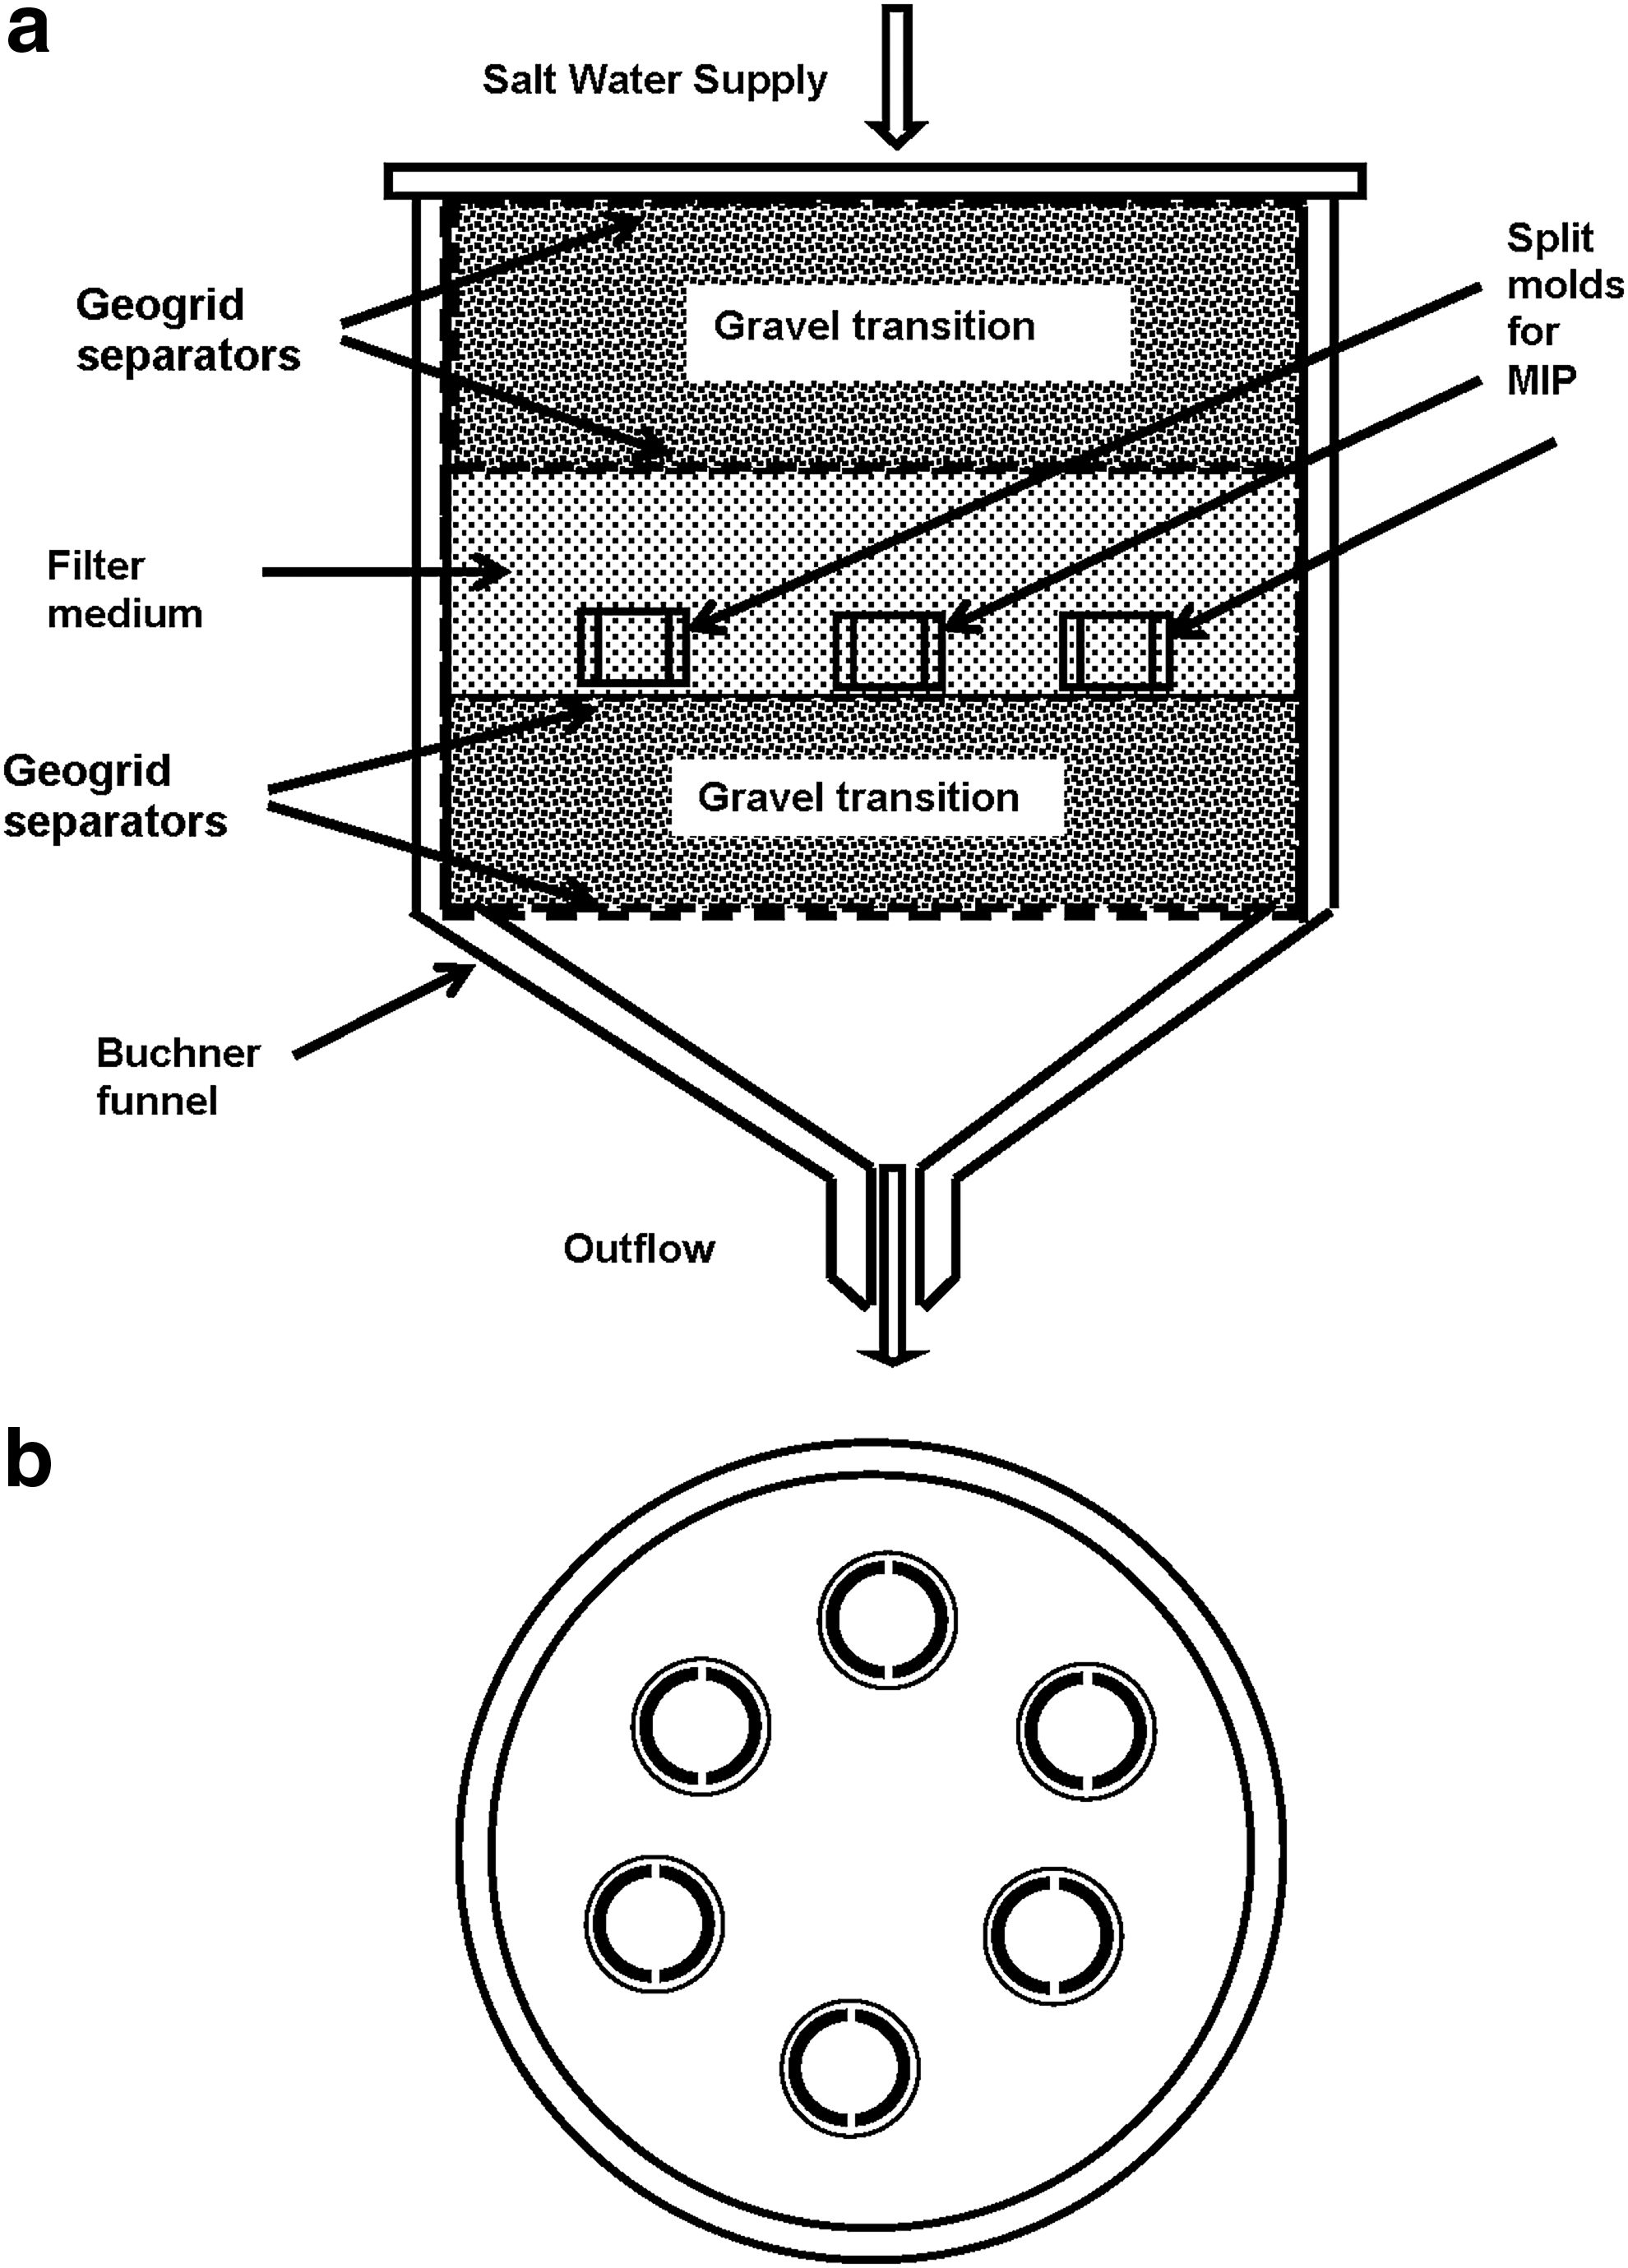
Flow experiments
Flow cells were assembled using Buchner funnels 159 mm in diameter (Fig. 2). One gravel transition layer was placed at the top and bottom of the compacted SFM layer that was 50 mm in thickness. Geogrids, with 0.425 mm openings, were placed between the gravel transition and compacted SFM layers. For measuring poreSD after salt application, six samples of SFM were prepared by compacting them in plastic molds, as described in the previous subsection. As shown in the plan and sectional views of the flow cell, the plastic molds were centrally placed inside the compacted SFM. Six filled-up plastic molds were placed in each of the flow cells. We used six molds in each flow cell, although we intended to conduct MIP tests only on one or two samples (best available after drying, mold opening, and shipping). The reasons for this were the possibilities of shrinkage during drying, breakage during opening of molds, and breakage during transportation. Four flow cells were prepared: two flow cells using “soil only” and two flow cells using “soil with compost” SFM. One flow cell each was tested at both the 150 and 1200 mg/L NaCl. Reagent grade NaCl was purchased from VWR International, LLC, Radnor, PA. Road salt was not used for these experiments, because these tests were designed to look at the impacts of sodium on the media. Actual road salt contains many other compounds, including a potential variety of anti-caking agents. Solutions of the appropriate concentrations were made using NaCl and tap water. Tap water was used because of the volume of water used in these experiments. Based on previous experience, the use of tap water, as opposed to distilled or deionized water, does not affect the results as previous work by the authors has shown that chlorine and chloride do not significantly impact the flow through or the chemical retention of the media. In addition, based on the literature, sodium, a cation, as opposed to chloride, an anion, was the primary focus as that is the cation linked to soil structure changes.
The filter medium in and around the plastic molds has the same gradation and compaction density. Care was taken to ensure the uniformity of compaction and resulting bulk density. Therefore, the SFM in the plastic molds represents the SFM outside the plastic molds regarding the flow rate changes with application of NaCl. After completion of each experiment, the flow cell was carefully opened and the split molds were extricated. The split molds were air-dried for a week and then carefully opened to retrieve the soil samples for shipping to the MIP laboratory. For MIP tests after flow experiments, one or two best available (out of six) samples were chosen from each flow cell, based on their dry mass and external appearance after arrival at the MIP lab.
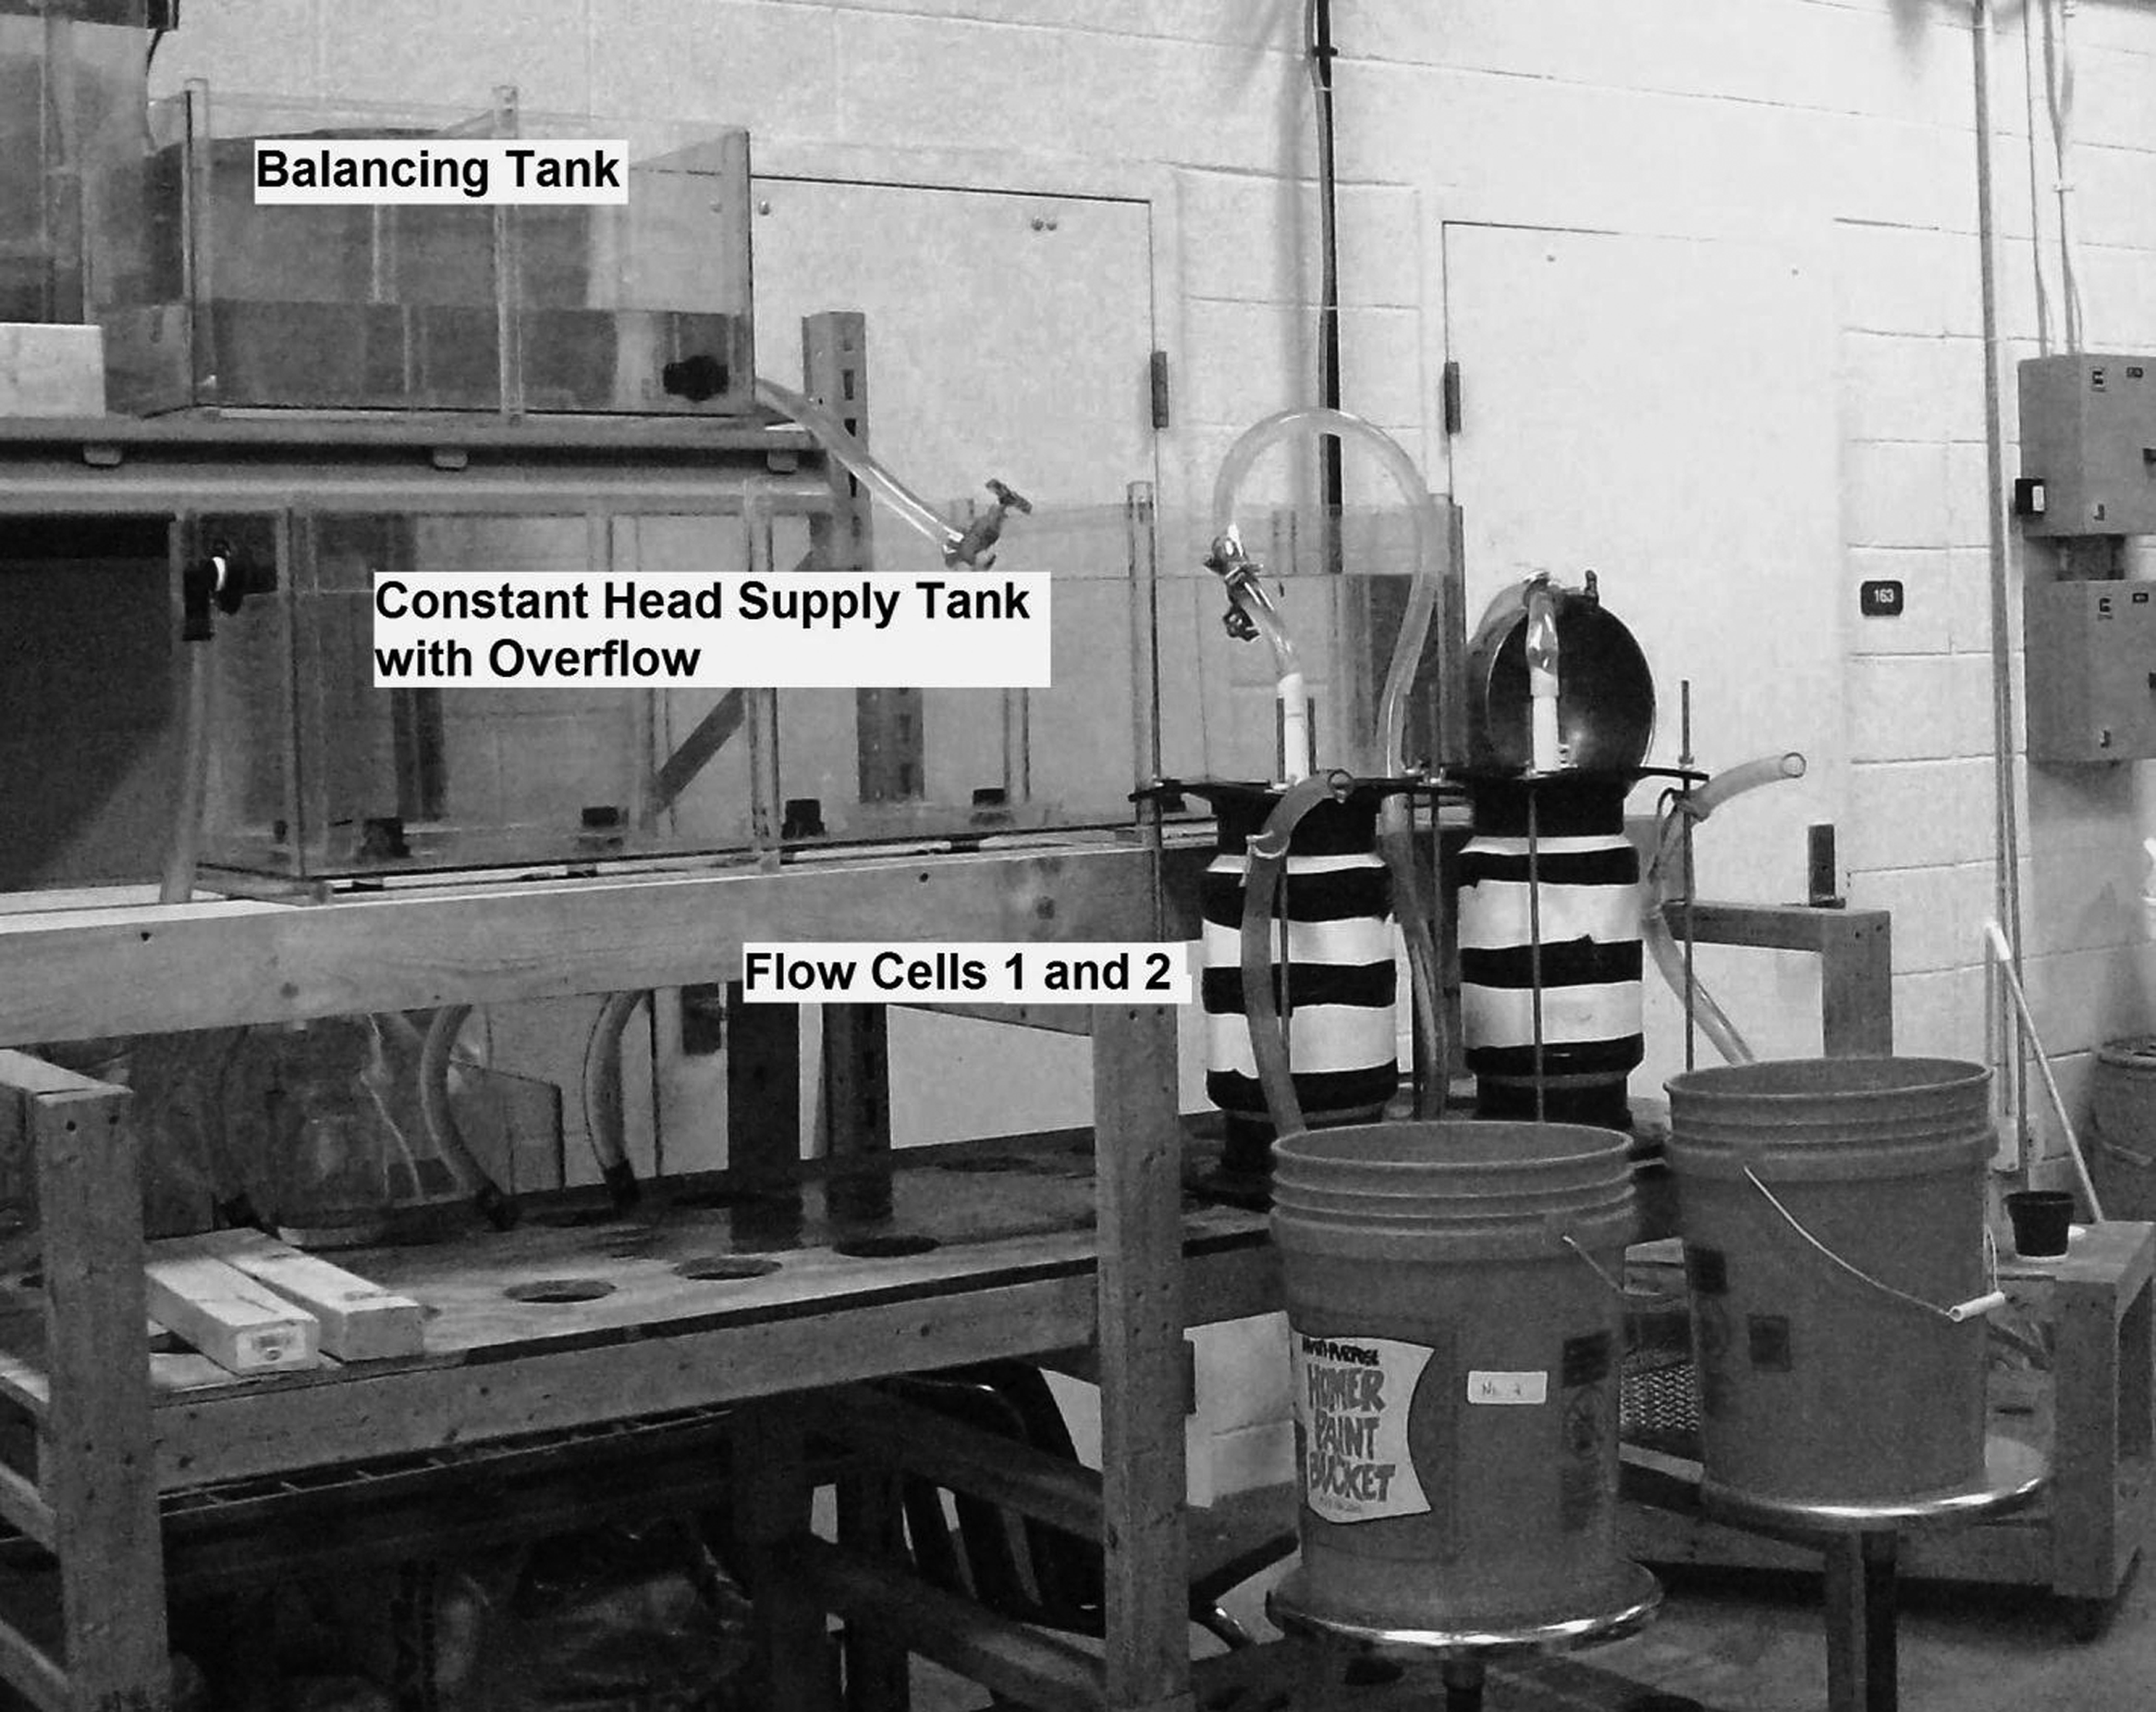
Figure 3 shows a view of the constant head experimental setup. A constant head difference of 300 mm of water was continuously maintained above each flow cell, thus creating a uniform hydraulic gradient of 6 (constant head difference of 300 mm divided by the sample thickness of 50 mm). Two sodium chloride concentrations were used: 150 and 1200 mg/L. These two salt concentrations used represent the lower and upper bound values for chloride in stormwater during periods when NaCl is applied as a deicing salt (Novotny, 1995; Novotny et al., 1998, 2009; Suarez et al., 2006; Nelson et al., 2009). The actual NaCl concentration in runoff depends on salt application procedures, amount of snow fall, and temperature that governs the rate of snow melting. Two different concentrations were selected to investigate the effect of salt concentration on the flow rate. Effluent flow rate and turbidity were measured during these experiments. Turbidity was measured using a Hach Model 2100P Portable Turbidimeter. Influent and effluent conductivity was measured using a Hach Sension™5 Portable Conductivity Meter. Data were collected at different time intervals, as changes were noticeable in flow rate and turbidity. The tests were conducted until the flow rate reached a steady small value—a minimum of 1262 pore volumes to a maximum of 1834 pore volumes.
Constant head-flow experiment with two flow cells containing SFM.
Chemical analysis of filter media
Two SFM were chemically analyzed before and after salt application for determining the behavior of the exchangeable ions in the media and for determining the cation exchange capacity (CEC). The tests were conducted by the Pennsylvania State Agricultural Analytical Laboratory, University Park, PA. The organic matter (OM) was determined by loss on ignition following the method described by Schulte and Hoskins (1995). The calcium, magnesium, phosphorus, potassium, and sodium were determined by the Mehlich 3 extraction followed by inductively coupled plasma analysis as per the method described by Wolf and Beegle (1995). The CEC was determined by the summation method as described by Ross and Ketterings (1995). A full description of the test methods is also available at http://agsci.psu.edu/aasl/soil-testing/soil-methods (Accessed on November 23, 2014)). Three replicates of both SFM were analyzed before and after salt application at 150 mg/L to assess the variability of the media in a single column. The objectives were (1) to confirm whether the hand mixing was acceptable in terms of producing minimal variability in chemical properties before salt application, and (2) to determine after salt application whether the salt appeared to be interacting evenly in the media.
Discussion of Results
Physical and chemical characteristics of the media, before and after salt application, are presented in Tables 1 and 2. Permeability (saturated hydraulic conductivity, k) was calculated using the measured flow rates. Maximum flow rate was observed after a few pore volumes of flow at the beginning of the test (time needed for the flow to stabilize). Table 1 presents the maximum permeability values observed at the beginning and minimum permeability values observed at the ending of the four flow experiments. The percentage reduction of permeability is also presented. These values suggest that “soil only” had larger permeability than “soil with compost.” Furthermore, “soil only” had smaller permeability reduction than “soil with compost.”
Mean (standard deviation).
NTU, nephelometric turbidity units.
Of two replicate samples, either before salt application or after 1200 mg/L application.
Figure 4 shows the influent and effluent conductivity measurements taken during the salt application experiments on both filter media and at both salt concentrations. As expected, the 1200 mg/L salt concentration resulted in a larger conductivity than the 150 mg/L salt concentration. Table 1 presents the mean and standard deviation of the measured conductivity values, which suggest that the influent and effluent conductivities are nearly equal for both SFM and at both NaCl concentrations.
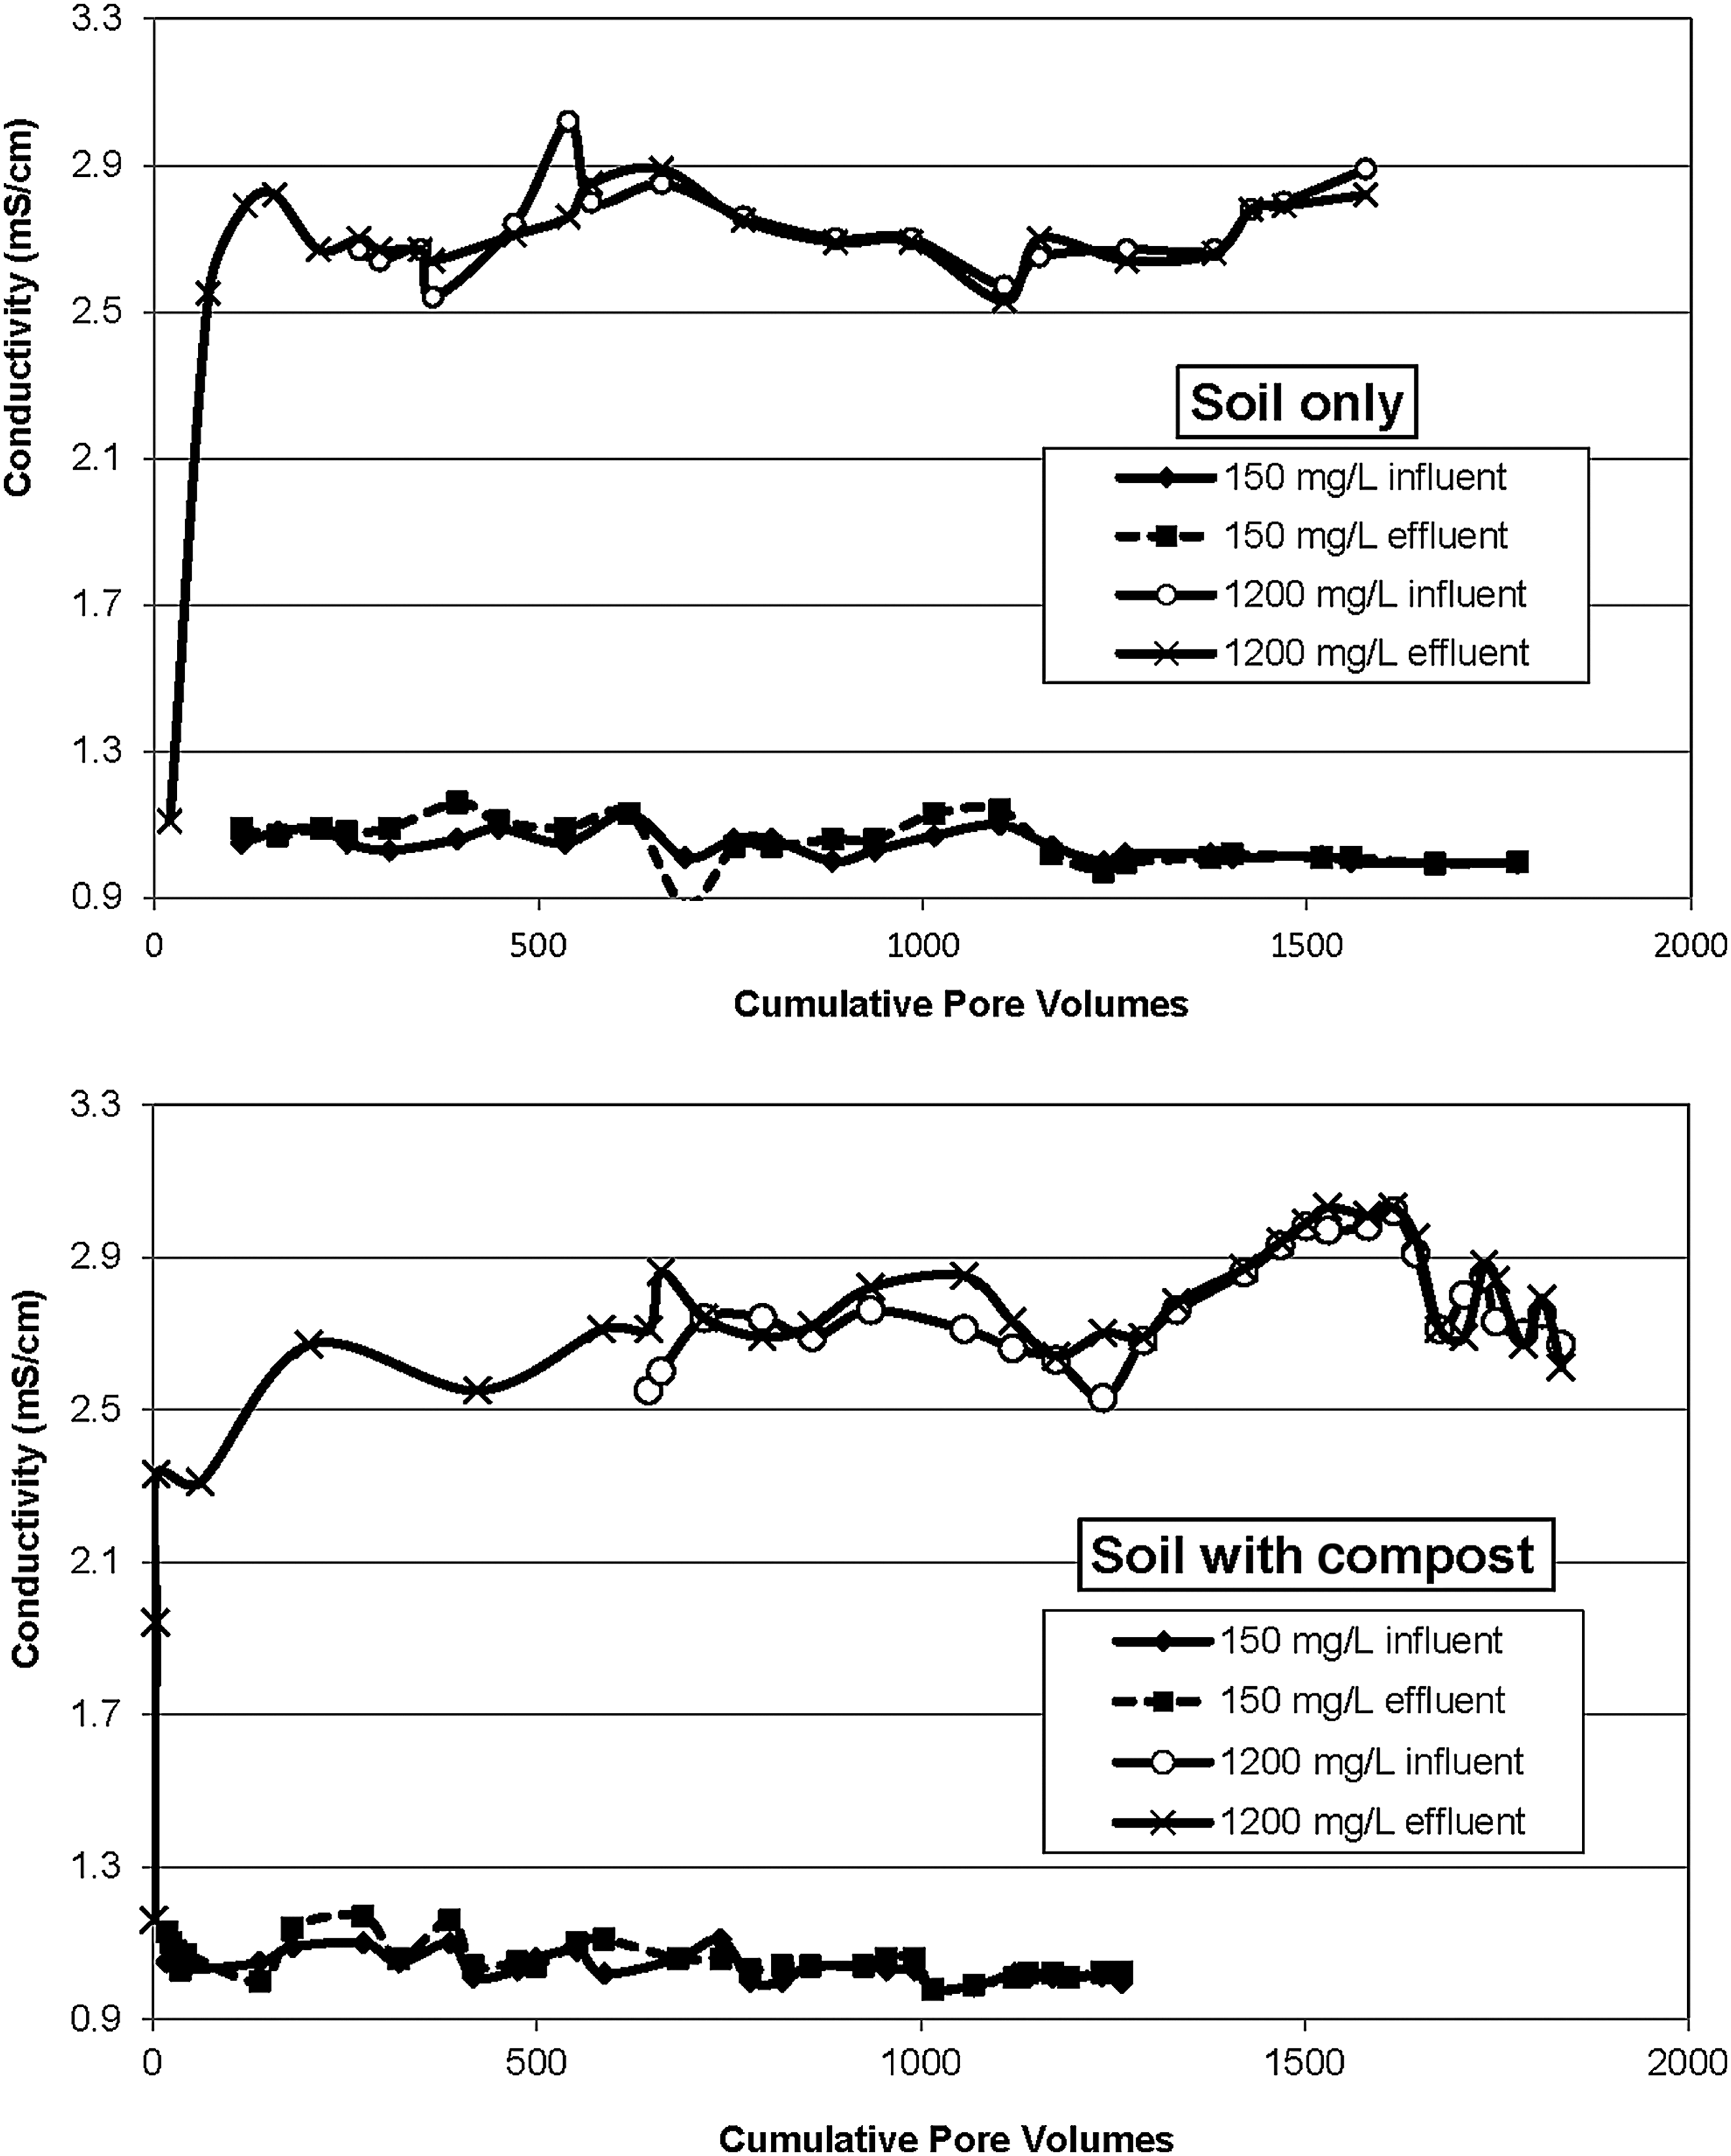
Conductivity values during the four salt loading experiments.
These data suggest that permeation of the salt solution through the SFM did not change the ionic strength, even though the ionic compositions of the influent and effluent would likely be different due to the retention of sodium and potential release of other ions. The lack of change in conductivity over the salt application implies that the ion exchange (Na+ replacing Ca2+ and Mg2+, plus other divalent cations) is electrochemically neutral and that conductivity measurements of permeate alone cannot be used to predict the status of the filter media, in terms of ion exchange exhaustion or destabilization of clay and organic particles.
Table 1 also presents the flow rate reductions and effluent turbidity values observed in the salt application tests. In these constant-head flow tests, the flow rate reached the maximum after a few hundred pore volumes of flow, possibly due to entrapped air or due to settling of the media. Thereafter, both the flow rate and effluent turbidity decreased over several hundred pore volumes of flow and reached a steady minimum. For SFM with soil only, 150 mg/L salt application resulted in 23.7% reduction of permeability, and 1200 mg/L application resulted in 14.5% reduction of permeability. For SFM with soil and compost, 150 mg/L application resulted in 91.7% reduction of permeability, and 1200 mg/L application resulted in 95.6% reduction of permeability. The two-way ANOVA (α=0.05) suggests that the compost addition caused a significant reduction in flow rate (p=0.0045), with no significant difference seen (p=0.96) due to the difference in the two salt concentrations tested.
The effluent nephelometric turbidity units (NTU) values were larger in the case of “soil-compost” medium than in the case of “soil only” medium. This is probably due to the greater loss of fines from compost or due to the color of compost. This could be also be due to compost containing more particles smaller than 0.00125 mm (the smallest size in our testing with testing soil hydrometer) and/or due to the pore structure of soil compost, which allowed more erosion and washout. The effluent turbidity reduced as flow rate reduced either due to the reduction in percent of fines available for washout and/or by internal erosion that depends on seepage velocity. One-way ANOVA (α=0.05) of the results suggests that the compost addition caused a significant difference in effluent turbidity, for 150 mg/L salt (p=0.0007) and for 1200 mg/L salt (p=6E-05). The washout of fines should theoretically make the SFM more porous and should have increased the flow rate; however, the flow rate decreased. The flow rate reduction could have been due to clogging of pore throats by re-deposition of internally eroded particles. The mechanism of SFM clogging is discussed in greater detail in the Theoretical Analysis section. It should be noted that internal erosion and re-deposition or washout of eroded particles are likely depending on flow velocity, inter-particle bonding, and probability of particle travel paths meeting a pore throat.
In the chemical analysis results, except for the organic matter (OM) and magnesium (Mg), other parametric data passed the Shapiro–Wilk normality test (p=0.05). For the OM and Mg, an ANOVA based on ranks was performed. The two-way ANOVA tested for the effect of larger versus smaller salt concentration, the inclusion or lack of compost in the media, and the interaction of the two factors. The results showed that salt application caused significant differences in the chemistry of both types of the SFM.
Table 1 presents mean and standard deviation values of chemical analysis results. These values were based on all the data for both SFM presalt-application and then separately for SFM after salt-application at both 150 and 1200 mg/L. The OM reduced substantially for both the SFM and for both salt concentrations as the flow washed out some OM. The sodium concentration increased substantially for both the SFM and for both salt concentrations as sodium was retained by the SFM and other ions were washed out. Cation exchange capacity (summation of Ca, Mg, and K) also reduced due to salt application for both the SFM and for both salt concentrations.
Theoretical Analysis
Permeability reduction could have been due to a combination of physical changes (altered pore structure due to flocculation, dispersion, and blocking of pore throats by transported particles), chemical changes (increased diffuse double-layer [DDL] thickness due to ion-exchange processes), and biological changes (formation or destruction of microorganisms, especially the development of biofilms coating the pores).
Physical changes of the pore structure
Pore structure was modeled by Garcia-Bengochea et al. (1979) considering the pore space as a bundle of capillary tubes. Using Hagen–Poiseuille equation for laminar flow through cylindrical tubes and Darcy's law, they presented an equation to estimate permeability:
where γw=unit weight of pore fluid (water), μ is the dynamic viscosity of pore fluid (water), n is porosity, f(ri) is the frequency of occurrence of pore of ith radius, and ri is ith pore radius.
Washburn (1921) described the capillary flow dynamics that form the basis for MIP. Idealizing the pores as cylinders of a characteristic length, the pore diameter can be related to the applied pressure by Washburn equation:
where di is pore diameter, γ is the mercury's surface tension, θ is the contact angle between mercury and soil particles, and Pi is the pressure applied. Winslow (1978) conducted MIP tests and capillary condensation tests on porous alumina, and concluded that MIP technique was valid even at the high pressures that were used to measure tiny pores. Olson (1987) reported the results of MIP tests conducted on soils and described simple procedures for measuring pore sizes outside the range of MIP pressures. In recent years, Giesche (2006) presented a practical overview of MIP in the light of pore-network analysis tools. It is worth noting that Equation (4) is limited by the assumption of cylindrical pores. However, in soil structure the pore throat (or neck) being smaller controls the pressure required for the mercury to intrude. Several other factors such as laboratory sample drying method (air drying, or oven drying, or freeze drying), soil compaction method, and agricultural practices (tilling) are found to have altered soil structure and yielded different MIP results (Penumadu and Dean, 2000; Pagliai et al., 2004; Wairiu and Lal, 2006; Li and Zhang, 2009).
It needs to be noted here that MIP determines the largest entrance to a pore, but not the actual “pore size.” In an excellent practical overview of MIP, Giesche (2006) discussed the potential side-effects of sample compression during MIP testing. He concluded that loosely packed powders and soft or highly porous materials get compressed substantially during the initial stages of MIP, even before mercury enters the largest pore size. Soil samples tested in our study do not fall in any of these categories, and compressibility effects are considered minimal. Giesche (2006) also concluded that compressibility effects cancel out for the relative comparisons of similar materials, and thus, it is not quite as critical to have perfectly correct values in studies of similar materials. This is true for comparison of pore-size data of our samples before and after application of NaCl.
Despite the limitations, MIP provides an experimental means to measure pore structure as evident from the publication and general acceptance of ASTM D4404–D4410 (2010) by the American Society for Testing Materials. Tanaka et al. (2003) studied the pore structures of several naturally deposited or artificially mixed clayey soils using MIP technique, and discussed the applicability of MIP results for understanding the permeability characteristics of clayey soils. The soils studied by Tanaka et al. (2003) are somewhat similar to the SFM used here.
In this study, the MIP was conducted on two replicates of the two SFM before salt application and after salt application at 1200 mg/L NaCl. Due to limited funding, MIP was conducted only one sample of the two SFM after salt application at 150 mg/L NaCl. The poreSD of “soil only” media, before and after salt application, are shown in Fig. 5. Samples S1C and S1E are the two replicates before salt application, S3A is after 150 mg/L salt application, and S5a and S5d are the two replicates after 1200 mg/L salt application. Comparing the curves in Fig. 5 “soil only” media, it can be seen that pore sizes increased over the entire range for the 150 mg/L salt application. However, for the 1200 mg/L salt application, some pore sizes increased though others decreased.

Pore-size distribution before and after salt loading–soil only.
The poreSD of “soil with compost” media, before and after flow experiments, are shown in Fig. 6. Samples S2A and S2F are the two replicates before flow experiments, S4A is after 150 mg/L flow experiment, and S6a and S6b are the two replicates after 1200 mg/L flow experiment. Comparing the curves in Fig. 6, it can be seen that pore sizes increased over the entire range for both 150 and 1200 mg/L flow experiments on “soil with compost” media. Table 2 presents MIP measured values of dry mass density, particle specific gravity, porosity, and median pore size, before and after flow experiments. The average dry mass density of “soil only” before flow experiments was 1.98 g/cm3, which reduced to 1.95 g/cm3 after 150 mg/L flow experiment, and reduced to 1.915 g/cm3 after 1200 mg/L flow experiment. The average dry mass density of “soil with compost” before flow experiments was 1.655 g/cm3, which reduced to 1.43 g/cm3 after 150 mg/L flow experiment, and reduced to 1.53 g/cm3 after 1200 mg/L flow experiment. The average particle specific gravity of “soil only” is about 2.652 and that of “soil with compost” was 2.52.
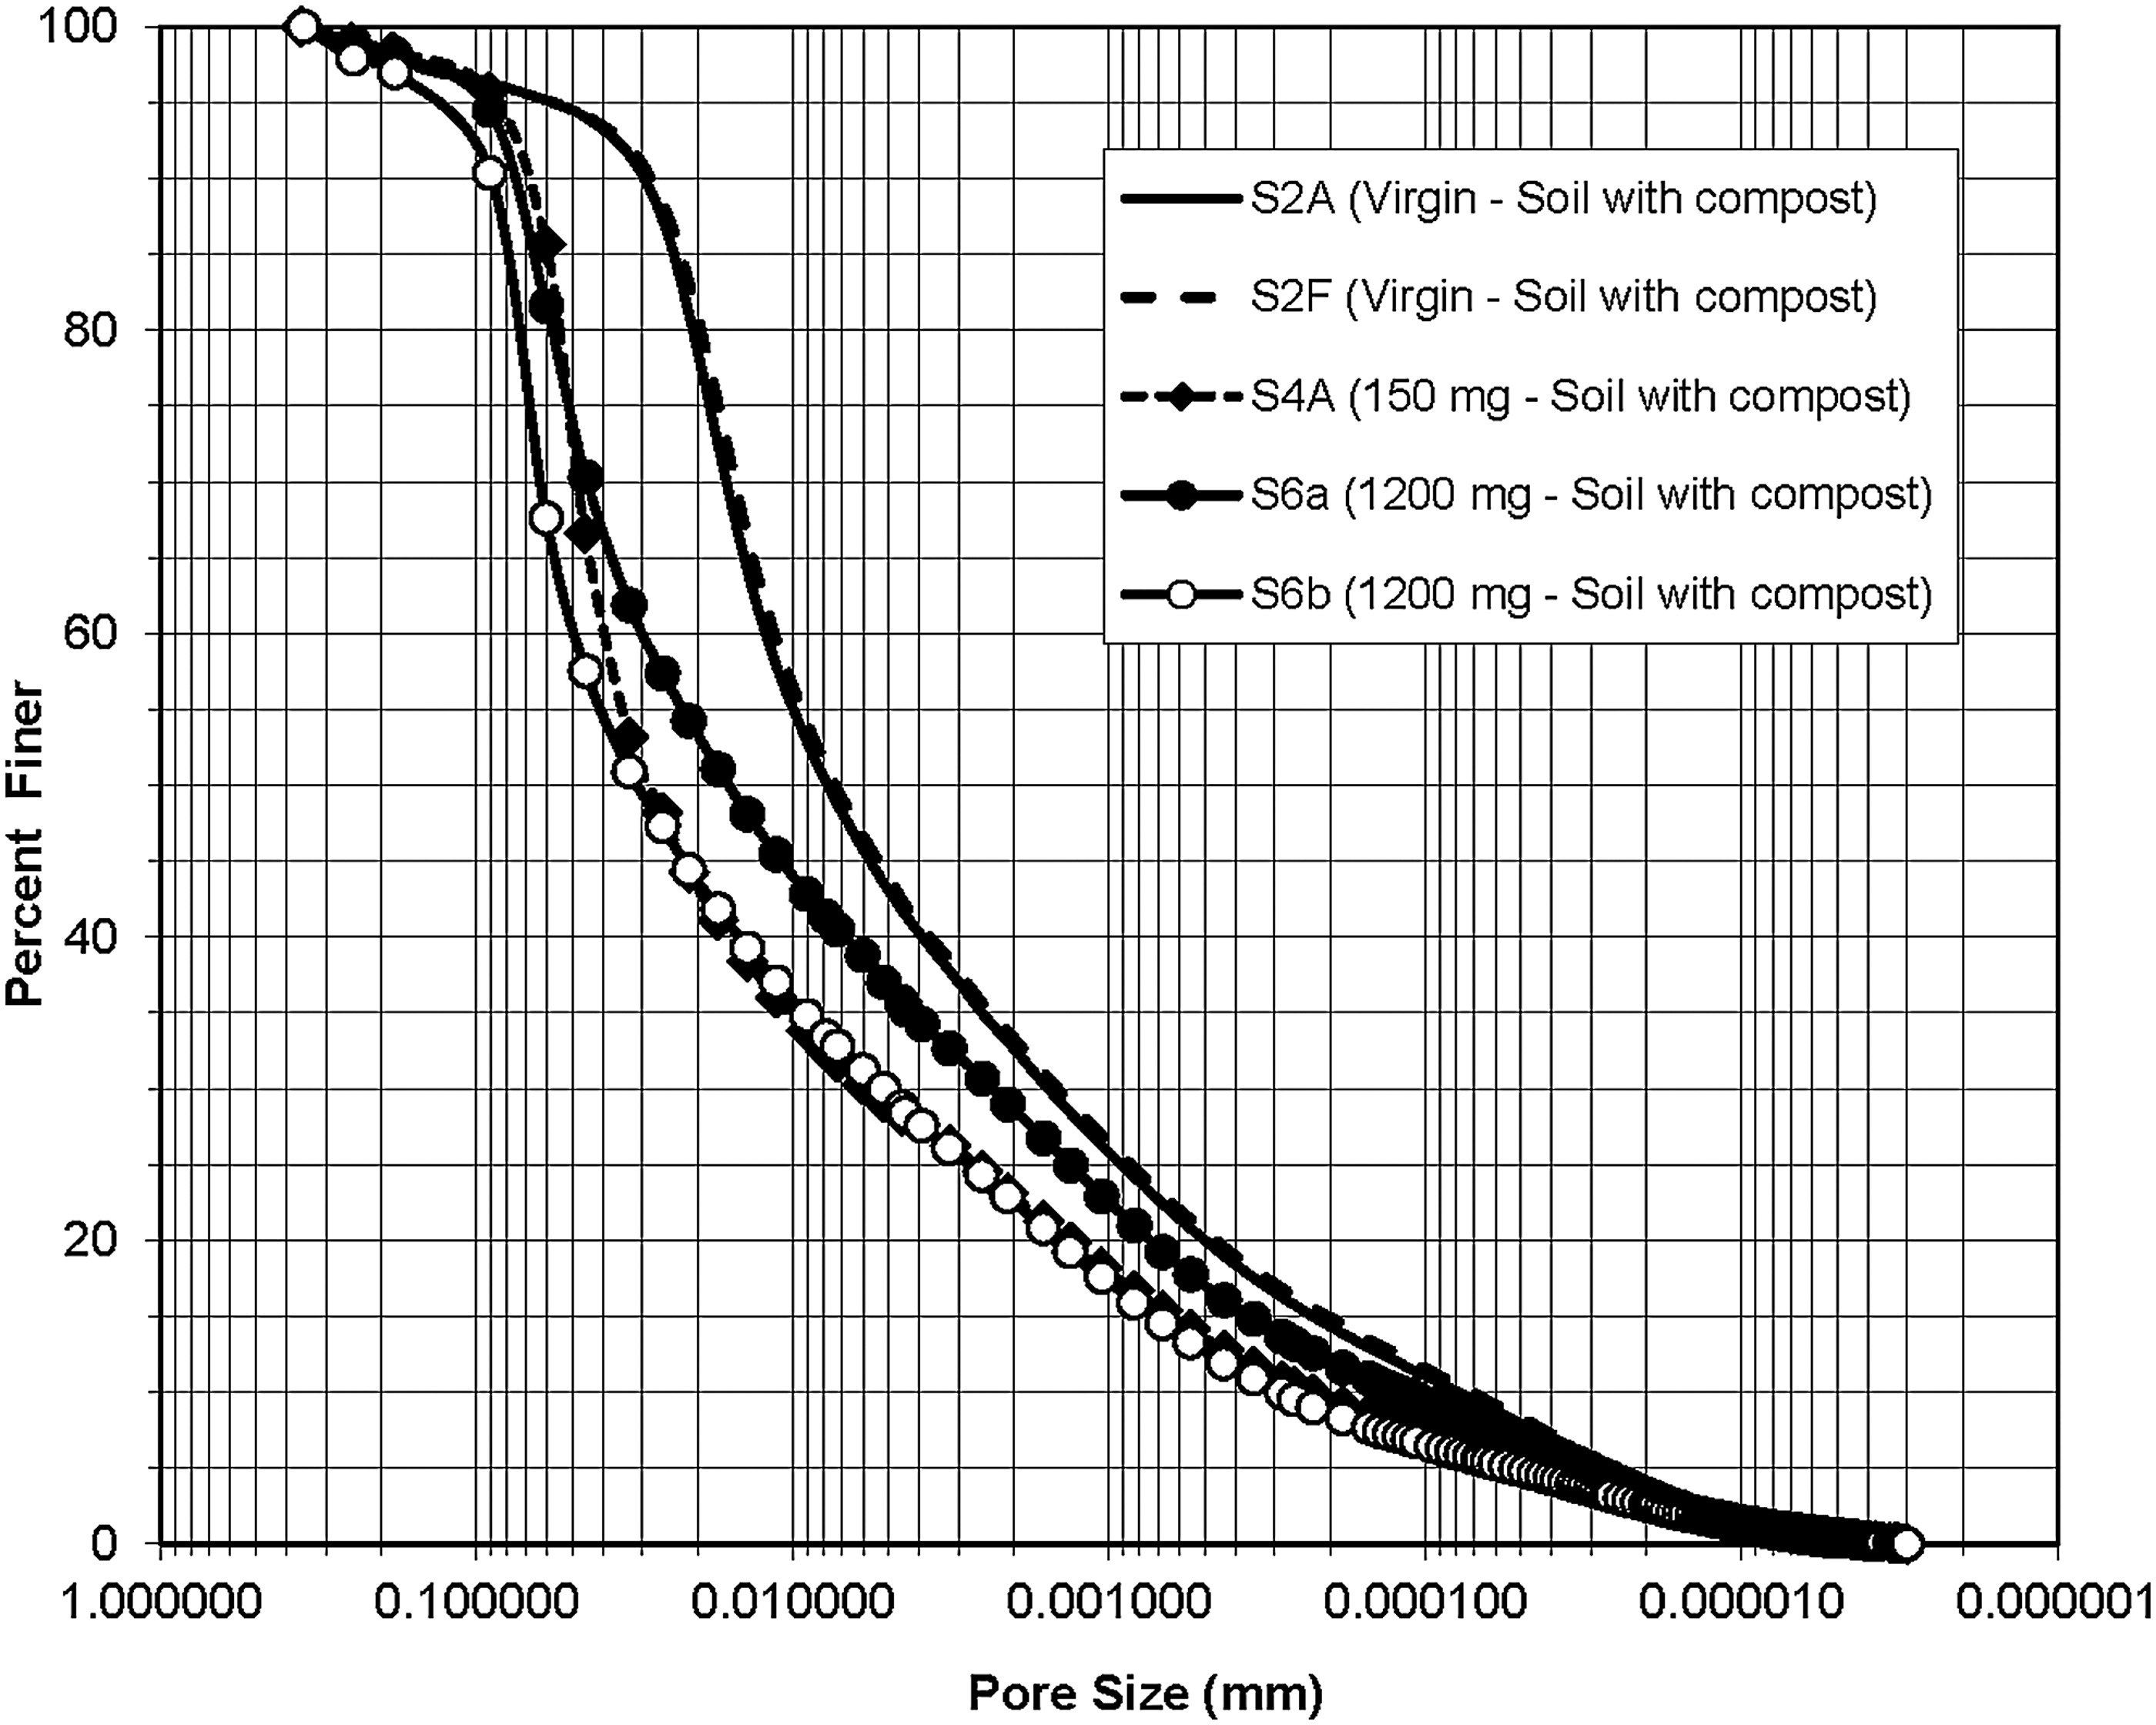
Pore-size distribution before and after salt loading–soil with compost.
It can be noted from Table 2 that both porosity and median pore size were smaller for “soil only” SFM compared with “soil with compost” SFM. Flow experiments increased porosity for both SFM. For “soil only” SFM, 150 mg/L flow experiment resulted in 26.1% porosity, and 1200 mg/L flow experiment resulted in 27.7% average porosity. They indicate a trend of increasing porosity with flow experiments, and also with an increase in concentration. For “soil with compost” SFM, 150 mg/L flow experiment resulted in 43.8% porosity, and 1200 mg/L flow experiment resulted in 40.1% average porosity. They indicate a trend of increasing porosity with flow experiments; however, no trend was apparent with an increase in concentration.
Flow experiments resulted in increased median pore sizes, except for “soil only” SFM after 1200 mg/L salt application. For “soil only” SFM, 150 mg/L flow experiment resulted in median pore size of 0.00262 mm, and 1200 mg/L flow experiment resulted in median pore size of 0.00123 mm. The median pore size increased after 150 mg/L flow experiment, but surprisingly reduced after 1200 mg/L flow experiment. For “soil with compost” SFM, 150 mg/L flow experiment resulted in median pore size of 0.02838 mm, and 1200 mg/L flow experiment resulted in median pore size of 0.02348 mm (average). They indicate a trend of increasing median pore size after flow experiments; however, no trend was apparent with an increase in salt concentration.
Generally, MIP results suggest that salt application increased both porosity and pore sizes, even though it is counterintuitive because salt application caused a decrease of flow rate. This will be further examined in the following subsection.
Electrokinetic phenomena and effects on pore structure and flow
Suarez et al. (2008) investigated the reduction of infiltration rate into cropped soils and concluded that an increase in the sodium adsorption ratio (SAR) caused changes in pore structure, eventually reducing the infiltration capacity. The SAR is calculated as follows:
where the concentrations are expressed in meq.L−1. The soil chemistry results were used to calculate the initial and final SARs for each media, and are shown in Table 1. Adsorption of sodium and release of calcium and magnesium (due to salt application) resulted in a substantial increase of the sodium adsorption ratio. Suarez et al. (2008) suggested that an increase of SARs into the range of 3 to 15 could cause destabilization of pore structure and substantial reduction of permeability. However, there is no mechanistic explanation of this phenomenon.
More recently, Rengasamy and Marchuk (2011) defined the cation ratio of structural stability of soil solutions (CROSSss) using the following equation:
where the concentrations are expressed in meqL−1. The soil chemistry results were used to calculate the initial and final values of CROSSss for each media, and are shown in Table 1. Comparison of SAR and CROSSss values indicates that they fall in the same range and follow the same trends. However, they are not sufficient to understand the clogging mechanism of SFM by NaCl as a deicing salt.
Marchuk et al. (2012) used x-ray computed microtomography (CMT) and studied the permeability reductions due to permeation with water containing different cations, namely, Na, K, Mg, or Ca. They concluded that CROSS serves as a better indicator of pore structure stability than SAR, particularly for soils containing Ca, Mg, and K, in addition to Na. Their study also discussed the ratio of active porosity to total porosity (RAPTP), pore connectivity (PC), NTU as one measure of clay dispersion, and zeta potential (ZP) as another measure of clay dispersion. Experimental determination of RAPTP and PC was possibly due to the use of x-ray CMT. Their study concluded that Na and K have reduced the RAPTP below the control value (using pure water), and Ca and Mg increase reduced the RAPTP below the control value. Sodium (Na) resulted in the higher ZP indicating more negative charge of dispersed particles than the control, while K, Mg, and Ca resulted in smaller ZP than the control. Na and K resulted in larger NTU than the control while Mg and Ca resulted in smaller turbidity than the control. Overall, they concluded that very fine particles dispersed by sodium block the pore throats and reduce the pore connectivity, thus reducing the active porosity and permeability.
The literature contains several studies that focused on changing thickness of DDL as a basis for flocculation or dispersion and subsequent changes to the pore structure. Evangelou (1998) summarized the effects of ion-exchange processes on either increasing or decreasing the thickness of DDL, and consequent effects of either flocculation or dispersion of the particles. For a colloidal suspension with N ionic species, the fundamental Poisson–Boltzmann equation for the Gouy–Chapman model was expressed by Russel et al. (1989) as follows:
where ψx is the electric potential at any distance x from the charged surface, e is the electron charge, ɛ is the permittivity of the medium, zk is the valence of the kth ions, nbk is the bulk concentration of the kth ions, kB is the Boltzmann constant, and T is the absolute temperature in kelvins.
Russel et al. (1989) have also discussed the difficulties in applying this theory for spherical particles and in calculating the DDL thickness for electrolytes having several cationic species. For a flat surface and an electrolyte with single cationic species (such as NaCl solution), based on a linearized solution of the Equation (5), Evangelou (1998) expressed the inverse of DDL thickness, κ (also known as the Debye–Hückel length) as
where n=number of ion pairs in unit volume of colloidal suspension, and other parameters are as described earlier. Yeung (1992) summarized the DDL equations and presented them in SI units. It needs to be noted here that the Debye–Hückel theory is valid for plates or spheres of infinite surface area adjacent to an infinite body of electrolyte solution, and it is difficult to apply this theory to flow through porous media. Mahanta et al. (2012) have recently studied the difference between linearized and nonlinear solutions of the Poisson–Boltzmann equation. They concluded that the linearized solution significantly overestimates the DDL thickness at small bulk concentrations. Since the Equation (6) can only deal with one type of ions, it cannot be applied for electrolytes with several types of cationic species, such as the pore fluid in our experiments.
In general, the DDL can effectively reduce the pore space available for fluid flow. Mitchell and Soga (2005) presented a summary of the effects of DDL thickness on either flocculation or dispersion of the particles. Figure 7 shows a scanning electron microscopy (SEM) image of a kaolinite sediment, illustrating the flocculation caused by sodium chloride. MIP results suggest that the salt application caused more flocculation (than dispersion) of the tested SFM, resulting in overall enlargement of pores.

Scanning electron microscope (SEM) image of kaolinite clay sediment
Mala et al. (1997), Anandarajah (2003), and Schmitz (2006) have researched the influence of these physical and chemical phenomena on fluid flow. Schmitz (2006) concluded that changes in DDL thickness and external stress conditions together can cause either collapse or expansion of the pore structure, counterintuitively resulting in either an increase or a decrease of the flow rate, although for similar chemical conditions. The media in our experiments was not subjected to any external stresses. Therefore, pore collapse due to consolidation compression can be ruled out. It needs to be noted that these phenomena are also dependent not only on the ionic strength but also on the combination of different ions in the electrolyte, and different properties of the minerals and organic matter interacting with the ions.
Seaman et al. (2007) conducted a field study of permeability reduction due to generation of colloids that clog soils. While pumping in through an injection well, they collected water samples at different levels from several observation wells. Laboratory analysis of particles in water samples revealed spatiotemporal variability in colloid dispersion that suggested the reasons for overall permeability reduction. They concluded that dispersed particles can block pore throats and reduce permeability.
In general, the DDL concept is useful for understanding the flocculation and dispersion phenomena in some ideal cases, but practically difficult to apply in complicated cases as in our experimental study. Application of Equation (1), with pore radii corrected for changed DDL thickness, is very challenging due to the difficulties in estimating the DDL thickness. In addition, the change in DDL thickness may not be substantial relative to the pore radius. Both flocculation and dispersion may occur under certain conditions that could result in enlargement of pores with simultaneous blocking of pore throats, thus reducing the pore connectivity and active porosity. For studying such complex changes in pore structure, X-ray CMT appears to be more appropriate than MIP (Marchuk et al., 2012).
Biological phenomena and their effects on pore structure and flow
Pintelon et al. (2012) used magnetic resonance imaging (MRI) for obtaining the pore structure of a pack of spherical beads, and then numerically simulated the flow using the Lattice Boltzmann Method (LBM). They have concluded that the growth of biofilms depends on biological factors as well as on viscous shear stresses that could erode the biofilms. Overall, the permeability of a porous medium depends on the permeability of biofilms relative to the free space. They also concluded that X-ray CMT appears to be more appropriate than MRI.
Bottero et al. (2013) developed a biofilm model and studied the dynamics of preferential flow paths in porous media. They concluded that clogging or unclogging of the porous media depends on the growth of biofilms, which, in turn, depends on factors such as nutrient supply and viscous shear forces. Our SFM with compost contained much more soluble organic matter than our SFM without compost. Nutrient supply from soluble OM could have contributed to more biological clogging of SFM with compost, compared with SFM without compost.
Explanation of flow rate reductions
Given the theoretical considerations discussed in the previous three subsections, the data available in this study suggest that salt application caused flocculation of particles and enlargement of pore space, while the flow rate reduced. Though this is a counterintuitive result, it can be explained in terms of reduction in active porosity due to blocking of pore throats by dispersed clay particles and biofilms. We have analyzed our pore-size distribution data and the observed flow rates (permeability) by rewriting the Equation (2) as follows:
where C is a correction factor that accounts for reduction in active porosity due to salt application, and other factors are same as in Equation (2). In our numerical analysis, we considered that C=1, before salt application. Using the MIP data and the permeability values observed in the four cases, the C values for the four cases were back calculated using Equation (7), and are shown in the last row of Table 1. From a value of 1 before salt application, the C values for the “soil only” went down to 0.890 for 150 mg/L, and 0.900 for 1200 mg/L. Corresponding C values for the “soil with compost” were 0.095 and 0.122, respectively. Considerable difference between these two sets of C values (“0.095 and 0.122” vs. “0.890 and 0.900”) explains the considerable differences observed in the permeability reductions of “soil with compost” and “soil only” SFM. These numbers suggest that the presence of compost resulted in a considerable reduction of permeability, whereas there was little effect in the absence of compost. The small differences between the two numbers in each of these two sets (0.095 and 0.122 for “soil with compost,” and 0.890 and 0.900 for “soil only”) suggest that difference in NaCl concentrations (150 mg/L vs. 1200 mg/L) did not considerably influence permeability reductions of both SFM.
In this study, we have used a specific concentration of NaCl in each experiment and allowed salt application at a steady rate until the flow rates reached steady minimum values, indicating clogging. The tests were also conducted indoors where the room temperatures were nearly constant (about 70oF). In bioretention facilities, the salt concentration and flow rate are expected to fluctuate in a very wide range over time, because of differences in snow fall and the rate of snow melting. Wide fluctuations of outdoor temperatures can be expected to influence the viscosity of water, and several other physical, chemical, and biological processes. Therefore, these fluctuations need to be considered in evaluating the long-term performance of SFM in bioretention facilities. This study suggests that the differences in the adverse effects caused by 150 and 1200 mg/L salt applications are only minimal. Therefore, personnel should avoid piling up salt-laden snow near the bioretention facilities, because snow melt could easily have salt concentrations of about 150 mg/L.
Conclusions
The two SFM tested were identical in particle-size distribution, but were dissimilar in proportion of clay and organic matter. These negatively charged surfaces exchanged cations with sodium in the influent, adsorbing sodium and releasing several other cations. Overall, the cation-exchange phenomena resulted in flocculation of particles and enlargement of pores, as evident in the MIP results. It also resulted in dispersion of clay particles and fine soluble organic particles that could have migrated and blocked the pore throats. Growth of microorganisms depended on supply of nutrients and air, further contributing to the blocking of pore throats. Due to these combined physical, chemical, and biological phenomena, the flow rate gradually reduced with salt application, notwithstanding the MIP results showing some increase in pore sizes. The reduction of flow rate was substantially larger for “soil with compost” media compared with the “soil only” media. This is attributable to the larger percentage of organic matter (by mass) in the “soil with compost” media. X-ray CMT appears to be a more appropriate technique for further studies of this research topic.
Footnotes
Acknowledgments
The authors gratefully acknowledge the financial support of Pennsylvania State University, Harrisburg, through its Research Council Grant. Two undergraduate students, Michael Fletchko and Vladimir Grinevich, contributed to this study by conducting the experiments and asking insightful questions.
Author Disclosure Statement
No competing financial interests exist.