
Abstract
Abstract
Rapid expansion of hydraulic fracturing operations for natural gas and oil production can impact water quality. Water that flows back to the surface as part of the hydraulic fracturing process and during well production can contain trace elements, including regulated metals and metalloids, mobilized by interactions of the fracturing fluid with the formation. The rate and extent of mobilization depend on the geochemistry of the formation, the composition of the fracturing fluid, and the contact time. Laboratory experiments detailed here examined the influence of water chemistry on element mobilization from core samples taken from the Eagle Ford Formation, which is currently producing natural gas from hydraulically fractured zones. Fluid properties were varied with regard to pH, oxidant level, and solid:water ratio. Release of elements (Ca, Mg, Fe, Ba, As) from the Eagle Ford samples strongly depended on pH, which in turn was primarily controlled by calcite dissolution. Presence of oxygen and the addition of H2O2 led to pyrite oxidation and resulted in an elevated amount of sulfate. Barium concentrations were largely controlled by the amount of sulfate present through solubility equilibrium of barite that formed as a secondary phase. The effect of increasing solid:water ratio on the extent of mobilization varied widely for different elements. Taken together, these findings demonstrate the need to understand both the aqueous and geochemistries of a hydraulically fractured formation with regard to elemental mobilization in produced and flowback waters.
Introduction
R
Hydraulic fracturing (also referred to as “fracking”) is typically done by pumping a mixture of water, proppant, and chemical additives into the well bore, under pressure, to create and propagate fractures in the surrounding formation (Ely, 1985). The proppant (fine sand or ceramic grains) is added to hold resulting pores and channels open in the formation thus allowing for subsequent oil and gas extraction. A typical fracturing job can require 2–5 million gallons (7,000–18,000 m3) of water (Hagemeier and Hutt, 2009; Gregory et al., 2011). After the fracturing process, some of the fracturing fluid returns to the surface and is referred to as flowback. As an example, for hydraulically fractured wells in Pennsylvania, 9–53% of the injected fracturing fluid is recovered as flowback (Vidic et al., 2013). Flowback contains the original or degraded additives as well as constituents mobilized from the formation. These can include a number of metals, metalloids, dissolved organics, and hydrocarbons (Benko and Drewes, 2008; Gregory et al., 2011). Flowback and produced waters can have total dissolved solids (TDS) several times higher than those of seawater (Haluszczak et al., 2013), and recent management practices of waters from the Marcellus formation have had a discernible imprint on surface water compositions such as elevated levels of As, Sr, Se, and Br concentrations compared to background observations (Wilson and VanBriesen, 2012; Ferrar et al., 2013; Fontenot et al., 2013; Olmstead et al., 2013; Warner et al., 2013; Wilson and Van Briesen, 2013). TDS values of flowback and produced waters from the Eagle Ford, the focus of this study, have been reported in the range of 40,346–144,952 mg/L (Blondes et al., 2014). While there is some published data of regulated trace elements in flowback and produced waters (Hayes, 2009; Chapman et al., 2012; Haluszczak et al., 2013), the overall information about metal and metalloid concentrations mobilized from formations and the factors affecting the mobilization is limited.
Approximately 750 chemicals were listed as additives for hydraulic fracturing in a 2011 report to the United States Congress (Waxman et al., 2011). However, most fluids contain less than 20 total additives (U.S. EPA, 2004). Additives can comprise 0.5–3% (wt/wt) of the fluid and include surfactants, scale inhibitors, cosolvents, and acids (King, 2012). The compositions of hydraulic fracturing fluids are often tailored to specific formations and can be varied over different stages of well development. Despite this, there are common fluid properties and additive classes that can be considered across a spectrum of well and formation types (U.S. EPA, 2011).
Solid–water interactions have the potential to mobilize elements through a variety of pathways that depend on the formation composition and fracturing fluid chemistry. Dissolution of acid-soluble minerals may be a release pathway, as strong acids (e.g., hydrochloric acid [HCl]) are often used to initiate fractures and are usually the single largest liquid additive in a fracturing fluid (Arthur et al., 2008; Gregory et al., 2011). Desorption of metals from host minerals can occur due to changes in pH and through the introduction of complexing agents. EDTA and citrate, both used for iron control, form strong complexes with several metals and metalloids, such as Pb(II), Cu(II), and Co(II), which can increase their mobility (Huang et al., 1995). Furthermore, dissolved oxygen and other oxidative fluid additives (e.g., ammonium persulfate, magnesium peroxide), used to promote the breakdown of gel polymers (Vidic et al., 2013), may drive significant redox-sensitive geochemical reactions. For example, oxidation of reduced forms of uranium and chromium typically increases their solubility (Rai et al., 1989; Wu et al., 2007).
The objectives of this study were to examine the impact of aqueous chemistry on the mobilization of metals and to investigate the dominant mobilization pathways during solid–water interactions involving samples from hydraulically fractured formations. The study used samples from the Eagle Ford Formation, a highly productive oil and natural gas play in south Texas. Experiments on the release of elements as a function of pH, oxidant level, and solid:water ratio sought to advance the understanding of factors controlling the behavior of metals and metalloids during water–rock interactions. Such information is critical for managing potential aqueous waste streams that contain elements mobilized from the fractured rock.
Experiment Protocols
Materials
All chemicals were used as received from the vendors without further treatment. Solutions were prepared with ultrapure water (resistivity >18.2 MΩ·cm). Glass volumetric flasks, beakers, and bottles were acid cleaned and rinsed several times with deionized water and ultrapure water before use. When pH adjustments were performed, HCl and sodium hydroxide (NaOH) of trace metal grade were used (Fisher Scientific). For experiments at high oxidant loadings, hydrogen peroxide (H2O2, 30 wt% solution; Sigma Aldrich) was used as a model oxidant.
A cylindrical sample with 1 cm in diameter and 2.5 cm in length (Supplementary Fig. S1) was collected from a core taken from a well at a depth of 5,668 ft (1,728 m) in the Eagle Ford Formation, the target of current fracking operations. Upon arrival in the laboratory, samples were stored and ground to powder with an agate mortar and pestle in the anoxic atmosphere of a glove box filled with a N2/H2 mixture circulated over a heated Pd catalyst. Two powder samples (Sample 1 and Sample 2) from the same core and depth were used in the experiments. After grinding, Sample 2 was sieved to a size fraction of 53–106 μm and all of the Sample 1 powder was kept without sieving.
Solid characterization
X-ray diffraction (XRD) with Cu Kα radiation (Bruker d8 Advance X-ray diffractometer) provided information on the mineralogy of the samples. Approximately 250 mg of powder sample was placed in aluminum sample holders with preferred orientation minimized by excessive sample agitation. The Bruker Topas program was used to conduct quantitative analysis of multiphase mixtures by means of Rietveld analysis of the entire diffraction pattern (2θ ranged from 5° to 70°). The lower detection limit of the Rietveld analysis is ∼1 wt% (Madsen et al., 2001), which was sufficient to capture the pyrite available in the samples. Strong acid digestion (procedure in Supplementary Data) followed by inductively coupled plasma mass spectrometry (ICP-MS, Agilent 7500ce) was performed for elemental composition analysis. Extraction results of two USGS reference shale materials, by the same procedure, are listed in Supplementary Table S1. The extractable portions for the elements of interest (Ca, Mg, Fe, As) were higher than 80%. The specific surface area of the powdered samples was measured by BET-N2 adsorption (Brunauer et al., 1938) (Autosorb-1; Quantachrome Instruments). Total carbon (TC) and total inorganic carbon (TIC) were measured with a total organic carbon analyzer (TOC-LCPH with SSM-5000A; Shimadzu Corp.).
Batch experiments
Mobilization of metals from the samples was studied in a series of batch experiments that explored a range of pH, oxidant conditions, and solid:water ratios (Table 1). All experiments were performed in duplicate at room temperature. Blank controls, without sample powders, were conducted, sampled, and analyzed in parallel for all conditions evaluated. Reactions were initiated by the addition of sample into 100 mL ultrapure water to achieve a target solid:water ratio, which was 1 g/L in most experiments. The solid:water ratio was selected to eliminate potential transport limitations and to drive element mobilization. Suspensions were continuously mixed by magnetically stirring at 600 rpm. All batch reactors except for those probing anoxic conditions were loosely capped so that the suspension was open to the atmosphere. Reaction times of either 96 or 120 h (Table 1) were used; in preliminary experiments, this time was found to be sufficient for most elements (Ca, Mg, Fe, Ba, U) to be released to stable concentrations that were no longer changing (Supplementary Fig. S2). Aliquots (10 mL) of suspension were sampled at 1, 4, 24, 48, and 96 (120) hours and filtered through 0.22-μm polyethersulfone membranes for aqueous phase analyses. The suspension pH was monitored throughout the course of experiments with a benchtop pH meter (Fisher Scientific Accumet XL15).
For Experiments 1–7, these are the suspension pH when the last samples were taken. They were different than target pH due to the buffering capacity of the carbonate mineral in the samples.
Atmospheric means that the reactors were loosely capped to allow exchange with the air. Oxygen was the primary oxidant in this condition.
For investigation of pH (Experiments 1–7), either 0.1 M HCl or 0.1 M NaOH was intermittently added to the suspensions to adjust the pH to target values of 4 to 10. This approach of pH adjustment was selected as the samples had a strong buffering capacity (see Discussion section below). The final pH observed drifted considerably from the target value due to the buffering capacity of the sample (Supplementary Fig. S3). In investigating the effect of oxidizing conditions (Experiments 9–11), H2O2 was selected as a model oxidant to eliminate the generation of metals, metalloids, or anions of concern from the additives that could interfere with the interpretation of the experimental results. The concentrations of H2O2 were selected to be in great excess of the oxidant demand exerted by organic carbon and pyrite in the samples thus driving the maximum extent of oxidation for those species that can be oxidized by H2O2. A portion of 10 or 5 mL 30% H2O2 solution was diluted to a total volume of 100 mL with ultrapure water to obtain 3% or 1.5% H2O2 concentration before the addition of sample powders. In Experiment 11, the reaction started with 1.5% H2O2 and a second 5 mL aliquot of 30% H2O2 solution was added 24 h later to give a total added H2O2 concentration of 3%. In Experiments 13 and 14, two elevated solid loadings (2 and 10 g/L) were used to investigate the effect of solid:water ratio on element release to solution.
Experiment 8 at anoxic conditions was conducted with 100 mL serum bottles (Supplementary Fig. S4). The ultrapure water loaded into the bottles was first bubbled with ultrapure N2 that contained 400 ppm CO2 (N2/CO2 gas) for at least 30 min. For the experiment, a 50 mL suspension prepared with that water was used, and the serum bottle headspace was replenished with a continuous flow of the N2/CO2 mixture. The presence of CO2 in the headspace that was equivalent to that of the atmosphere resulted in dissolved inorganic carbon (DIC) and pH of the suspensions that were comparable to those in the other experiments. The dissolved oxygen level as determined with a dissolved oxygen microprobe (Ocean Optic Neofox System) was measured to be below 0.5 mg/L. Due to the limited suspension volume, no samples were taken during the 120-h experiment and a single 10 mL sample was collected and filtered at the end of the experiment.
Analytical methods
A portion of the filtrate was acidified and analyzed for concentrations of dissolved metals (Ca, Mg, Fe, Ba, U, Pb, Cr) and metalloids (As, Sb) by ICP-MS (Agilent 7500ce with a mass analyzer). The detection limits were 0.01 mg/L for major elements (Ca, Mg, Fe) and 0.1 μg/L for trace elements (Ba, As, U). The ranges of calibration standards were 0.1–10 mg/L for major elements and 0.1–100 μg/L for trace elements. Another portion of the filtrate was analyzed for sulfate by ion chromatography (881 Compact IC pro; Metrohm USA, Inc.). The electrical conductivity (EC) of the suspensions in Experiments 8–15 was measured with a conductivity meter (ECTestr11; Eutech Instruments).
Chemical equilibrium modeling
Chemical equilibrium modeling was used to evaluate whether the solutions had compositions that were controlled by equilibration with specific solid phases. The general approach was to solve for equilibrium based on mole balance equations, charge balance, and a set of equilibrium reactions (Nordstrom et al., 1990) (Supplementary Table S2). Equilibrium compositions were solved using both spreadsheet-based calculations and the software program MINEQL+v 4.6 (Schecher and McAvoy, 2007). In MINEQL and for spreadsheet (Microsoft Excel) approaches, activity coefficients were determined using the Davies equation (Supplementary Table S2). It should be noted that the approach for activity correction used is valid for the ionic strength values (below 0.05 M) observed in this study (Supplementary Table S2), but other approaches (such as Pitzer equations) may be appropriate for solutions with higher ionic strengths (He et al., 2014).
Results and Discussion
Core sample composition
Mineral and elemental compositions of the two core samples were very similar. Based on XRD measurements (Supplementary Fig. S5), carbonates (calcite, dolomite, and ankerite) are the dominant phases (74.6–77.9 wt%) in both samples. Other minerals included quartz, clay minerals (kaolinite), feldspar (albite), and a small amount of pyrite (1.3–1.9 wt%). Quantitative XRD analysis (Table 2) agrees well with the major element compositions (Ca, Mg, and Fe) of the sample. The relative richness of total organic carbon (TOC), carbonates, quartz, and clay minerals is consistent with other studies of the Eagle Ford Formation (Mullen, 2010; Harbor, 2011; Sondhi, 2011; Kearns, 2012).
These values were from quantitative XRD analysis by the Bruker Topas program. TOC amounts of up to 5% were not considered in the mass fractions presented here, which only correspond to the inorganic mineral component of the samples. After grinding, Sample 1 was kept without sieving and Sample 2 was sieved to a size fraction of 53–106 μm.
Criteria of fitting used here include: Rwp, R-weighted pattern; Rp, R-pattern; GOF.
Predicted values are those that would result if the minerals determined by XRD were the only phases contributing Ca, Mg, Fe, and inorganic carbon.
Experimental values are from acid digestion and inorganic carbon analysis (Table 3).
Reported ranges of values for comparison.
GOF, goodness of fit; TIC, total inorganic carbon; TOC, total organic carbon; XRD, X-ray diffraction.
The solid digestion results (Table 3) indicated that both samples were rich in calcium (25.4% for Sample 1 and 29.2% for Sample 2), corresponding to 63.5% and 73.0% calcite by mass. Other major elements included magnesium (2.3%) and iron (1.0–1.1%). The contents of some regulated trace elements (e.g., Cr was 15.9 mg/kg in Sample 1 and 36.1 mg/kg in Sample 2) were lower than their average crustal abundance (83 mg/kg for Cr), while other elements of concern were higher than their crustal average (e.g., As has a crustal average of 1.7 mg/kg, while the samples had concentrations of 24.6 and 25.7 mg/kg) (Taylor, 1964). The abundances of major and trace elements in Sample 1 and Sample 2 are also compared with other reported literature values for Eagle Ford samples (Table 3).
Expressed as average±standard deviation of triplicate analyses.
Barium recovery from the solid during solid digestion was incomplete, so these values do not represent the total Ba content of the samples.
Reported ranges of values from literature for comparison.
Samples 1 and 2 had comparable physical and chemical properties (Table 3). Despite the difference in particle size distribution, the specific surface areas (3.5 m2/g for Sample 1 and 3.6 m2/g for Sample 2) were almost identical. The TIC content (70.7 mg/g for Sample 1 and 85.0 mg/g for Sample 2) was consistent with the numbers estimated from the mass fractions of carbonate mineral as determined by quantitative XRD analysis (Table 2). In another study of Eagle Ford Formation properties, TIC was also observed to have a positive linear relationship with the Ca content (Kearns, 2012). The TOC content, determined as the difference between TC and TIC, was 48.6 mg/g (4.86%) for Sample 1 and 44.8 mg/g (4.48%) for Sample 2. These numbers are consistent with the elevated organic matter content in the Eagle Ford Formation as a proven hydrocarbon source rock (Harbor, 2011).
Summary of mobilization results
The following discussion focuses on the aqueous concentrations of Ca, Mg, Fe, Ba, As, and U either because they are major elements (Ca, Mg, Fe) that affect the fate of other elements or because they are regulated trace elements (Ba, As, U) with known toxicity and public health implications (U.S. HHS, 2003; U.S. EPA, 2010). Other regulated trace elements (Cu, Pb, Cr) that were below detection limits throughout the experiments are not discussed. The leaching of Ca and Ba was controlled by equilibrium with solid phases (calcite, barite), while kinetic limitations in reaction rates play a more important role in other constituents such as As, Mg, and sulfate.
Effects of solution pH
The solid suspensions used in batch reactors exhibited a strong buffering capacity due to the high calcite content of the samples. After each manual adjustment targeting a specific pH value, the solution pH drifted back toward the value for calcite equilibrium (Supplementary Fig. S6). The final pH range (7.0–8.4) was much narrower than the target pH range (4–10); however, there was good correlation between the final pH and the target pH values (Supplementary Fig. S3), which corresponds to the amount of acid or base added. The total acid-neutralizing capacity of the samples was found to be 8.2 mmol acid per gram solid in a strong acid titration of a 1 g/L suspension (Sample 1) to pH below 4.0 (Supplementary Fig. S7). The high buffering capacity from the high carbonate mass fraction indicates that, for the Eagle Ford Formation, initially acidic hydraulic fracturing fluids could flow back with neutral or even higher pH values depending on fluid residence times.
Acid or base pH adjustments, aimed at targeted pH values, of the core sample suspensions significantly affected the mobilization of many metals. In general, higher releases of elements (Ca, Mg, Fe, Ba, As) were observed with more acid addition (Fig. 1). This effect was most evident for major elements. At the lowest final pH of 7.0, the dissolved Ca concentration was as high as 165 mg/L, which accounts for ∼65% of the total Ca in the original solids, while at the highest final pH of 8.4, the Ca concentration was only 3 mg/L. Similarly, about 60% of total Mg was mobilized at the lowest target pH and less than 1% at the highest pH. Trace element release was somewhat affected by pH. Arsenic concentrations were higher at lower pH, and slightly higher U concentrations occurred between final pH values of 7.6–7.9. However, the concentrations of both As and U remained low (0–5.0 μg/L for As and 0–1.1 μg/L for U) throughout the experiments.

Final aqueous concentrations of
Ca release is correlated with the mobilization of many other elements (Fig. 2) as calcium carbonate readily hosts (and thus can release) other divalent cations (Mg, Ba, Fe). The relationship between the concentration of an individual element and that of calcium can be the result of more than one factor. Final Fe concentrations were positively correlated with Ca concentrations in Experiments 1–7, which could be partially attributed to the common phenomenon of Fe(II) substitution for Ca in calcite (Reeder, 1983) and the presence of ankerite [CaFe0.2Mg0.8(CO3)2]. However, soluble Fe concentrations are also subject to the rate and extent of Fe(II)/Fe(III) redox reactions. As the rate of Fe(II) oxidation to Fe(III) by oxygen increases with increasing pH, oxidation of Fe(II) followed by precipitation of Fe(III) may occur at higher pH values (Crittenden et al., 2012). The higher iron concentrations in anoxic conditions relative to open and oxidative systems (Fig. 3) were a clear indication that iron oxidation and precipitation occurred in the presence of oxygen and/or H2O2. Note that the processes above could affect the soluble Fe concentrations simultaneously and yield the almost linear relationship between Fe and Ca concentrations, as shown in Figure 4. In contrast, Mg concentrations were observed to follow a different linear trend with Ca concentrations at different pH regions, with a larger slope observed at lower pH values. This is consistent with previous studies that dolomite dissolution rates decrease with increasing pH (Pokrovsky et al., 1999; Pokrovsky and Schott, 2001). In addition, the presence of dissolved Ca could also strongly inhibit dolomite dissolution above pH 7 (Pokrovsky and Schott, 2001).

Relationship between the final aqueous concentrations of Mg, Ba, Fe, As, and U and the final Ca concentrations in experiments with pH adjustment (Experiments 1–7). Experiments were performed at room temperature with 1 g/L shale loading. Data are shown as the average of the duplicates.
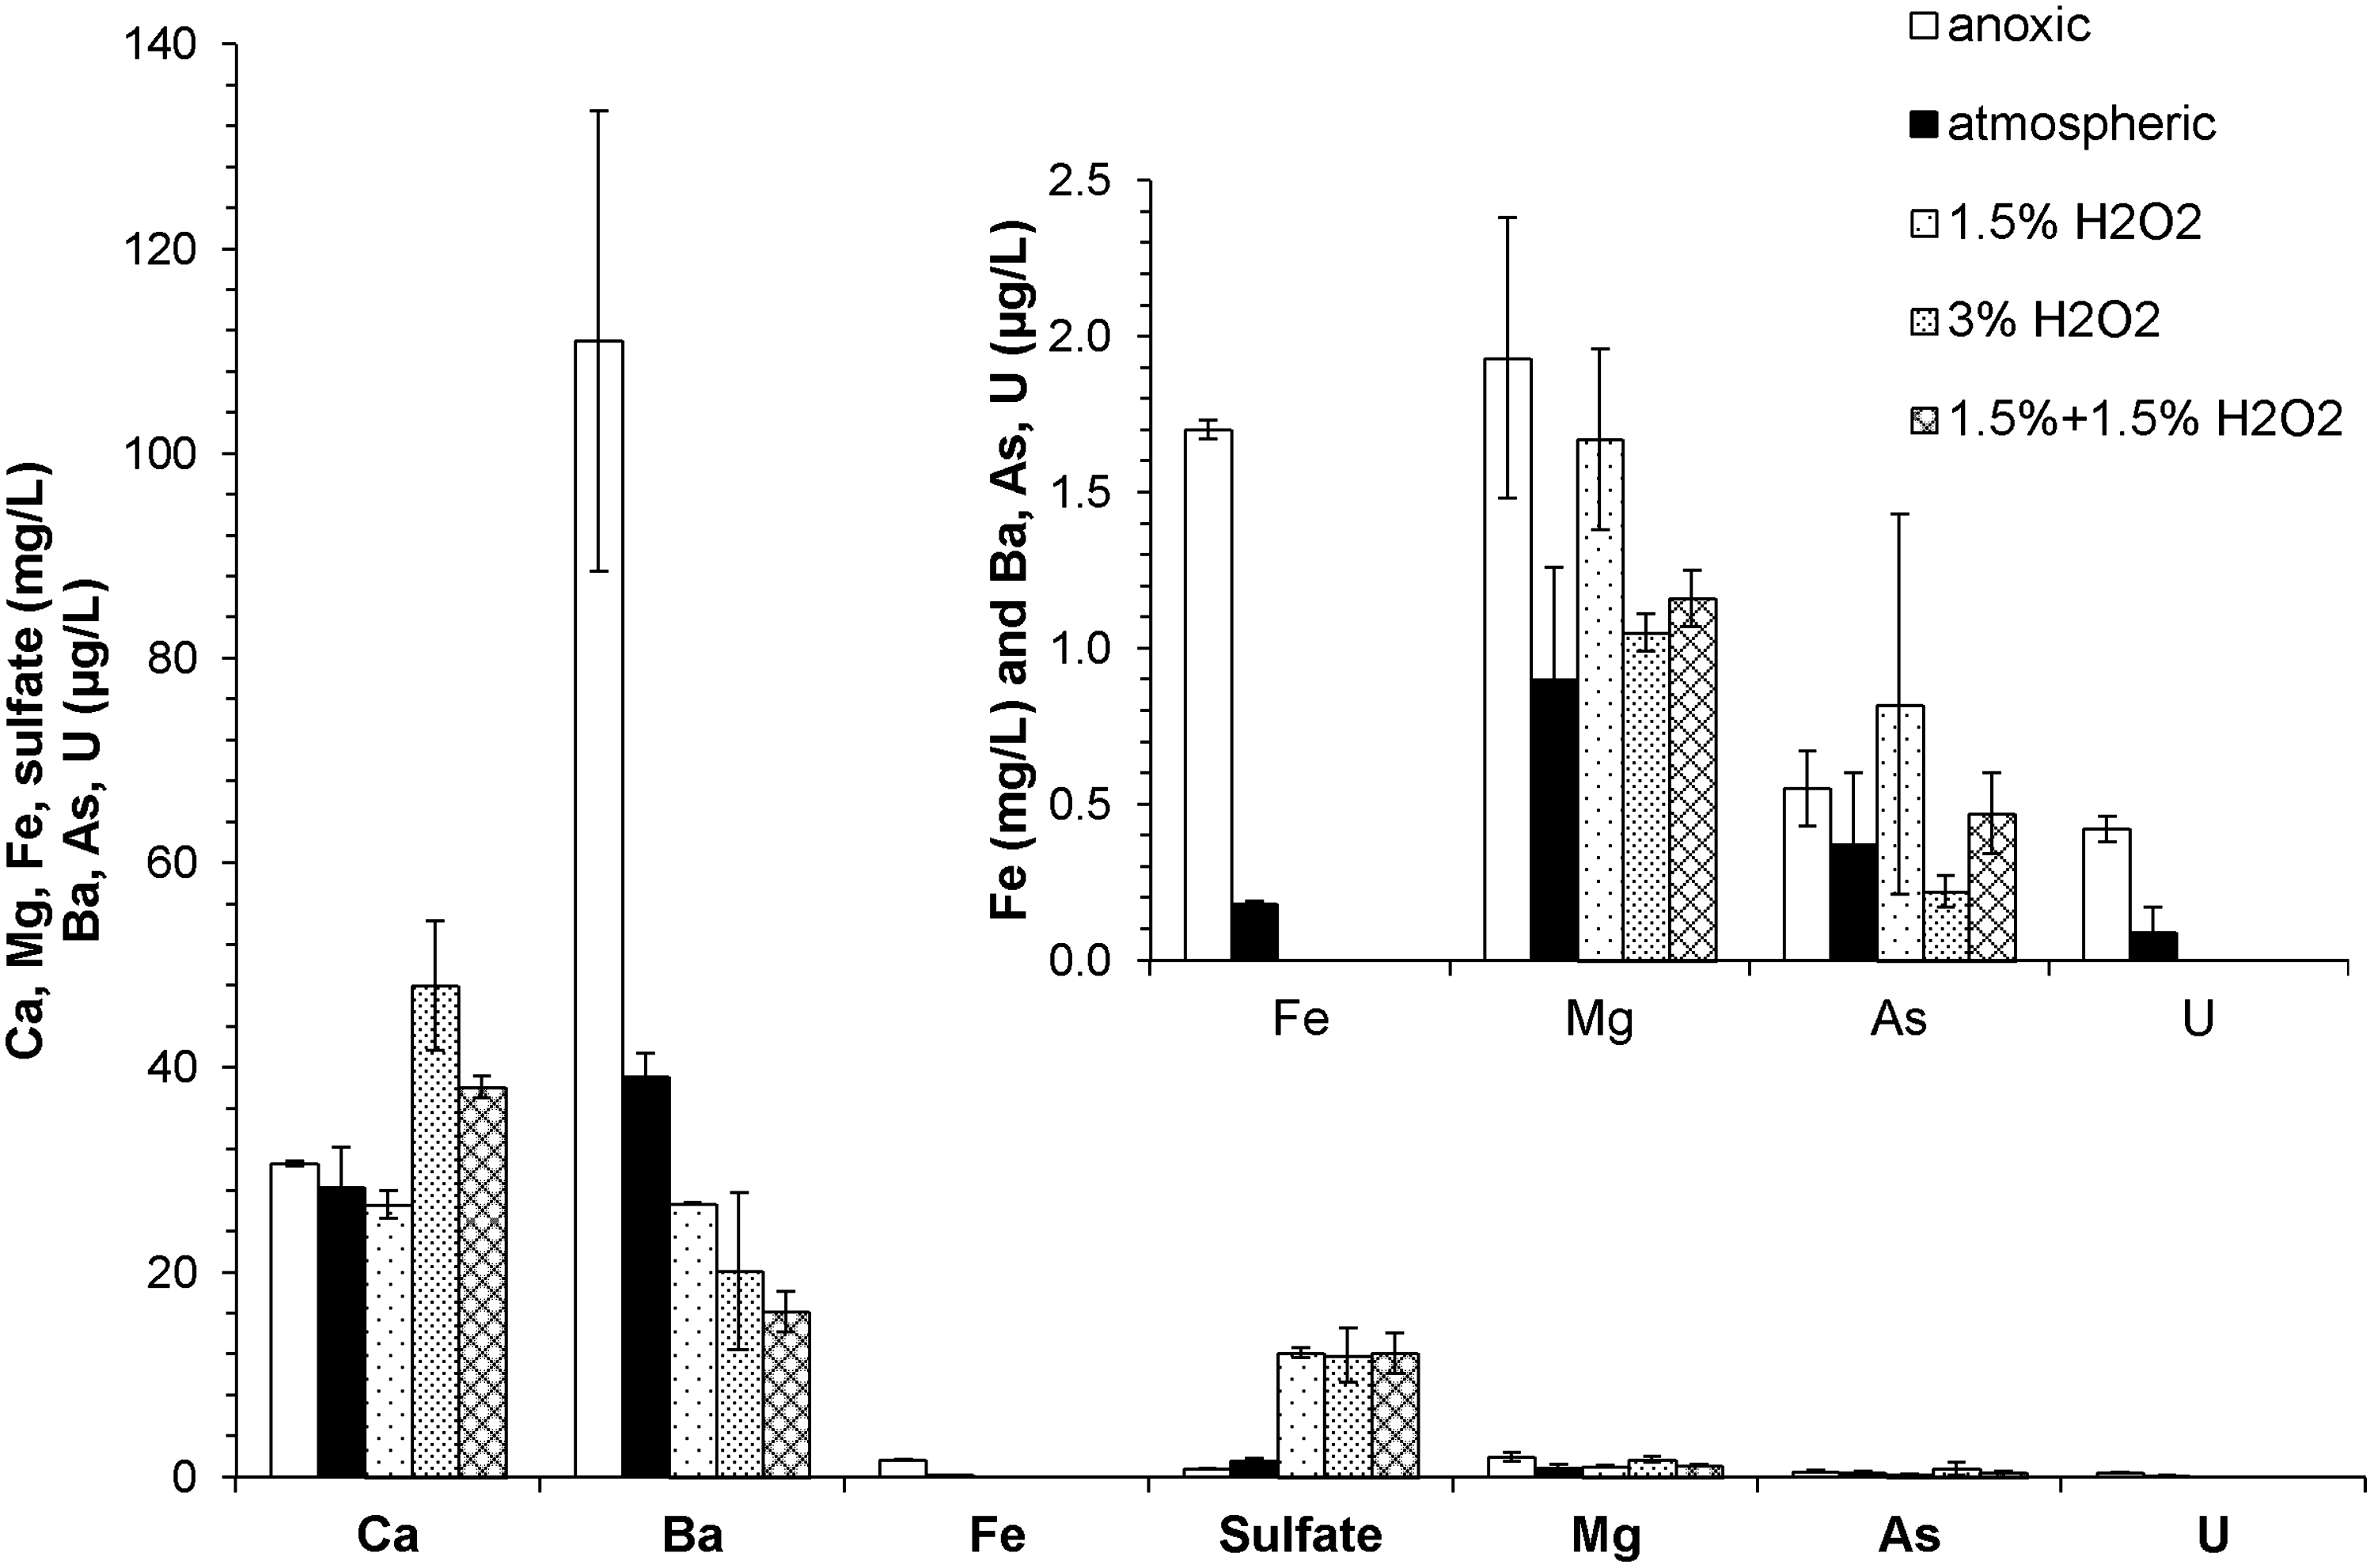
Metal and sulfate mobilization after 120 h of reaction under anoxic (Experiment 8), atmospheric (Experiment 12), and oxidative conditions (Experiment 9–11). Experiments were performed at room temperature with 1 g/L shale loadings. A 1.5% (3%) H2O2 solution was prepared fresh for groups marked with 1.5% (3%) H2O2. The 1.5%+1.5% H2O2 group started with 1.5% H2O2 and was reacted for 24 h before the addition of another 1.5% H2O2 (3% total H2O2 concentration thereafter). Data are shown as the average of the duplicates with error bars being the standard deviations. The Fe and U concentrations with H2O2 were below detection limits. The atmospheric and oxidative condition experiments were open to the laboratory atmosphere, and the anoxic experiments had headspaces with 400 ppm CO2.

Comparison of measured and predicted solution compositions based on calcite equilibrium. Predictions are shown as lines for a system with calcite open to an atmosphere with a CO2 partial pressure of 10−3.46 atm (dashed line), and for a system closed with respect to exchange with the atmosphere (solid line) for systems to which acid or base had been added to yield the pH range shown. The predicted pH and calcium concentrations without acid or base addition are shown as the+and x for the open and closed system, respectively. The other markers (open triangle, diamonds, squares, and circles) are data from different experiments.
A comparison between predicted calcite equilibrium and experimental data supported calcite dissolution as the dominant pathway for Ca2+ mobilization. Results from Experiments 1–7 were compared with equilibrium calcite solubility in open and closed systems (Fig. 4). Experimental measurements generally agreed with predicted equilibrium for a system closed with respect to atmospheric exchange. Although the batch reactors were loosely capped, the rate of CO2 exchange between the suspension and atmosphere could have been slower compared with the acid-base reaction from the pH adjustment, especially in the lower pH region (pH<4) where CO2 effectively acts as an inert gas (Hoover and Berkshire, 1969), thus leading to a system behavior that is closer to a closed system. Without pH adjustment, calcite dissolution was predicted to equilibrate at pH 8.23 with 18.7 mg/L Ca in the open system and at pH 9.9 with 4.4 mg/L Ca in a closed system according to equilibrium calculations (Fig. 4). Data from Experiments 8–15 (i.e., those with no pH adjustment) were all close to the model predictions for an open system.
Oxidant level effect
Compared with experiments open to the atmosphere, the lack of oxygen in anoxic environments prevents a number of oxidative pathways (Fig. 3). Monitoring of the pH indicated that the use of the N2/CO2 gas sparging and headspace allowed for DIC and pH levels in anoxic experiments that were comparable to those under atmospheric conditions. Ca concentrations were similar with or without oxygen since calcite dissolution is independent of redox conditions. Experiments with H2O2 had pH values that were 0.4–0.6 units lower than those without H2O2 (Supplementary Fig. S8), which could explain the slightly higher final Ca concentrations in experiments with a 3% final H2O2 concentration. The decrease in pH was likely a result from pyrite oxidation and/or precipitation of Fe(OH)3.
The sensitivity of sulfate concentration to the presence of oxidants suggests that pyrite was being oxidized. After 120 h, sulfate concentrations were 0.8 mg/L under anoxic conditions and 1.6 mg/L under atmospheric conditions. Furthermore, the addition of 1.5% H2O2 generated 11.3 mg/L (118 μM) more sulfate than observed for anoxic conditions. H2O2 concentrations (1.5% and 3%) used in the experiments were selected so that they would be in great excess (more than 30-fold) of the oxidant demand exerted by the observed levels of organic carbon and pyrite in the samples. The sulfate released in the anoxic experiment could represent the original amount of sulfate present (0.8 mg SO42−/g sample), while the additional 11.3 mg/L sulfate produced in the presence of H2O2 represents the amount of oxidizable sulfur (3.8 mg S/g sample) in the solids that could be mobilized within 120 h. This amount of oxidizable sulfur is 53% of the amount of sulfur in the sample from the pyrite abundance determined from quantitative XRD (7.1 mg FeS2–S/g sample). Because the measured mass fraction of pyrite (1.3% in Sample 2) was close to the detection limits of the Rietveld refinement, this inconsistency might be caused by the uncertainty in the pyrite amount that influenced the estimated sulfate amount that could be produced.
Reactions (1) and (2) show the complete oxidation of both iron and sulfur in pyrite upon exposure to oxygen or H2O2. The expected decrease in pH from proton generation as shown in Reactions (1) and (2) would be significant if there were no other minerals with buffering capacity such as carbonate. The mole ratio of calcite to pyrite that represents complete neutralization is 4:1 (Chermak and Schreiber, 2013) according to Reactions (3) and (4). The Eagle Ford samples used in this study contained calcite in great excess compared to pyrite (mole ratio=52.2:1), effectively stabilizing the pH of the systems.
Barium concentrations were negatively correlated with sulfate concentrations, which in turn were affected by the oxidant level of the system (Fig. 3), suggesting that Ba mobilization was controlled by barium sulfate (BaSO4) solubility. BaSO4 was not initially present in the samples but rather precipitated as a secondary phase, while barium and sulfate likely leached from different sources. This has been further proved by the modeling results that BaSO4 solubility is not influenced by pH, and all experimental data (i.e., the ion activity product for barium sulfate) stayed within one order of magnitude of the predicted equilibrium solubility (Supplementary Fig. S9). In anoxic experiments, which had similar pH profiles to those open to the atmosphere, the Ba concentration reached a maximum of 111 μg/L. This value would be equivalent to at least 111 mg/kg barium in the solid, which was higher than the value determined by solid digestion (57.9 mg/kg in Sample 2). The solid digestion did not recover the entire Ba content of the core sample, as Ba released from the initial host phases (e.g., substituted in calcite) precipitates as BaSO4, with the sulfate produced during the digestion.
Soluble As and U concentrations remained low at all oxidant levels (only up to 3% for As and 7% for U release observed) and below EPA maximum contaminant levels of 10 and 30 μg/L in drinking water (U.S. EPA, 2009). This is possibly due to their relatively low amounts in the original solid sample and potential for (re)sorption processes with solid particles in suspension.
Solid:water ratio effect
The solid:water ratio affected the mobilization of different elements to varying degrees (Fig. 5). Ca concentrations were relatively independent of solid loadings because, as mentioned, they were primarily controlled by the calcite dissolution equilibrium. Mg and Ba concentrations were higher at elevated solid:water ratios, but the increase was not linear. The nonlinearity may be due to different rates of dissolution of specific phases (e.g., dolomite vs. calcite) that host these elements as well as potential inhibition of Mg release from dolomite with increasing Ca concentrations (Pokrovsky and Schott, 2001). Soluble Ba concentrations were directly related to the abundance of available sulfate. Sulfate concentrations were much higher at the highest solid:water ratio of 10 g/L. Amounts of sulfate that were directly dissolved from the solid (8.9 mg/L) and produced from oxidation of reduced sulfur sources (4.8 mg/L) were both greater at a 10 g/L solid:water ratio than those (0.8 and 0.8 mg/L) at 1 g/L loading (Supplementary Fig. S10). Compared to the quantitative XRD results, all pyrite was not oxidized in open systems (having available oxygen). This incomplete sulfur oxidation could be the result of slow oxidation rate of pyrite by oxygen alone. Ca concentrations, independent of solid:water ratios, and higher sulfate, at elevated solid:water ratios, were also observed under anoxic conditions (Supplementary Fig. S10).
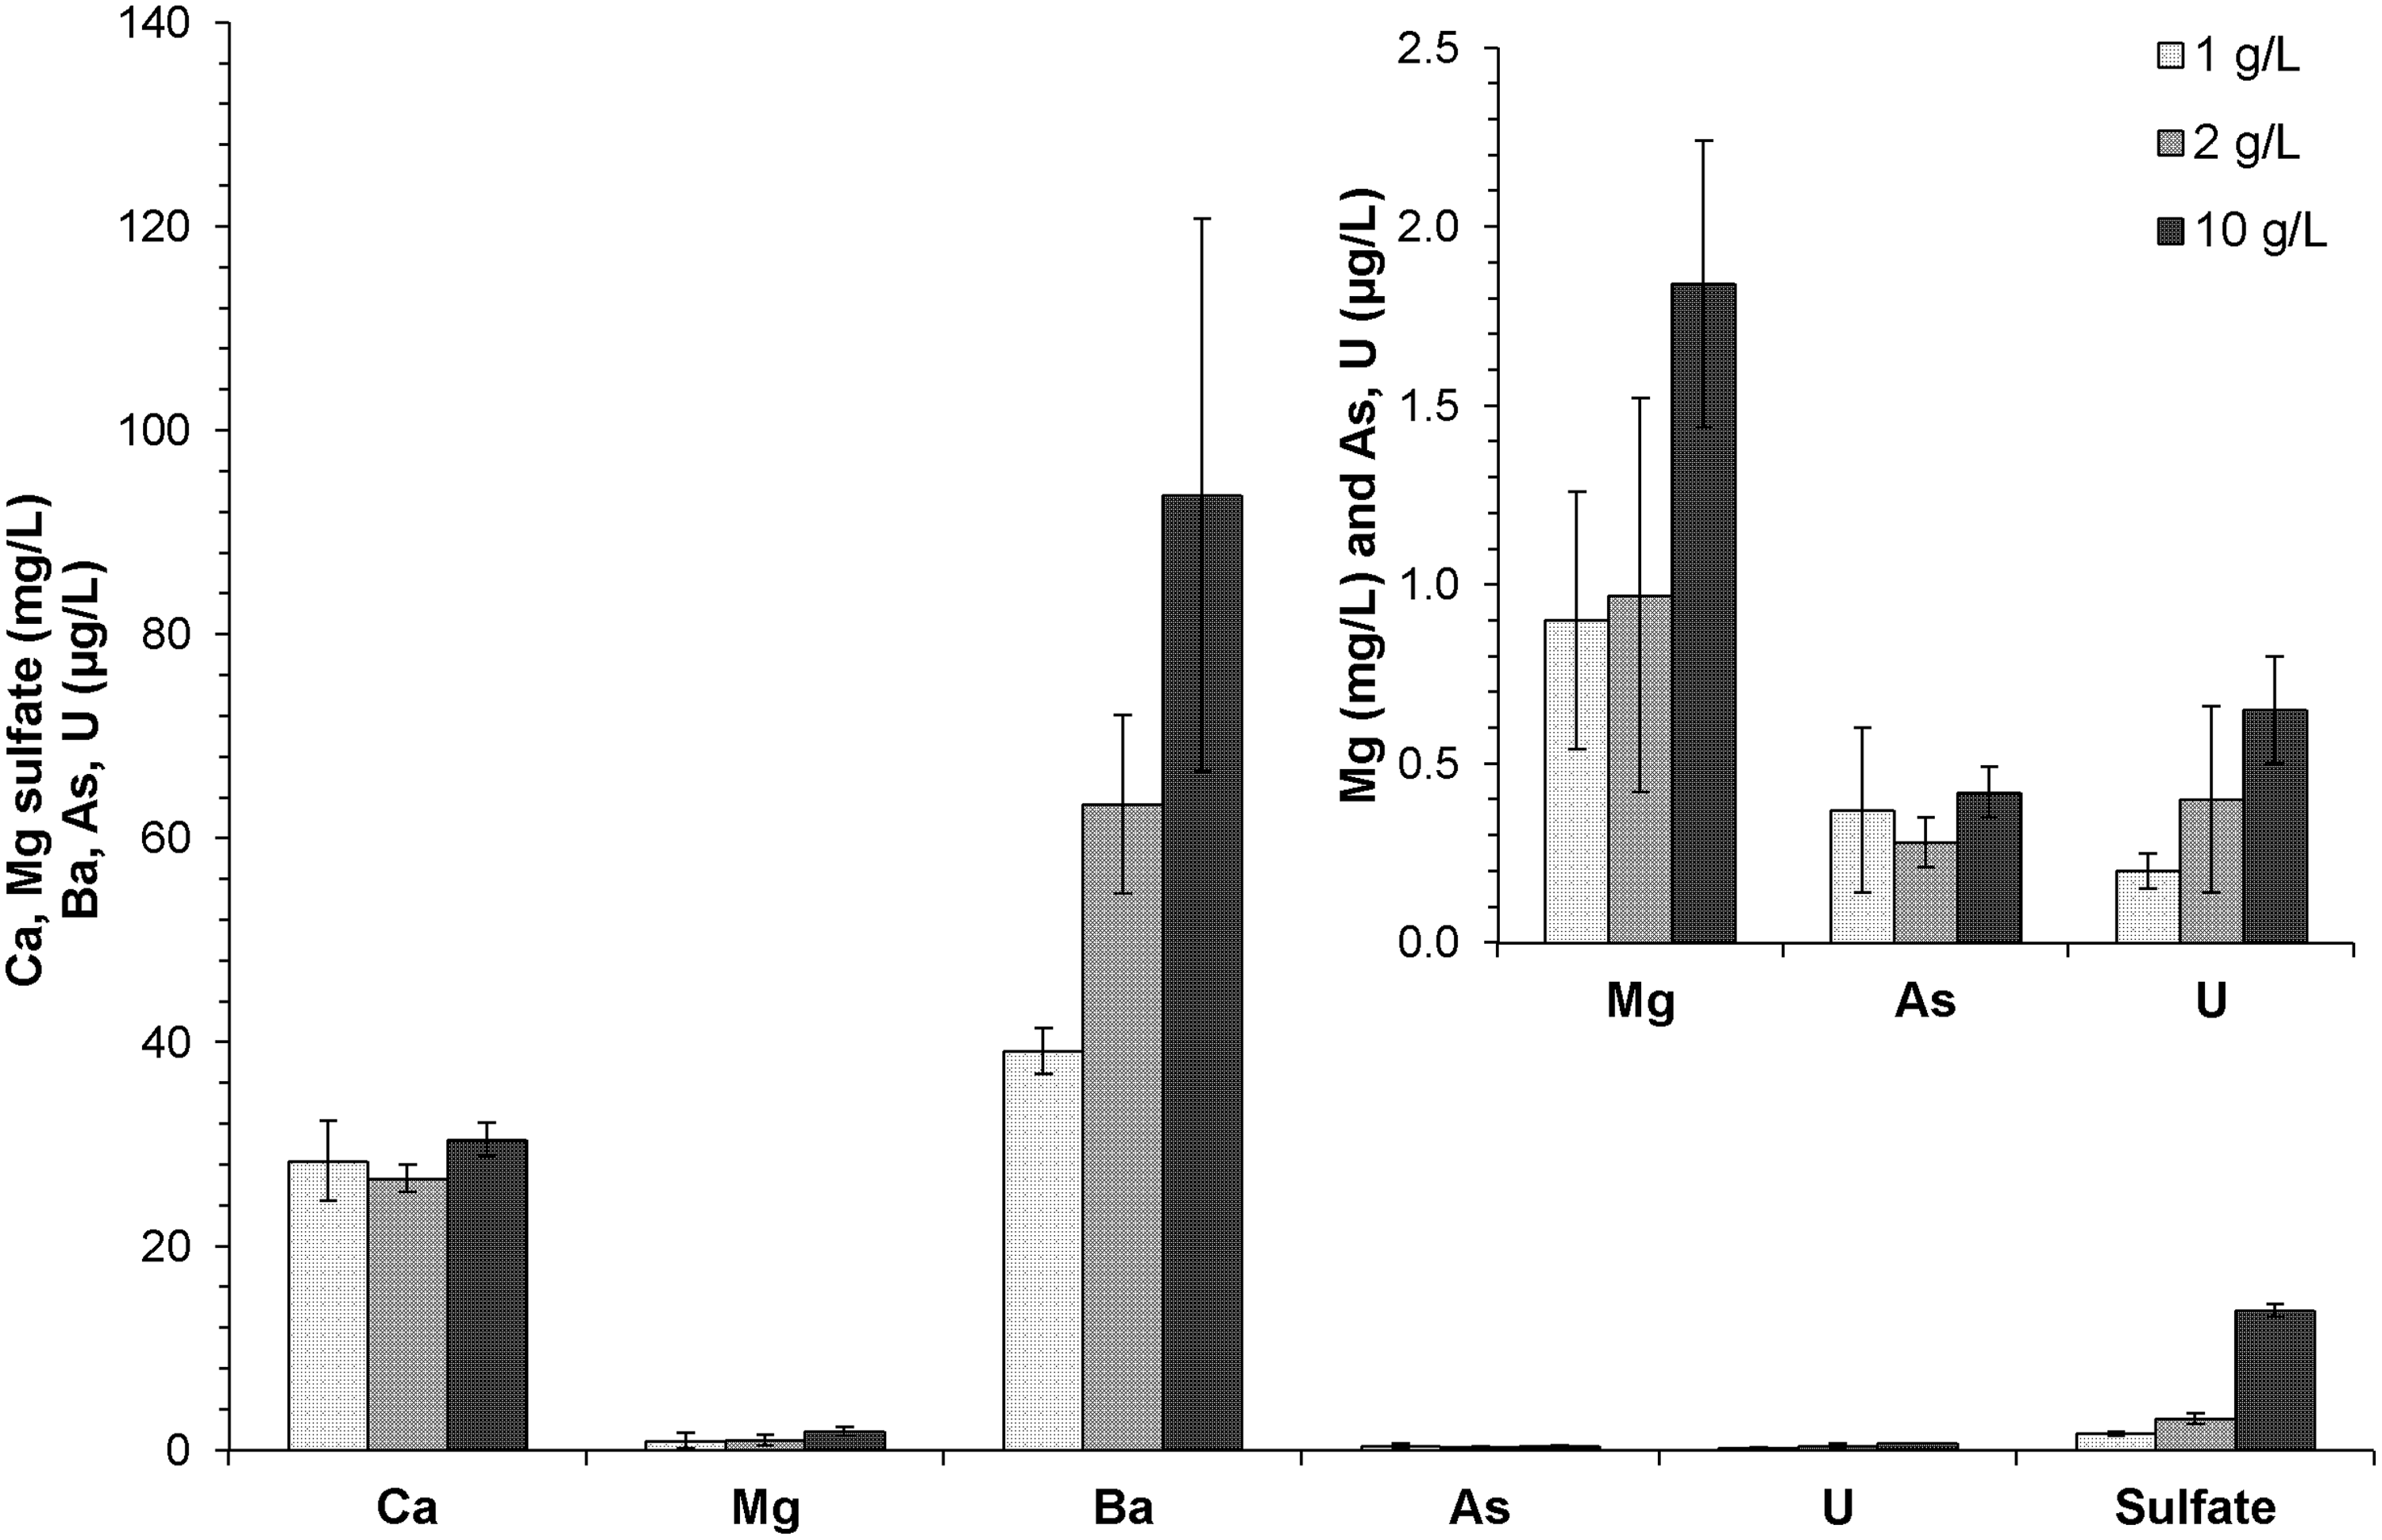
Metal and sulfate mobilization with different solid:water ratios (1, 2, 10 g/L) after 120 h of reaction. Experiments were performed at room temperature and open to the atmosphere. Data are shown as the average of the duplicates with error bars being the standard deviations.
EC of suspensions remained relatively stable regardless of the solid:water ratio (Supplementary Fig. S11), as the aqueous phase composition was largely controlled by calcite dissolution. Measured EC could also be used to estimate the TDS (108–126 mg/L) based on the relative concentrations of the major cations and anions present (Supplementary Table S3). The reported produced water TDS level in Eagle Ford Formation is 40,346–144,952 mg/L (Blondes et al., 2014), which is higher than typically observed in this study. This difference can be attributed to an elevated rock:water ratio and longer contact times. Previous work has shown that TDS of flowback waters increases with time in the 30 days after hydraulic fracturing ceased (Kimball, 2012; Barbot et al., 2013).
Conclusions
Understanding element release from shale materials exposed to various water chemistries will aid in managing wastewaters from hydraulic fracturing operations. For the Eagle Ford samples used in this study, the release of elements strongly depended on pH, which was primarily controlled by carbonate dissolution. High Ca concentrations and potential precipitation of BaSO4 will likely impact system-wide scaling. The introduction of oxygen and other oxidants could significantly increase the amount of sulfate over time when pyrite is available. When coupled with bioavailable dissolved organic carbon, the growth of sulfate-reducing bacteria could potentially result in biofouling/biofilm formation and the production of unwanted reduced sulfur species (Kirk et al., 2012; Murali Mohan et al., 2013; Cluff et al., 2014). For these Eagle Ford Formation core samples, the trace elements (As, U, and Ba) mobilized from rock–fluid contact will probably not affect the choice of strategies for management of produced waters.
The degree to which the findings from this study can be related to flowback from the Eagle Ford Formation will be a function of the parameters used in actual operations and subject to the complicated subsurface conditions. For example, while calcite solubility decreases with elevated temperature in subsurface, Na+, Mg2+ ions present in formation brine could significantly increase calcite solubility due to their incorporation into the calcite lattice (Plummer and Busenberg, 1982; He and Morse, 1993). The solid:water ratio in the field will depend on the fracture network (10,000s to 100,000s g/L for overall porosities in the range of 1–10%), however, the rock–fluid interactions will occur at both fractured surfaces and the mobilized particles—fluid interfaces, thus the total reactive surface area will be a more relevant property to scale-up the extent of mobilization. As flowback residence times can reach up to several weeks (Vidic et al., 2013), the flowback volumes can decrease with increasing TDS due to mixing with formation water (Kimball, 2012). Moreover, similar responses of element mobilization toward the addition of acid or base are more likely to apply to carbonate-rich formations, while the presence of barium in a pyrite-rich formation might predict the precipitation of barite as a secondary phase and the subsequent scaling as a potential problem for well performance. For these Eagle Ford samples, the dominance of carbonate minerals suggests that the buffering of strong acids could last for a very long time, however, the acidic fracturing fluids will not interact with the entire formation and their action to initiate fractures can be limited to the zone immediately adjacent to the well.
Footnotes
Acknowledgments
This study was supported by research funding from the McDonnell Academy Global Energy and Environmental Partnership. The authors thank Ross Tomson from the Shale Water Research Center for providing the samples from the Eagle Ford Formation. Begüm Karakoçak and Andrew Martahus contributed to the experiments. Portions of this work were performed when Lin Wang was a visiting student research collaborator in the Department of Civil and Environmental Engineering at Princeton University. The authors thank Joseph Vocaturo, Lori Tunstall, John Higgins, Elizabeth Lundstrom, Yi Jiang, and Jennifer Houghton for their assistance with experiments and analyses.
Author Disclosure Statement
No competing financial interest exists.
References
Supplementary Material
Please find the following supplemental material available below.
For Open Access articles published under a Creative Commons License, all supplemental material carries the same license as the article it is associated with.
For non-Open Access articles published, all supplemental material carries a non-exclusive license, and permission requests for re-use of supplemental material or any part of supplemental material shall be sent directly to the copyright owner as specified in the copyright notice associated with the article.