
Abstract
Abstract
A zigzag demister model is built to investigate the penetration of droplets in a zigzag demister. The rationality of the model is verified by comparing with the published experimental data. The flue gas and droplets are one-way coupled to observe the motion of droplets, and the effect of gas velocity and size grading on the separation efficiency was studied. Then, the coalescence of droplets is considered for the overall separation efficiency and grade separation efficiency in the model. The results show that under a certain gas bulk velocity, the coalescence of droplets remarkably affects the overall separation efficiency, and the influence of coalescence on the grade separation efficiency becomes manifested for the droplets between 7.5 and 22.5 μm. The effect of demister on the number concentration is investigated by counting the number of droplets at the entrance and exit. The results show that the separation efficiency based on the number concentration is lower than that based on the mass concentration. Meantime, the droplets concentration of different sizes versus the height of the demister module has been plotted to determine in which section the droplets are collected. This suggests that strengthening the coalescence of droplets improves the separation efficiency, especially for small droplets, which have become a serious problem in mist elimination in the world.
Introduction
W
As the national emission standard is raised, the capability of demister is far from meeting the requirement. So, research on the separation efficiency of the demister has been a focus. The research work can be divided into two parts: experimental research and numerical simulation. In the experimental research, Burkholz (1989) and Ushiki et al. (1982), respectively, tested the performance of the zigzag demister and wave-plate demister and determined the influence factors. Monat et al. (1986) measured the separation efficiency of the zigzag demister with laser interferometer and found that the liquid film begins to break up and the generated droplets re-entrained into the gas under high bulk gas velocity. The re-entrainment became serious with the increase of gas velocity. Verlaan (1991) analyzed the separation efficiency of droplets in the range of 20–90 μm and found that the efficiency decreases because of the overflow of the liquid film in the wave-plate surface under high bulk gas velocity. Layton et al. (1997) tested the separation efficiency of the demister in a different position with laser interferometer. Wang (2009) and Huang et al. (2009) built their own experimental platforms, and they obtained the efficiency at different gas velocities under their own experimental conditions and optimized the combination of different demisters. However, there is a big disadvantage that the motion of droplets cannot be experimentally tracked, which means that the grade separation efficiency cannot be precisely measured. Nevertheless, the numerical simulation method can well solve this problem. In the numerical simulation field, Wang and James (1999) improved the vortex interaction model. Their results showed that after the time-averaged velocity and fluctuation velocity of vortex updated in each time step, the prediction of separation efficiency had been improved. Xu et al. (2007) and Yao et al. (2010) simulated the gas–fluid two-phase flow in the demister and discussed the influence of droplet size, gas velocity, and blade size on efficiency. However, previous simulation on demister did not consider the coalescence of droplets, and the models were always simplified into two-dimensional flow, which means that the droplets cannot be evenly distributed in the space compared with the actual working condition and the results are not accurate.
In conclusion, the research on zigzag demister has these problems. The experiment method primarily discusses the overall separation efficiency and tracks the variation of the mass concentration of the droplets, as it is hard to count the concentration of the droplets in the demister. Current simulation on the demister does not clearly explain the penetration of droplets of different sizes. The quantitative analysis on the grade separation efficiency and the coalescence of droplets has not realized. However, the penetration of droplets should be clearly studied if further improvement of the separation efficiency is to be achieved.
In regard to the existing problems, the purpose of this article was to investigate the penetration of droplets of different sizes. The Euler–Lagrange method is applied to describe the motion of flue gas and droplets in three dimensions. Then, the projective distribution of the droplets of different sizes and the influence of the coalescence of droplets on the overall separation efficiency and grade separation efficiency are, respectively, analyzed. Furthermore, experimental and simulation results are compared to verify the rationality of the model, and they reach a good consistency. In conclusion, the influence of the coalescence of droplets on the overall separation efficiency and grade separation efficiency based on the mass concentration and number concentration is discussed. The results show that the zigzag demister has weaker control of the number concentration compared with the mass concentration, and the variation of grade separation efficiency changes at 22.5 μm. Then, we explain the above phenomena from the perspective of the coalescence of droplets.
The Foundation of Demister Model
There are many kinds of demisters, including swirl type (Tan, 1978), net type (Zhu, 1982), electrostatic type (Lin, 2011), and zigzag type (Ji, 2012). The zigzag demister is widely used in the wet desulfurization system because of the advantages of low pressure drop, strong anticlogging capacity, and high processing capacity (Xie, 2009).
Physic model
To verify the rationality of the model, the model refers to the experimental data in the reference (Wang, 2009). The experimental platform, which considers the Taishan power plant 600 MW unit desulfurization system as a prototype, is built up. Furthermore, our model corresponding to the primary demister in the experiment is constructed. The geometrical parameters of the demister are shown in Fig. 1. The length of the demister is 300 mm in the third dimension (data not shown in Fig. 1). The model includes entrance section, which ensures that the droplets can be fully mixed, demister section, and exit section. Droplets are randomly generated at the inlet, and the droplets arriving at the outlet are deemed to escape from the model and will be deleted. Droplets at the inlet and outlet are counted to calculate the separation efficiency. The grid number of the model is 1995000. The time step is 0.00001 s. Furthermore, the grids in the demister section are refined to guarantee the accuracy of the results.
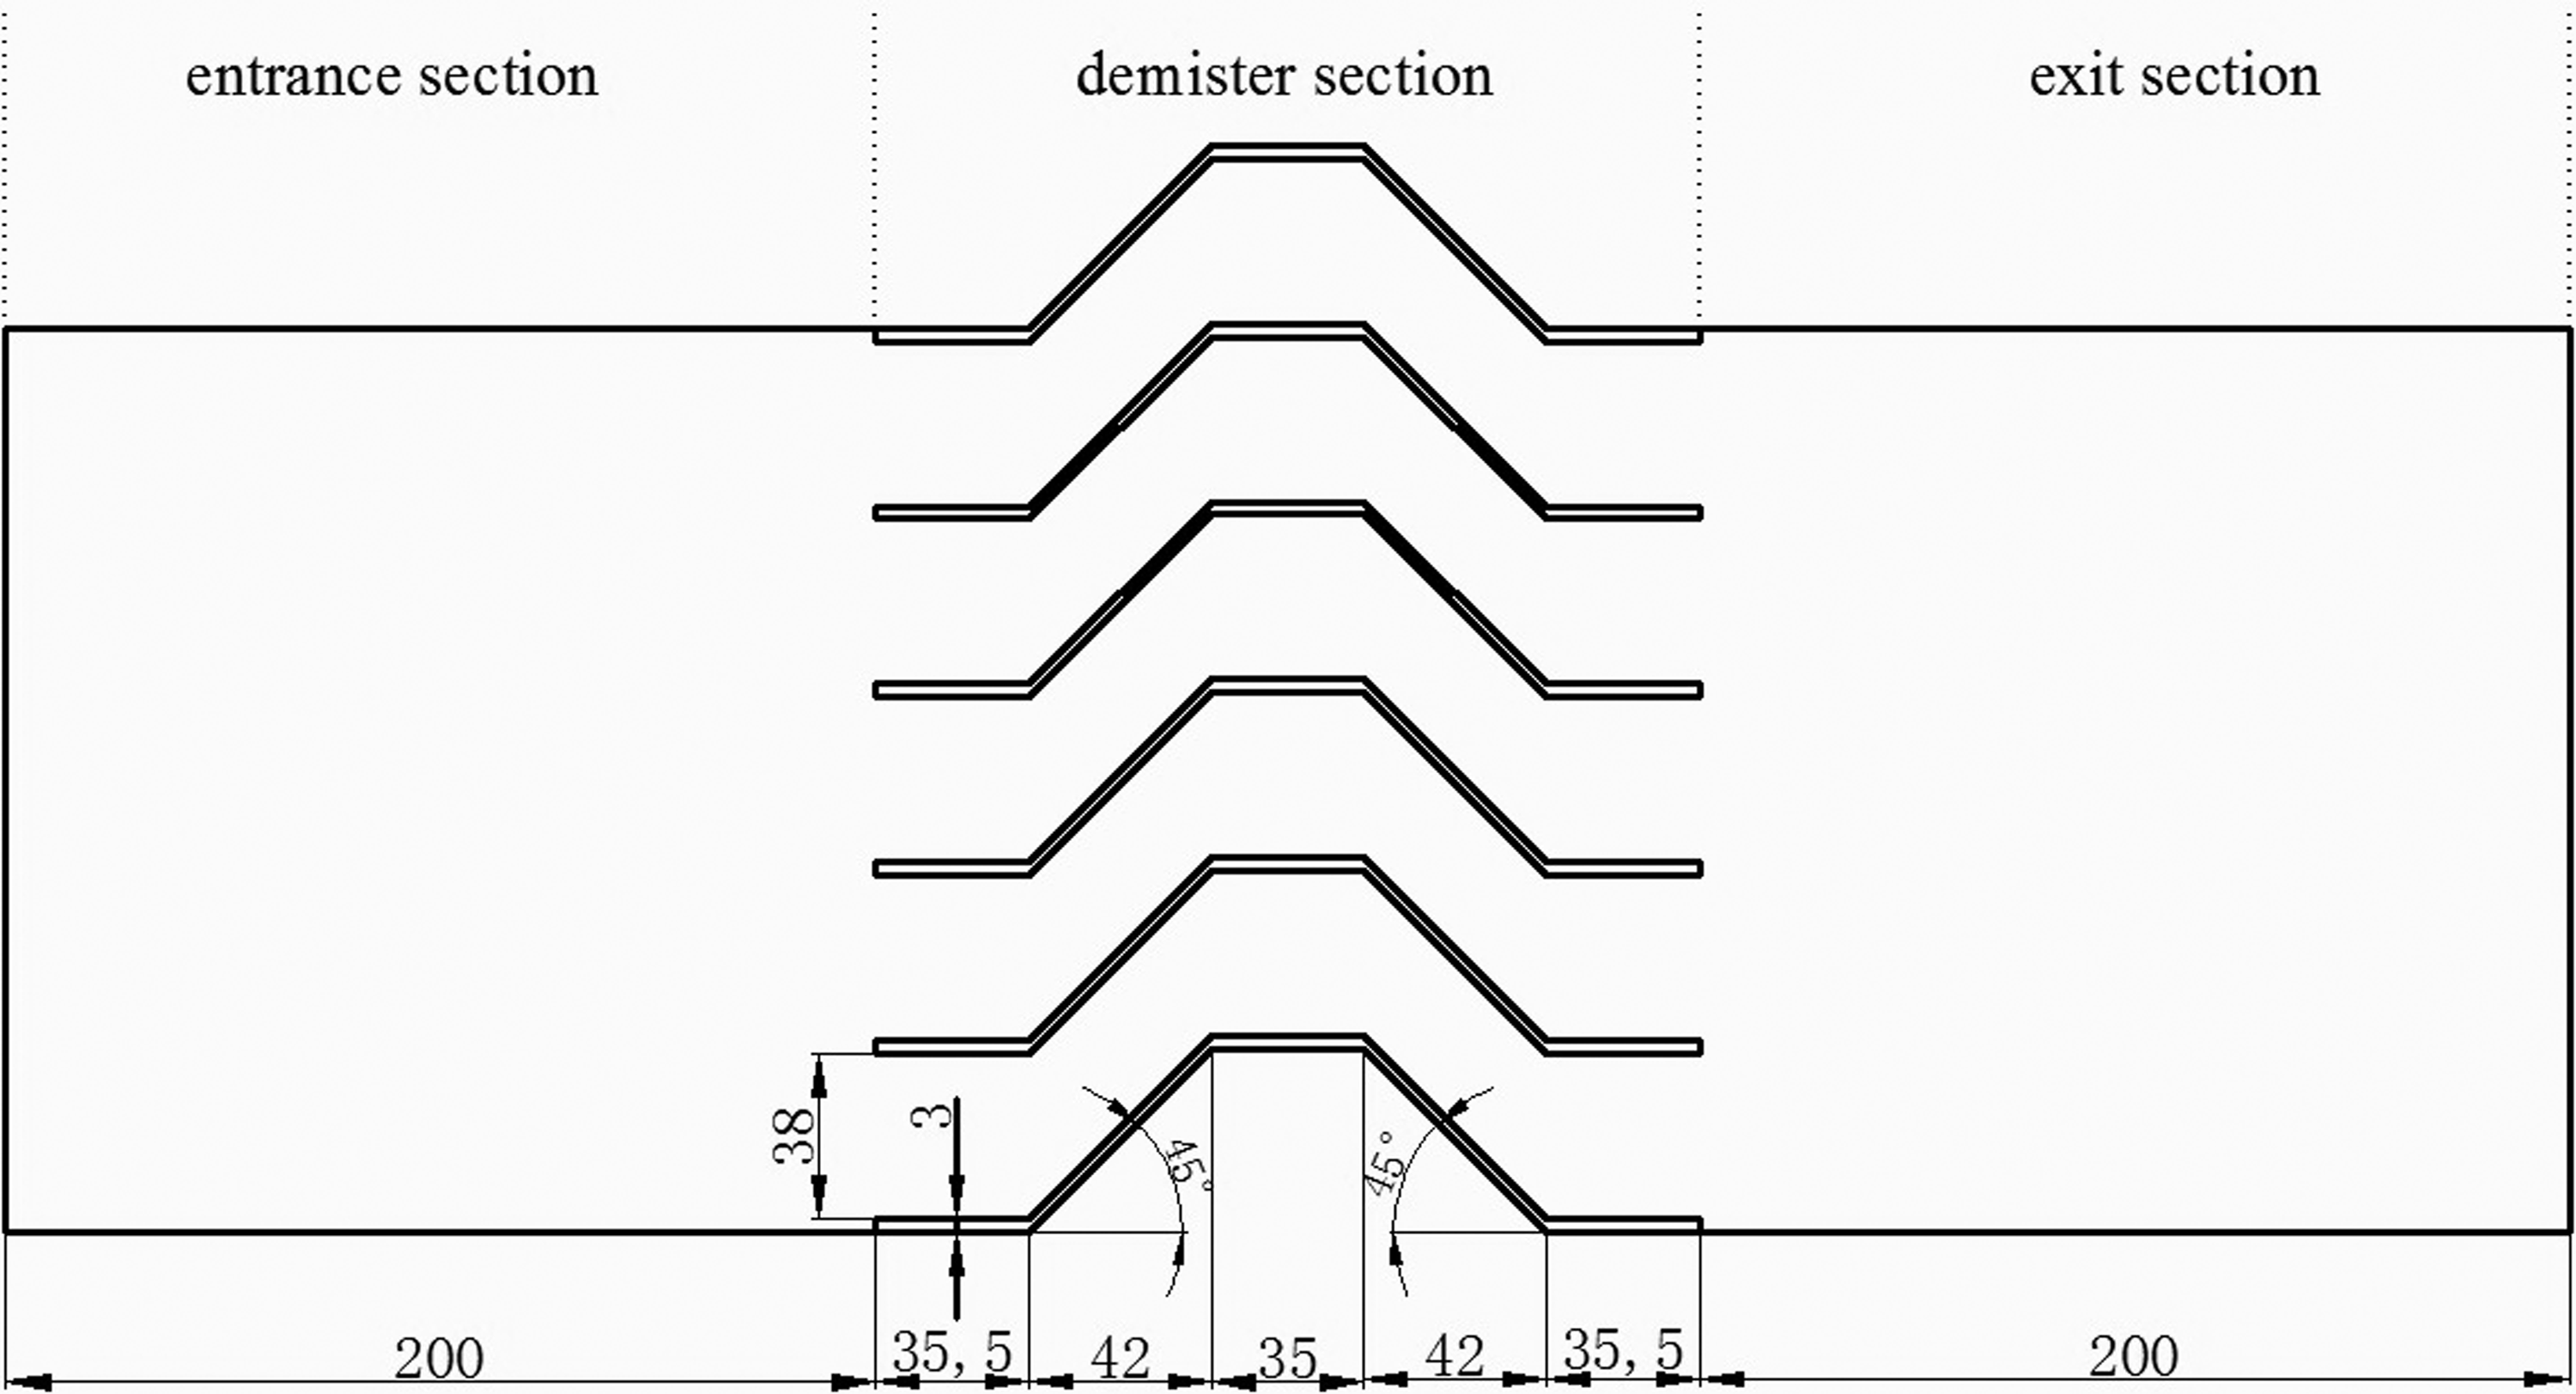
The geometrical parameters of the demister (in mm).
The gas phase is air and the droplet phase is water. The droplet size distribution at the entrance is assumed to follow the Rosin–Rammler (R–R) distribution. Considering the convenience of the grouping and the fact that the droplets produced in the desulfurization tower are mainly in the range of 10–60 μm, the lower and upper bounds in the R–R distribution are, respectively, 7.5 and 62.5 μm. In the referred experiment, two wire mesh layers are added in the upstream of the demister, which makes the droplet size distribute more uniformly. So, the coefficient in R–R distribution is 6.5. The droplets are grouped per 5 μm, and the percentage of the droplet volume is shown in Fig. 2. These groups are numbered from Group 1 to Group 8 according to their sizes. Considering that the cumulative volume fraction corresponding to the droplet size of 47.5 μm reaches to 99.931%, we put all droplets with the diameter larger than 42.5 μm into Group 8. The concentration of the droplets depends on the R–R distribution and the air moisture.

Percentage of the droplet volume.
Mathematical formulation
The standard k-ɛ model is introduced to solve the gas flow field, and the discrete-phase model is applied to calculate the particle trajectory. According to the operating conditions of the model, some reasonable hypotheses are proposed to simplify the model. First, the droplets are regarded as spheres, and the droplets are collected and disappear once colliding with the wall. Second, the secondary atomization and the deformation of droplets are neglected. Third, gravity can be ignored while the drag force and the coalescence of droplets are considered.
Mathematical model of the gas phase
We use the Euler method to describe the gas phase. The air is supposed to be an incompressible fluid at constant temperature.
The continuity equation:
The momentum equation:
The turbulent energy and turbulent dissipation rate:
where
Mathematical model of the droplets motion and the coalescence of droplets
The droplet is treated as discrete phase. The Lagrange method is applied to determine the force and motion of droplets. The drag force is given by
The FD is defined by the proposed drag model (Gidaspow, 1994):
The droplets would inevitably collide and coalesce with other droplets in the moving process. Tsuji et al. (1998) advanced a method of combining the direct simulation Monte Carlo method and soft sphere model to determine the coalescence of droplets when they compared the discrete particle model with the two-fluid model. Then, they improved the Nanbu method based on the binary collision hypothesis in a hard sphere model. Based on this method, the probability of the coalescence of droplet α and β in the time step Δt is given by
The droplets obey the law of mass conservation and momentum conservation when they collide with other droplets. The mass and velocity of the generated droplet are given by
The postprocessing of the simulation results and the exploration of related information
The pictures describing the projective distribution of the droplets are obtained through tracking the droplets of different sizes in this article. Quantitatively, the grade separation efficiency and the droplets concentration of different sizes versus the height of the demister are also obtained by counting the number of droplets of different sizes at different heights.
The difference between the separation efficiency based on the mass concentration and number concentration is analyzed from the coalescence of droplets. This effect is determined by comparing the results with and without considering the coalescence of droplets. Furthermore, we explain the effect from the influence of the coalescence of droplets on the grade separation efficiency.
Verification of the Mathematical Model
The rationality of the simulation results is verified from the perspective of both overall separation efficiency and pressure drop. First, the overall separation efficiency in this work is compared with the experimental results in the reference (Wang, 2009). In the experiment, Wang tested the overall separation efficiency based on the mass concentration under different gas velocities. The parameters in the model are the same with those in the experiment. The calculation conditions are as follows: The gas phase is air with a density of 1.204 kg/m3 and a dynamic viscosity of 1.83 × 10⁻⁵ kg/m · s. The droplet phase is water with a density of 998.23 kg/m3. The air moisture is 0.05 kg/m3. The mean diameter of droplets is 33.08 μm, and the gas bulk velocity is between 3 and 7 m/s. The comparison between the experimental results and simulation results of overall separation efficiency versus the gas velocity is shown in Fig. 3. The simulation results are consistent with the experimental results except at high gas velocity. As described in the experiment, the secondary atomization starts to be apparent under high gas velocity, which is likely to be the reason for the deviation of the experimental results and simulation results.

Overall separation efficiency based on the mass concentration.
Second, the pressure drop in our work is also compared with the works of Zhao et al. (2004) and Yang et al. (2005) under the same conditions. The comparison is shown in Fig. 4. Although there is a certain difference between their results, our work still coincides with their results within a reasonable range. In conclusion, the model constructed can be applied to the research on the separation efficiency of the demister in the range of considered gas velocities.
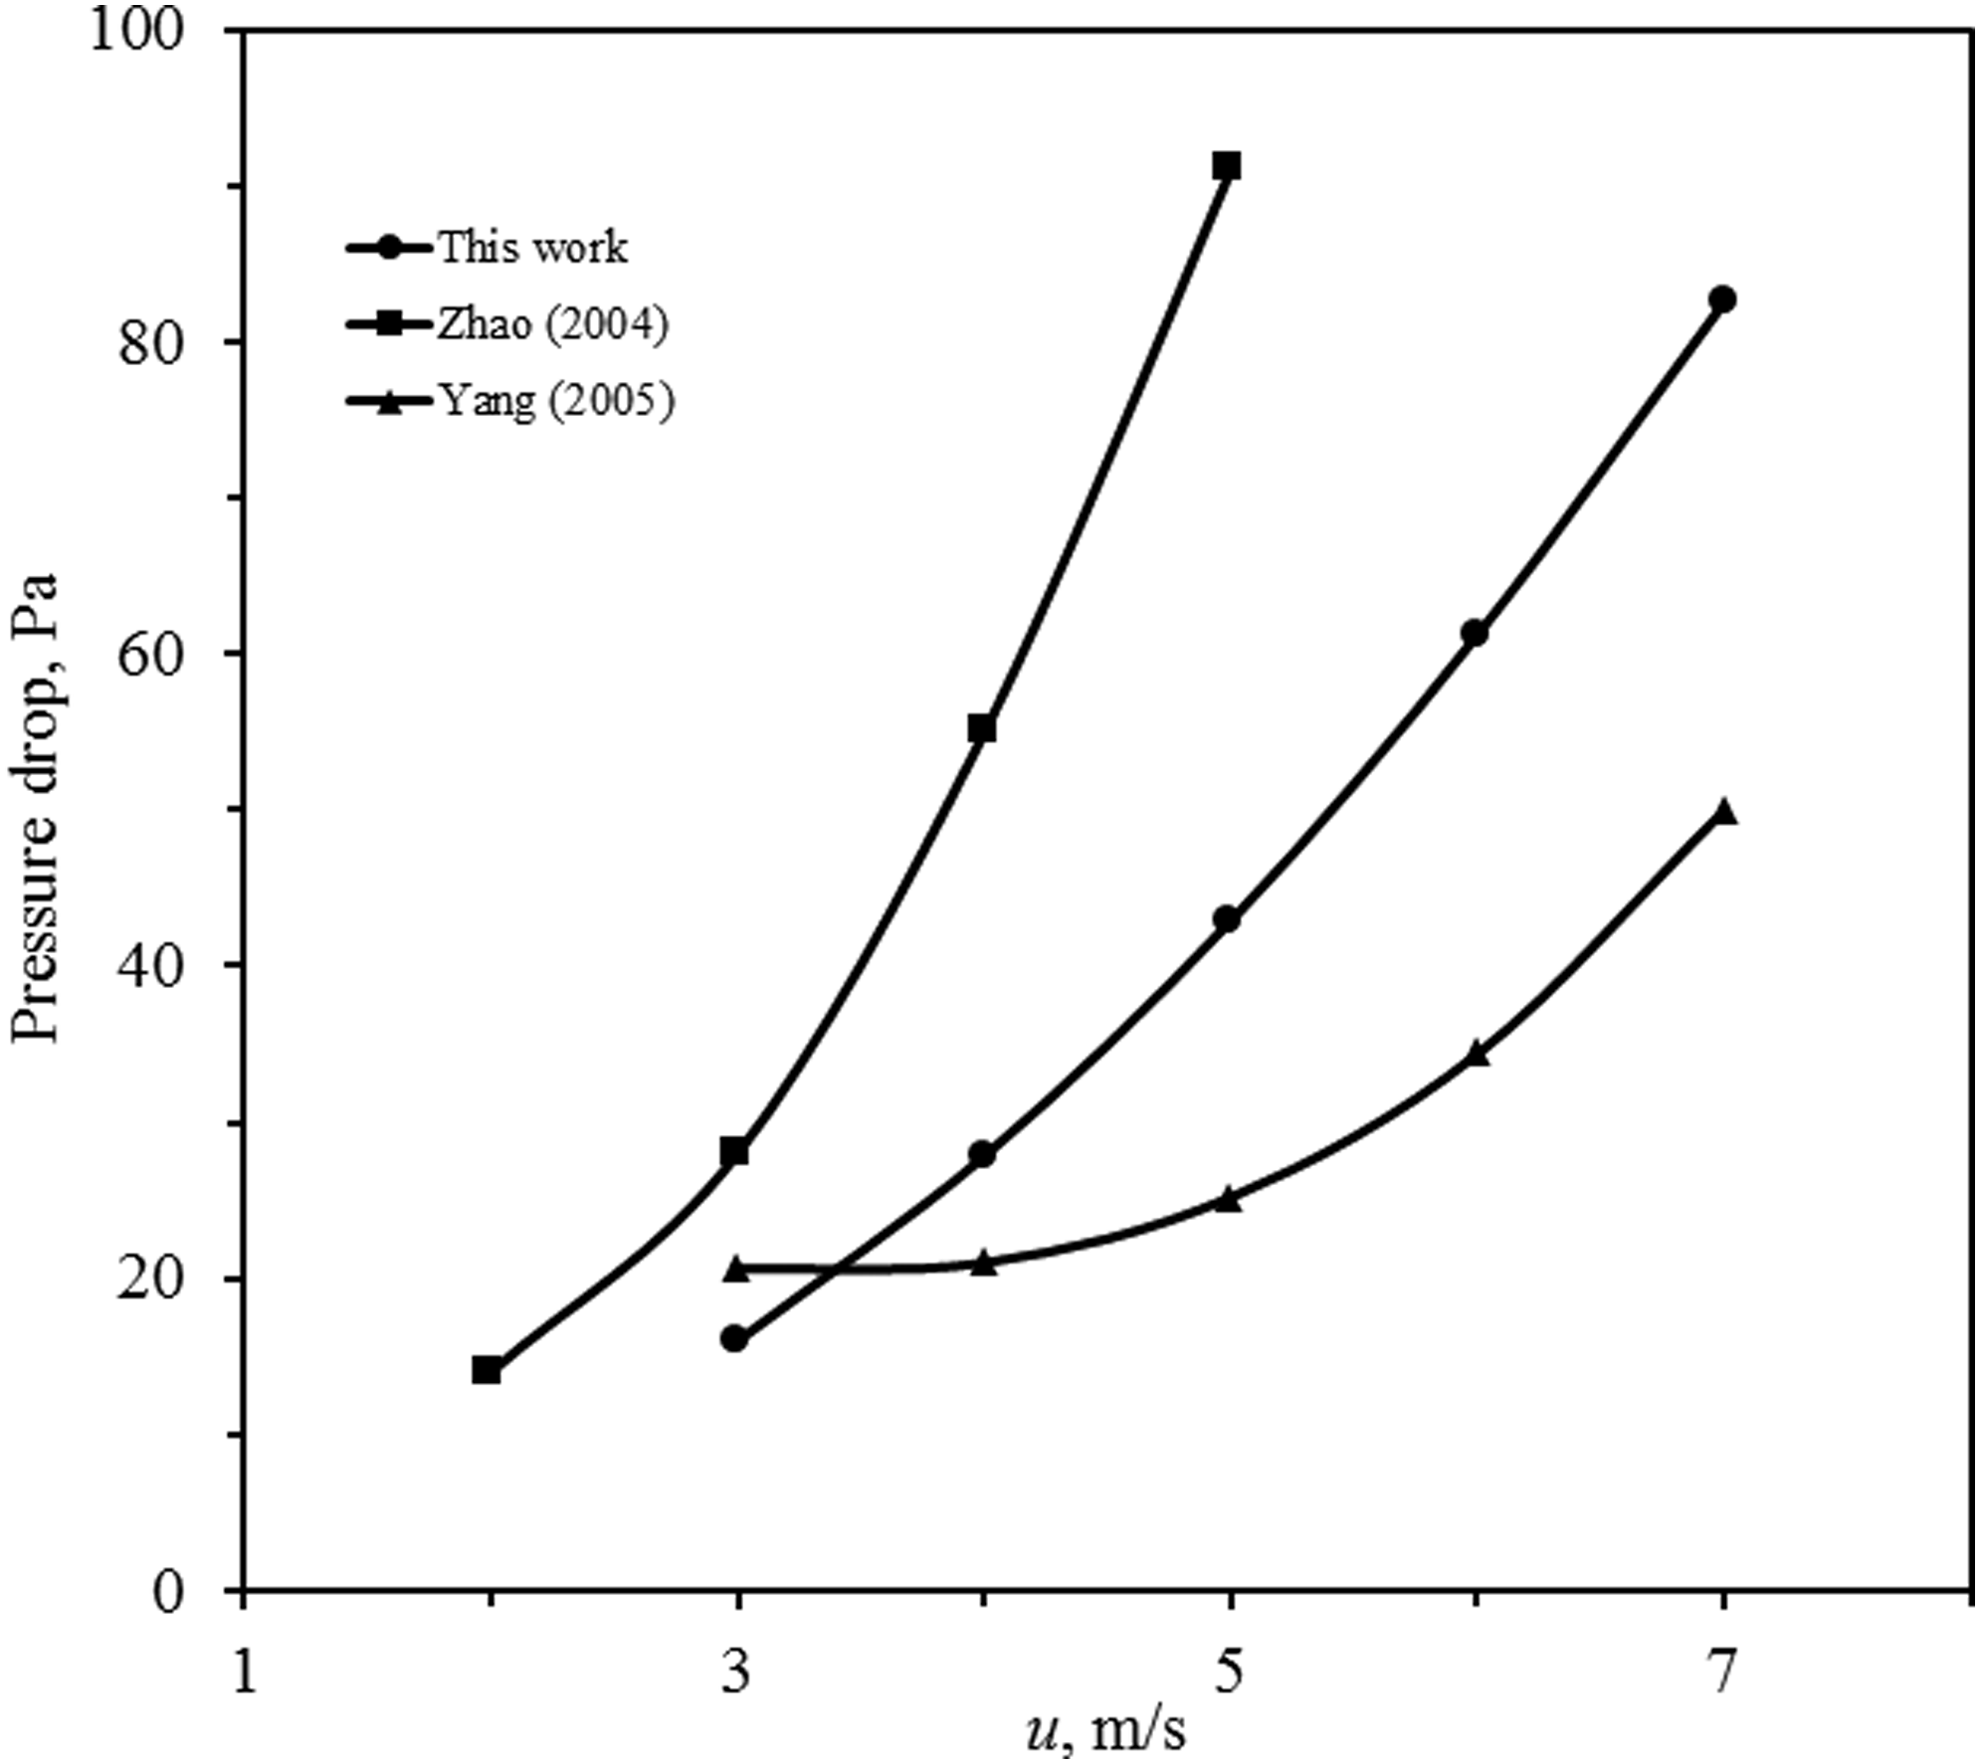
Pressure drop.
The Penetration of Droplets of Different Sizes
The droplets concentration of different sizes versus the height of the demister
The projective distribution of the droplets under steady state is shown in Fig. 5 with a gas velocity of 5 m/s. Different colors represent different ranges of droplet sizes as follows: red: 7.5–17.5 μm; yellow: 17.5–27.5 μm; green: 27.5–37.5 μm; black: 37.5–42.5 μm; blue: 42.5–47.5 μm; magenta: the generated droplets by the coalescence of droplets. The view is shown in two dimensions, which means the droplets are projected into a plane. There are entrance section, demister section, and exit section going from the top to bottom. The size distribution of dust can be accurately measured, whereas the measurement of the droplets is still unresolved. It is hard to obtain the variation of the droplets concentration of different sizes versus the height of the demister by the experimental method. Nevertheless, the simulation method can easily solve the problem and it is shown in Fig. 6.

The projective distribution of the droplets and the pictures of partial enlargement with gas velocity of 5 m/s.

Droplet concentration of different sizes versus the height of the demister with a gas velocity of 5 m/s.
In Fig. 5, qualitatively compare the droplets in the exit section with that in the entrance section, there are still large numbers of droplets uncollected and they are all small droplets. Seen from the demister section, large droplets are all collected in the first and second bends. During the entire moving process, the number of generated droplets is increased compared with the initial number, which indicates that the coalescence of droplets happens at all sections.
In Fig. 6, quantitatively, the droplets concentration of different sizes sharply decreases in the demister section, especially for large droplets. The larger the diameter, the faster it decreases. It indicates that the ability to collect large droplets is stronger than small droplets. The decrease mainly happens in the two bends, and the decrease in the second bend is more evident than that in the first bend because the change of the flow field in the second bend is severer than that in the first bend. In addition, the relative percentage compared with the initial concentration of the droplets between 42.5 and 47.5 μm increases in the entrance section and the first two straight panels of the demister section, and it exceeds 100%. This is because the small droplets collide with other droplets and convert into large droplets. As the initial concentration of the droplets between 42.5 and 47.5 μm is very small, a small amount of small droplets colliding can lead to a significant increase in the concentration of the droplets in this range. It can reach to a maximum of 141%. Besides, the concentration of the droplets tends to increase in the first and second vertical sections of the demister with the increase of droplet size. The trend between 37.5 and 47.5 μm is especially obvious, which is caused by the narrower flow channel in these two sections because of the thickness of the demister blades and the change of gas velocity. It leads to an increase of the number concentration in the per unit volume, which increases the probability of the coalescence of droplets, and a large number of small droplets convert into large droplets.
The overall separation efficiency
According to Figs. 3 and 6, the separation efficiency based on the mass concentration is sufficiently high. However, there are still a considerable number of droplets uncollected by the demister. The separation efficiency based on the mass concentration and number concentration is shown in Fig. 7. The two kinds of efficiency are given by
The separation efficiency based on the mass concentration is high in Fig. 7. The efficiency reaches to 80% when the gas velocity is higher than 4 m/s and the maximum exceeds 90%. However, the separation efficiency based on the number concentration is on average 15.8% lower than the separation efficiency based on the mass concentration at the same gas velocity. It can be inferred that it is related to the grade separation efficiency by analyzing Fig. 6.

Comparison between the separation efficiency based on the mass concentration and number concentration.
The grade separation efficiency
The grade separation efficiency is the separation efficiency of size in a specific range. It is given by
The grade separation efficiency is shown in Fig. 8. The efficiency between 37.5 and 47.5 μm is mainly more than 90%, whereas it sharply decreases with the decrease in droplet size between 22.5 and 37.5 μm. The phenomenon indicates that there are so many small droplets uncollected. The density of the droplets is bigger than the density of the gas, which makes the droplets deviate to the demister blades. For the larger droplets, the inertial force is bigger and the separation is more evident. Owing to the low mass percentage of the small droplets, the overall separation efficiency based on the mass concentration is still very high. It is exactly the reason for the difference between the separation efficiency based on the mass concentration and number concentration, as shown in Fig. 7.

Grade separation efficiency.
The separation efficiency of droplets between 22.5 and 37.5 μm is proportional to the gas velocity because the inertial force of droplets increases faster than the gas with the increase of gas velocity. Nonetheless, the efficiency is only about 30%, and the trend of the grade separation efficiency versus the gas velocity changes between 7.5 and 22.5 μm. The separation efficiency between 7.5 and 22.5 μm tends to decrease with the increase of gas velocity, and it is especially evident when the gas velocity is 3 m/s. Furthermore, we would explain this phenomenon below. For the abnormal decline of the droplets of 45 μm when the gas velocity is 3 m/s, it is the result of the coalescence of small droplets.
The influence of the coalescence of droplets on the performance of the demister
As is shown in Fig. 9, whether considering the coalescence of droplets or not, both kinds of efficiencies increase with the increase of gas velocity. The difference is the efficiency considering that the coalescence of droplets is consistently higher than that without considering the coalescence. It is interesting to see that the difference between two efficiencies based on the number concentration is more evident compared to that based on the mass concentration. It is also observed that whether based on the number concentration or mass concentration, the difference between the efficiency considering the coalescence and the efficiency without considering the coalescence is reduced with the increase of gas velocity.

Influence of the coalescence of droplets on the overall separation efficiency: based on the
The influence of the coalescence of droplets on the grade separation efficiency is shown in Fig. 10. The efficiency considering the coalescence is higher than the efficiency without considering the coalescence in the range between 7.5 and 22.5 μm, whereas the difference for the droplets larger than 22.5 μm is not evident. The reason is that the coalescence between the small droplet and large droplet can only convert into large droplet, and the coalescence between the small droplet and small droplet may also convert into large droplet. Consequently, the influence of the coalescence on the small droplets is more evident than that on the large droplets. Furthermore, it is exactly the reason for the abnormal decline between 7.5 and 22.5 μm in Fig. 8. In addition, as shown in Figs. 5 and 6, most of the droplets downstream the second bend are small droplets. For a fixed overall inlet droplet concentration, combining with Equation (10), higher small droplets inlet concentration brings higher concentration of small droplets in these sections and it contributes to a bigger probability of coalescence of small droplets, which enables a higher grade separation efficiency of small droplets as there will be a second demister downstream the primary demister to capture the larger generated droplets. Because of the low mass percentage but a high number percentage of the small droplets, the difference between two kinds of efficiencies based on the number concentration is more evident compared to that based on the mass concentration, as shown in Fig. 9. The difference between the grade separation efficiency considering the coalescence and that without considering the coalescence is also going to be narrower with the increase of gas velocity. As the residence time of droplets decreases with the increase of gas velocity, the probability of the coalescence of droplets is lower for the fixed-length model.
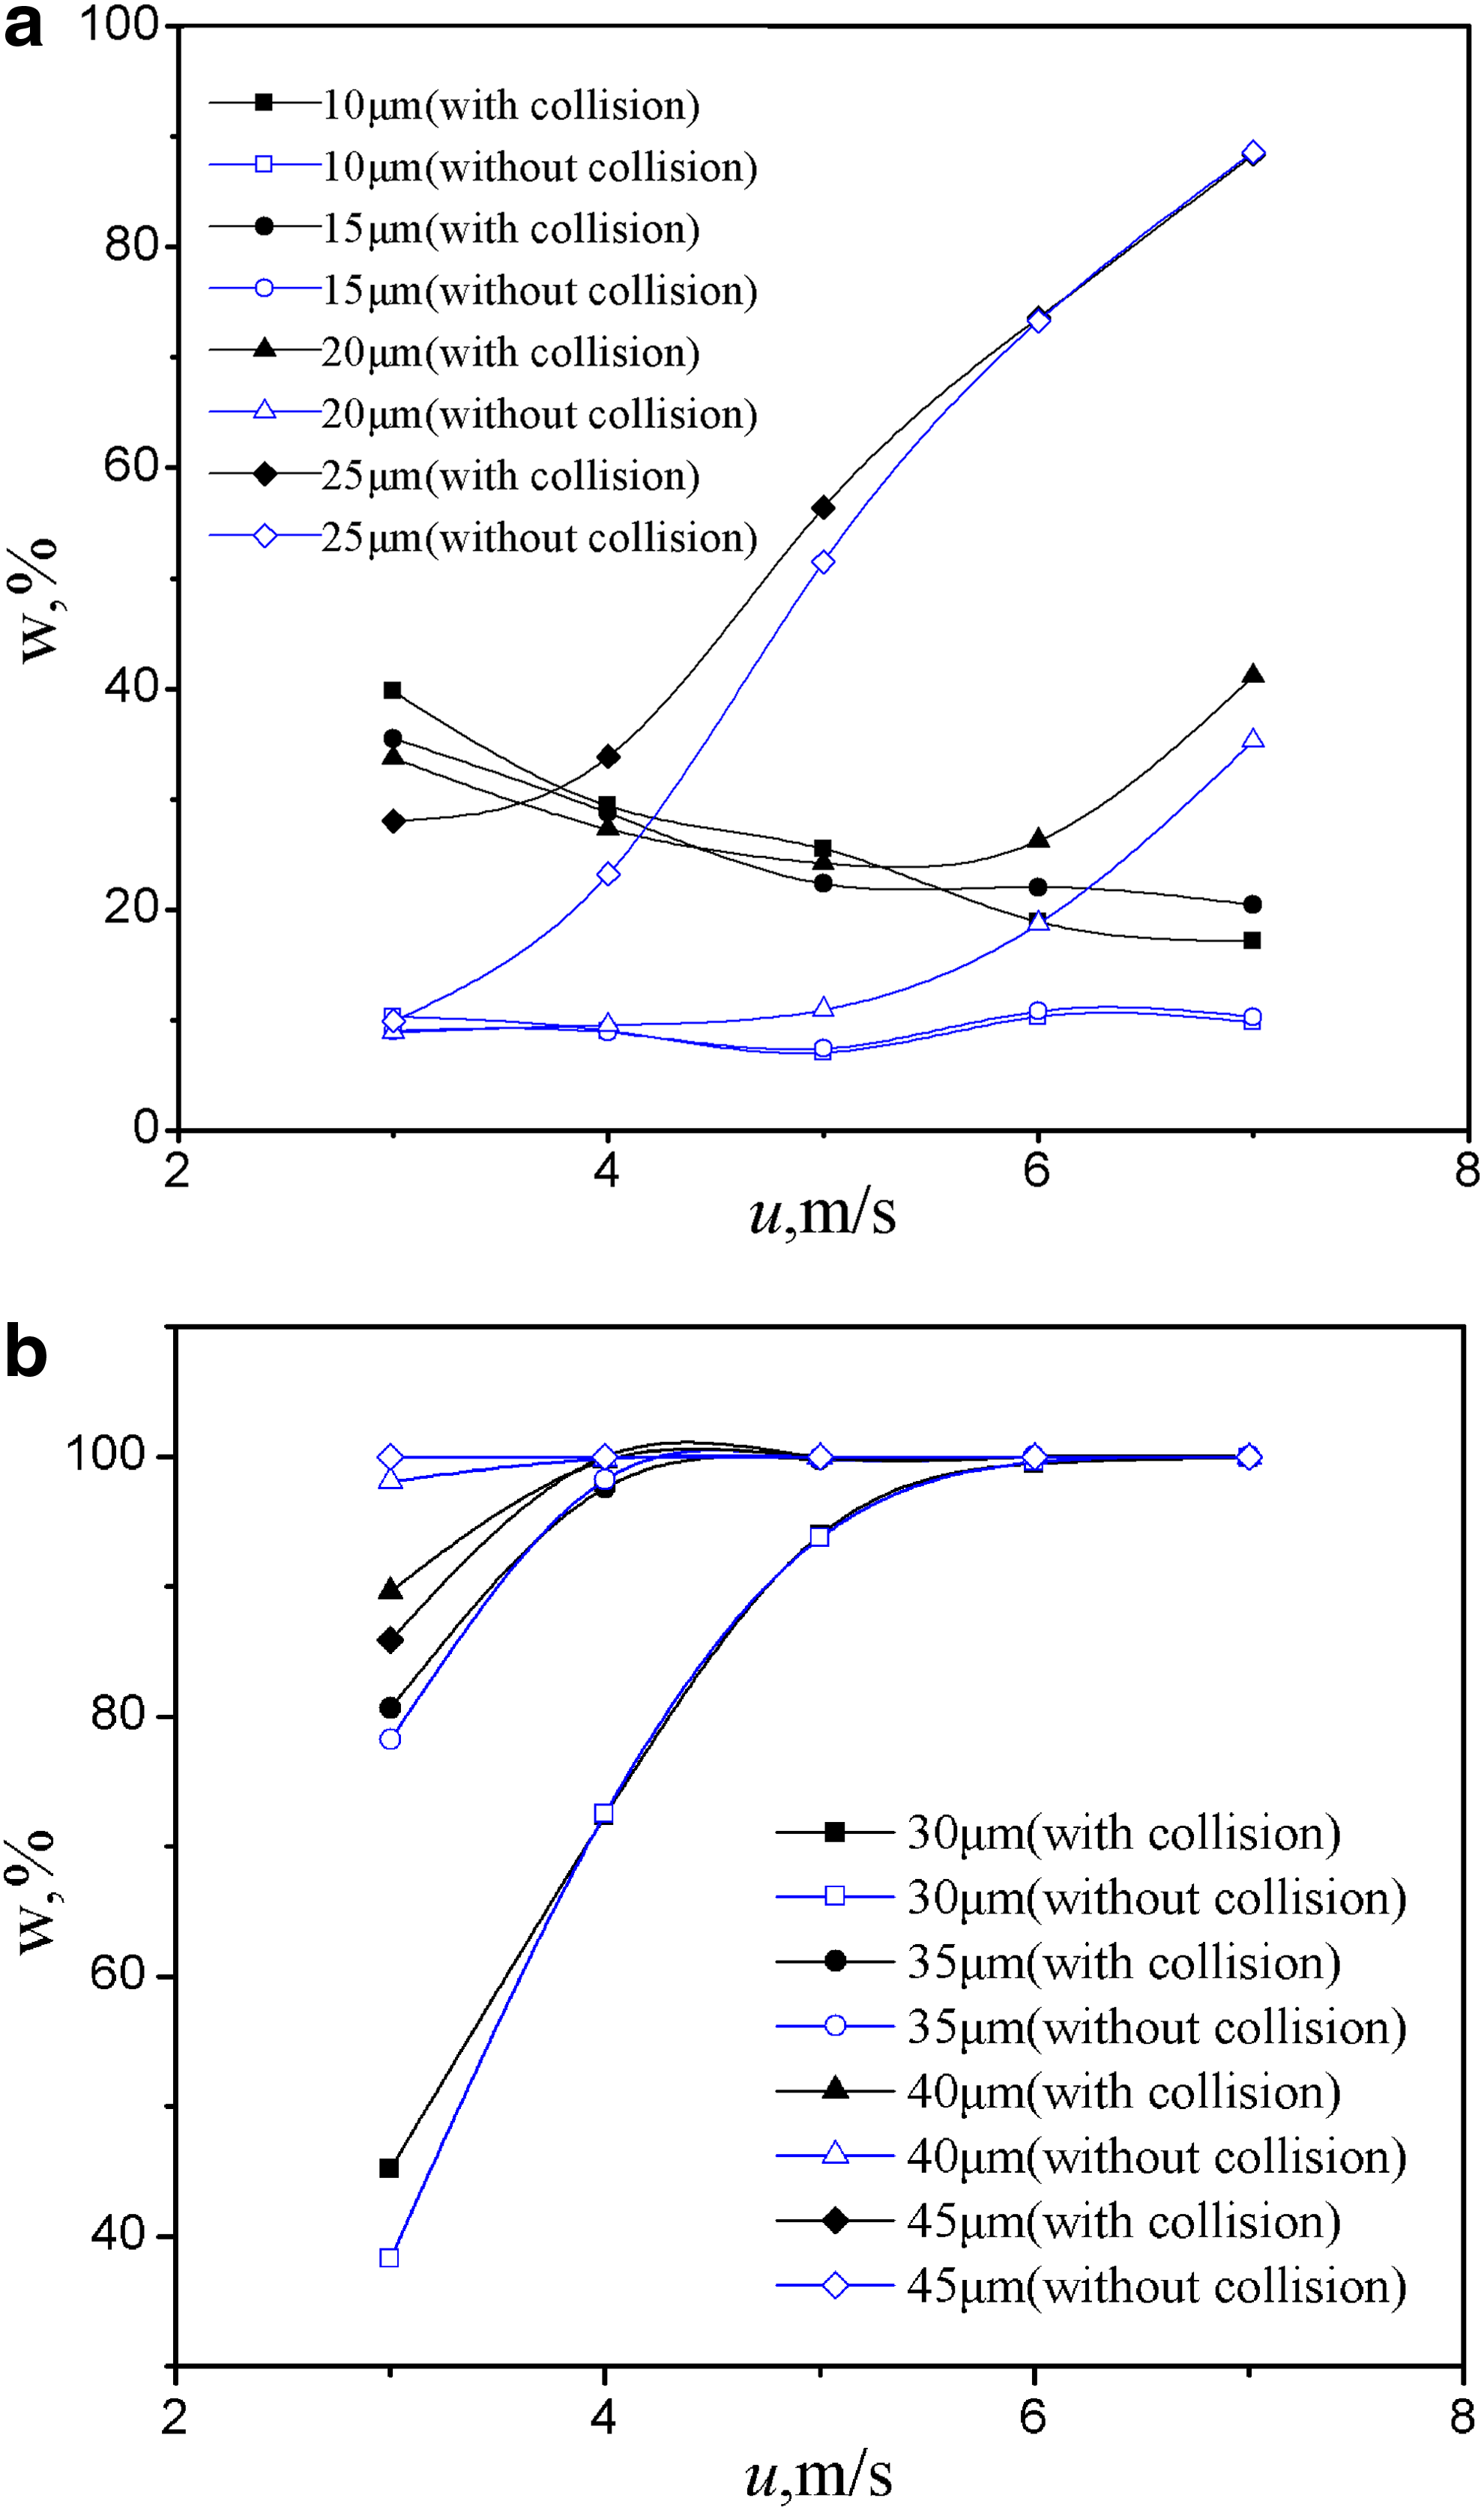
Influence of the coalescence of droplets on the grade separation efficiency:
The grade separation efficiency versus the dimensionless Stokes number
To apply our work to other designs, we integrate all parameters, including the gas velocity and droplet diameter, into the dimensionless Stokes number. Then, we use the Stokes number to collapse grade separation efficiency results into a single curve, and a fitted equation is derived from our work. Finally, the Stokes number is calculated on the basis of the results of James et al. (2003) and Hao et al. (2014) and compared with them. The dimensionless Stokes number is given by
The grade separation efficiency versus the dimensionless Stokes number is shown in Fig. 11. According to the fitted curve of our work, the grade separation efficiency is only about 26% when the St is <0.12. Then, the efficiency sharply increases to 100%, with the increase of St in the range of 0.12–0.45, as the ability to follow the streamlines for the droplets becomes worse when the St increases. So, the droplets can be more easily collected, which makes the efficiency higher. The efficiency keeps at 100% when the St is higher than 0.45. The curve can be expressed as
Because of the finite published data under the same conditions, we compare the fitted curve of our work with the results of James et al. (2003) and Hao et al. (2014). Although there is no parallel plate between two adjacent bends in the work of James, we think the results can also be comparative. As shown in Fig. 11, the results of James et al. (2003) are well consistent with the fitted curve of our work. Although the results of Hao et al. (2014) have a certain deviation compared with our work, the trend of their results is the same with ours. For example, both grade separation efficiencies sharply increase from the minimum to 100% when the St is higher than 0.12. In conclusion, the fitted curve and fitted equation are reasonable and can be applied to other works.
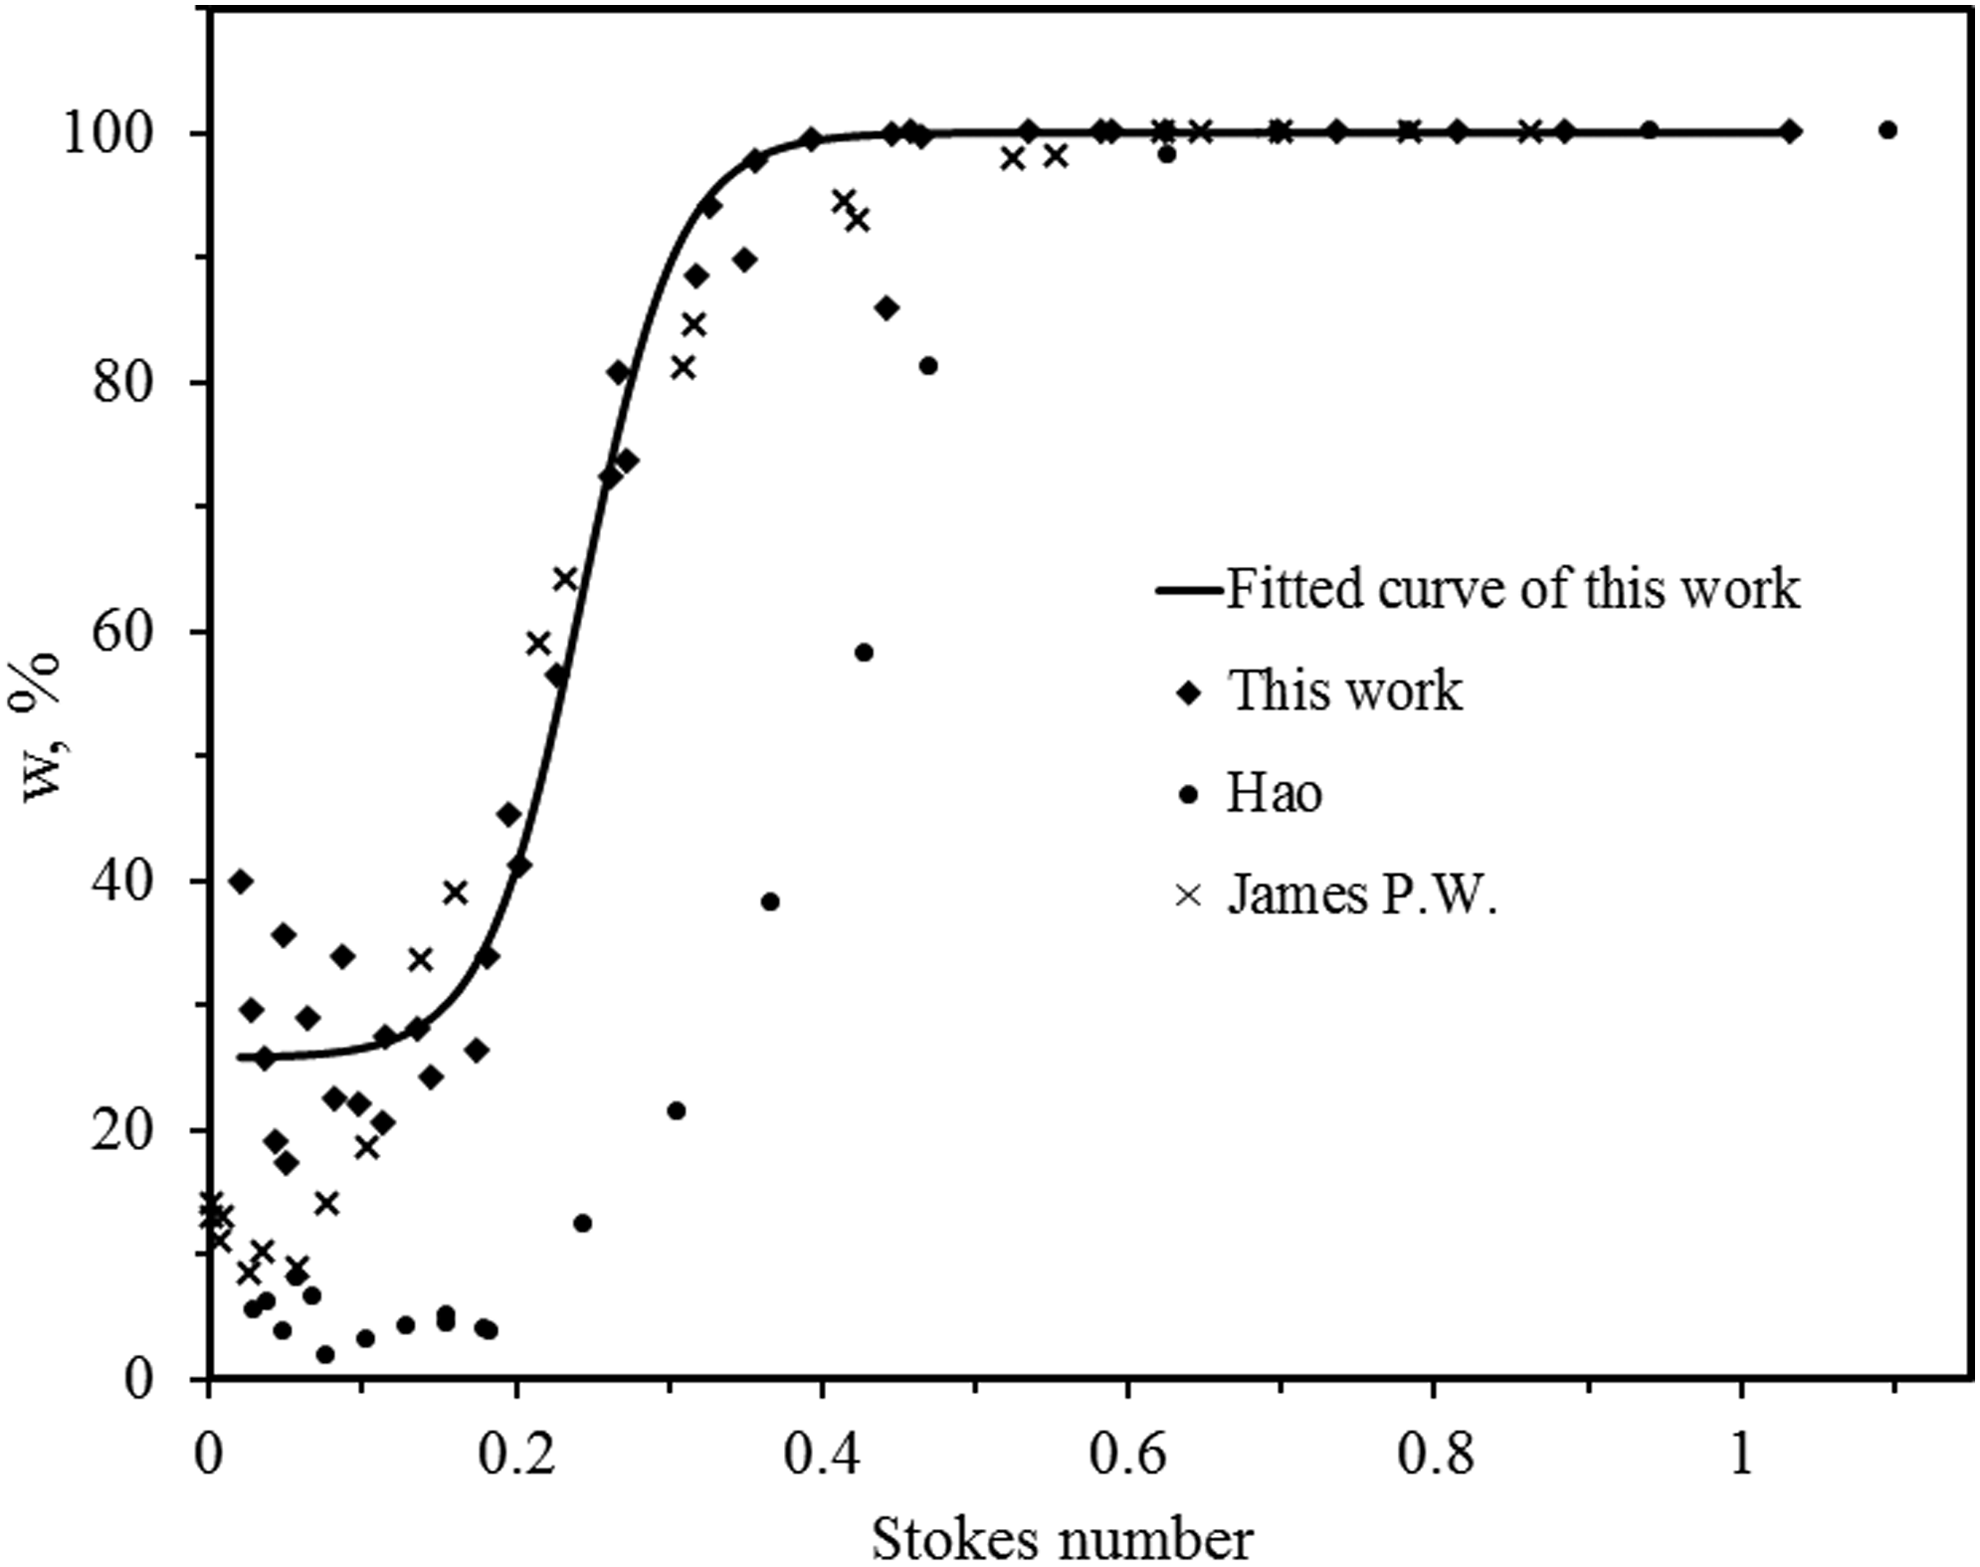
The grade separation efficiency versus the dimensionless Stokes number.
Conclusions
Considering the coalescence of droplets, the droplets motion is tracked. The rationality of the model is verified by comparing experimental results with the simulation results. The following conclusions are obtained within the gas velocity range considered.
1. The simulation results are consistent with the experimental results, which indicate the model constructed can be applied to the research on the separation efficiency of the zigzag demister, and the penetration of droplets can be accurately reflected.
2. The separation efficiency based on the mass concentration reaches to 80% when the gas velocity is higher than 4 m/s. But the separation efficiency based on the number concentration is lower. Because of the low-grade separation efficiency of small droplets, the overall separation efficiency based on the number concentration is on average 15.8% lower than that based on the mass concentration under the same gas velocity.
3. The grade separation efficiency between 37.5 and 47.5 μm is higher than 90%, whereas it is sharply reduced with the decrease of droplets size between 22.5 and 37.5 μm.
4. The grade separation efficiency between 22.5 and 37.5 μm is proportional to the gas velocity, whereas it reverses between 7.5 and 22.5 μm.
5. The grade separation efficiency is mainly affected by the coalescence of droplets between 7.5 and 22.5 μm, whereas it is mainly affected by the collision with demister blades for the droplets larger than 22.5 μm, which indicates that we can improve the separation efficiency of small droplets through increasing the probability of the coalescence of droplets.
6. The grade separation efficiency sharply increases from 26% to 100% when the St increases from 0.12 to 0.45. The relation between the grade separation efficiency and St can be expressed as Equation (17).
Footnotes
Acknowledgments
The research is supported by the National Key Basic Research Program of China (No. 2013CB228505), the Major Program of National Natural Science Foundation of China (No. 51390492), and the Key Laboratory of Coal Gasification and Energy Chemical Engineering of Ministry of Education, China. The authors wish to express their gratitude.
Author Disclosure Statement
No competing financial interests exist.
Nomenclature
u, gas velocity (m/s)
t, time (s)
p, pressure (N/m2)
k, turbulent energy (m2/s2)
m, droplet mass (kg)
FD, viscosity coefficient
CD, drag coefficient
uP, droplet velocity (m/s)
DP, droplet diameter (m)
Re, droplet Reynolds number
Pαβ, probability of the coalescence of the droplets
nβ, number concentration of the droplets
Gαβ, relative velocity between droplets (m/s)
Δt, time step (s)
W1, overall separation efficiency based on the mass concentration
W2, overall separation efficiency based on the number concentration
m′, mass of the collected droplets per unit time (kg/s)
M′, mass of the droplets added to the model per unit time (kg/s)
n′, number of the collected droplets per unit time (s−1)
N′, number of the droplets added to the model per unit time (s−1)
w, grade separation efficiency
m″, mass of the collected droplets in a specific range per unit time (kg/s)
M″, mass of the droplets added to the model in a specific range per unit time (kg/s)
L, distance between two adjacent plates (m)
Greek Letters:
ρ, density of the gas (kg/m3)
μ, dynamic viscosity (N · s/m2)
ɛ, turbulent dissipation rate (m2/s3)
μt, turbulent dynamic viscosity (N · s/m2)
σk, σɛ Prandtl number corresponding to the turbulent energy and turbulent dissipation rate
η, volume fraction of the droplets
ω, air moisture (kg/m3)
ρP, density of the water (kg/m3)
Subscripts:
i, j, spatial coordinate indices
P, droplet phase
α,β, droplet indices