
Abstract
Abstract
When attempting to reduce lead solubility by lowering the finished water pH in Providence, RI, from ∼10.3 to 9.7, consumer red water complaints and overall lead levels increased, prompting bench-scale tests and intensive field sampling into possible associations between higher particulate iron and particulate lead. At pH 10.3, iron release to water was as much as 35% lower in bench-scale tests and 99% lower in field samples compared with pH 9.7. Lower levels of particulate iron released at higher pH, translated to lower levels of particulate lead release after contacting downstream plumbing in bench testing. Although a significant decrease in distribution system iron at pH 10.3 did not immediately translate to decreased lead levels at all field sampling sites, complementary laboratory and field studies demonstrate that lead corrosion control is sometimes strongly linked to iron corrosion control.
Introduction
R
Exactly how particulate lead is formed and released to water is relatively poorly understood, and quantification of this problem is highly sensitive to nuances of sampling, including the flow rate during sampling (Reiber et al., 1997; Triantafyllidou and Edwards, 2012; Clark et al., 2014). Obviously, the durability and adherence of lead rust/scale to pipes is one key factor, although as a practical matter little is known about factors that control these characteristics (McNeill and Edwards, 2004). Anecdotally, several studies have identified links between high levels of particulate lead and particulate iron in both natural and engineered systems, suggesting that mitigation of particulate lead problems might sometimes be associated with reducing other particulates present in the distribution system (Hulsmann, 1990; Erel et al., 1991; De Rosa and Williams, 1992; Erel and Morgan, 1992). More recent studies have elucidated more definitive links between elevated particulate lead and particulate iron in drinking water (HDR, 2009; Deshommes et al., 2010; Camara and Gagnon, 2012; Triantafyllidou and Edwards, 2012; Camara et al., 2013; Knowles et al., 2015; Schock et al., 2014). Given that more than a quarter of the distribution system in the United States is unlined iron (Baird, 2011), a better understanding of the potential link between lead and particulate iron is important.
Links between Pb:Fe in natural and engineered systems
Erel et al. (1991) and Erel and Morgan (1992) found that naturally occurring lead in the Sierra Nevada watershed was sorbed by particulate iron oxide surfaces at a relatively consistent rate. The authors speculated that the mechanism of removal by sorption resulted in a correlation between iron and lead particulates. It is logical to think that a similar phenomenon may also occur in certain lead service lines (LSLs) when particulate iron is either present in the distributed water or formed in the distribution system by corrosion of iron water mains. Field studies conducted by the WRc Group in the United Kingdom, in 1987, found that elevated particulate lead levels were associated with elevated levels of particulate iron and organic matter (Hulsmann, 1990; De Rosa and Williams, 1992). Water supplied in these areas had low alkalinity, low hardness, discoloration, high concentrations of natural organic matter, and poor pH control (Hulsmann, 1990; De Rosa and Williams, 1992). It was speculated (De Rosa and Williams, 1992) that particulate iron released from mains was transported to LSLs, where dissolved lead was adsorbed to the surface of iron particulates. The iron with sorbed lead may then be mobilized or released to potable water by turbulence when the consumer draws water, resulting in excess lead in the water relative to that which would be present by dissolution alone. This particulate lead problem was eventually solved by measures that reduced particulate iron, including the use of corrosion inhibitors and systemic cleaning of the distribution system (Hulsmann, 1990). Although the link between iron corrosion and particulate lead problems was only circumstantial, this study raised prospects that lead corrosion issues must sometimes be solved by reducing iron corrosion.
Similar findings were made in 2008, when the District of Columbia Water and Sewer Authority found that at least 75% of homes that exceeded the lead action level for either first or second draw samples also had elevated levels of iron (i.e., >79 ppb) (HDR, 2009). It was hypothesized that galvanized iron pipes installed in homes during the mid-twentieth century could be a persistent source of high lead even after the removal of the LSL (McFadden et al., 2011). Studies by Deshommes et al. (2010) of random daytime samples collected from 45 homes with LSLs also found situations in which particulate lead and particulate iron from the distribution system were correlated (R=0.58). More recently, researchers using a Dalhousie pipe loop found that particulate iron from iron corrosion in the distribution system caused more lead release from the 50/50 Pb/Sn solder in simulated home plumbing (Camara and Gagnon, 2012). The researchers hypothesized that the release of iron rust to the lead-soldered copper pipes, with subsequent sorption of lead to the iron and then entrainment into flowing water, was a viable explanation for these observations. The authors also conducted bench-scale adsorption tests demonstrating very strong sorption of lead to iron oxides, including magnetite and goethite, confirming a mechanistic basis for this hypothesis. Camara et al. (2013) also found trends similar to that of the WRc Group, in that areas served by tuberculated cast-iron mains had increased lead release in homes. Other iron solids transported to lead plumbing, including those from carryover of ferric coagulant from water treatment processes, have also been associated with mobilization of lead (Knowles et al., 2015).
The case of Providence, RI, highlights research need
Before 2005, Providence Water was close to, but always under, the US EPA Lead and Copper Rule (LCR) action level. Desktop studies based on conventional lead corrosion control by minimizing lead solubility predicted that lead release would be further reduced by decreasing the pH from ∼10.3 to pH ∼9.7. Unfortunately, when this change was implemented the opposite trend was observed (Fig. 1) (Rego and Schock, 2007). Concomitant with the higher lead in water was a noticeable increase in red water consumer complaints due to higher iron levels from more than 500 miles of unlined cast-iron (O'Neill, 2013; Providence Water, 2013), highlighting gaps in understanding the interplay between iron corrosion and lead corrosion control, especially in high-pH and low-alkalinity water. To bring the finished water chemistry closer to the theoretical optimum for lead solubility in terms of pH and dissolved inorganic carbon, a carbon dioxide feed system was put into service in April 2011 (O'Brien and Gere Engineers, Inc., 2014).
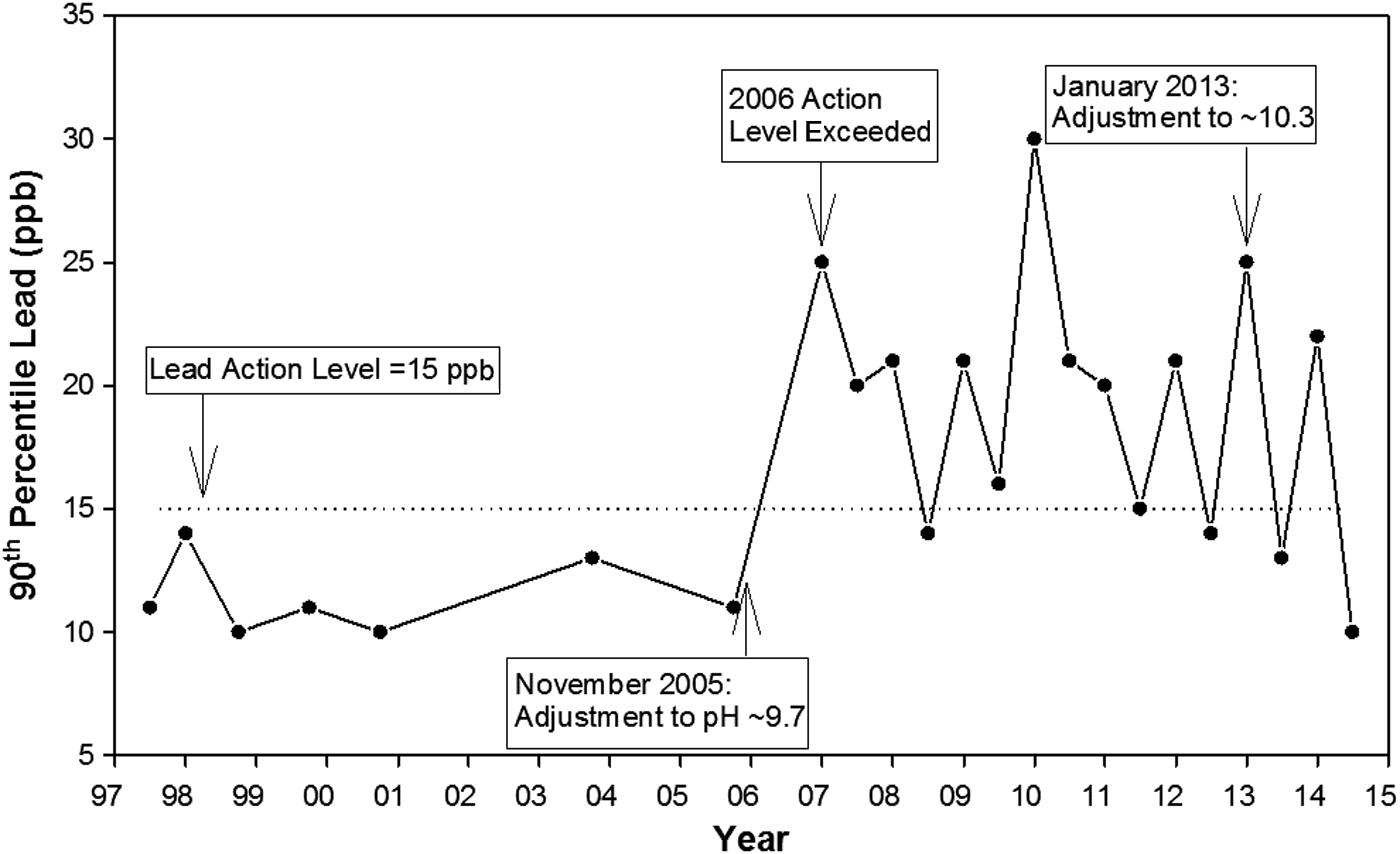
Providence, RI, Lead and Copper Rule compliance between 1997 and 2014. Beginning in 2006, after lowering pH from 10.3 to 9.7, there was a significant increase in the 90th percentile lead levels.
The objective of this research was to examine links between iron and particulate lead release to potable water at laboratory and field scale. As part of the overall evaluation, field samples were collected from homes in the Providence, RI, distribution system before and after the changes in corrosion control in June 2011 and August 2013 to assess trends in soluble and particulate metal release as a function of the water flow rate.
Materials and Methods
Profile sampling
Typical finished water quality conditions present in Providence during 2011 and 2013 indicate high-pH (>9.5) and low-alkalinity (<26 mg/L as CaCO3) distributed water consistent with corrosion control targets in each time frame (Supplementary Table S1). Conventional profiling involves the collection of sequential tap water samples at a fixed flow rate after a minimum of a 6-h stagnation event. A new profile sampling protocol developed by Clark et al. (2014) was employed in the field. The protocol involves collecting sets of samples at low, moderate, and then high flow rates. Comparison of the three sets of samples allows a dimension of the flow rate (water velocity) in lead release to potable water flowing into homes to be elucidated.
Between June 17th and June 21st, 2011, lead and iron profiles were collected from twelve homes in Providence, RI, to evaluate consumer exposure to lead and iron. Since January 2013, Providence Water has increased their finished water pH from 9.7 to 10.3 in an attempt to reduce distribution system corrosion. Based on this change, on August 12–13th, 2013, three homes (Site A, B, and C), which previously sampled high for iron and lead, were resampled to compare the change in metals concentration at these three sites. Site A had a full LSL, while Sites B and C had partial LSL replacements. The average temperature during the 2013 sampling period was 2.2 degrees Celsius higher than the 2011 sampling period, which is likely to slightly increase lead release in 2013.
Three sequential profiles were collected after a 6-h minimum stagnation time (Supplementary Fig. S1). For the low flow profile, nine sequential 1-L samples were collected at a rate between 1.3 and 1.7 L/min. The tap was allowed to run for 3 min before collecting the tenth 1-L sample. Immediately afterward, without allowing any stagnation time, the tap was fully opened and a moderate flow (flow rate=5.5 to 10 L/min) sequential profile was collected. Finally, high flow (flow rate=6.7 to 15 L/min) sequential samples were collected by removing the aerator from the faucet and opening the tap fully. A 10-mL aliquot from liters 3 and 5 in each profile was filtered in the field using a 0.45-μm pore size nylon syringe filter (Whatman) and a 10-mL BD syringe to operationally determine soluble and particulate metals in these samples (i.e., the third and fifth liter). These samples were selected for filtration because the third and fifth liter of a profile often contains water with soluble and particulate lead from the service lines (Cartier et al., 2012; Clark et al., 2014).
Sample analysis
Samples were digested using 2% nitric acid and 1% hydroxylamine by volume in the original sample bottle with heated exposure at 50°C for at least 24 h. Total metal concentrations were analyzed using a Thermo Electron X-Series inductively coupled plasma-mass spectrometry (ICP-MS; Thermo Electron, Waltham, MA) based on Standard Method 3125B (Clesceri et al., 1998).
Bench-scale testing
Bench-scale testing was conducted to determine effective corrosion control strategies for low-alkalinity high-pH waters analogous to Providence, RI. The overall experiment consisted of two phases. Phase 1 involved testing the effects of pH on iron release. The water derived from the Phase 1 reactors was used as the influent water for testing of lead corrosion in Phase 2, analogous to sequential exposure occurrence in a water distribution system where water first flows through the iron pipe and then contacts the lead pipe.
Phase 1: Effects of pH on iron corrosion
Effects of pH on iron release were examined using a synthesized water (SW) recipe developed by Wang et al. (2012) to simulate Providence tap water, but modified with the addition of 4.5 mg/L of silica as SiO2 and 0.3 mg/L Natural Organic Matter (NOM) as C to better match the actual Providence finished water (SW+NOM) (Supplementary Table S2). The water was tested at three different pH conditions (pH 8.3, 9.7, and 10.3) using single batch reactors for each pH condition for 24 weeks. The pH in the batch reactors was adjusted using sodium hydroxide and CO2. During week 12 of the experiment, a set of triplicate batch reactors was started to verify the trends in iron release observed in the individual reactors with statistical confidence. Each reactor consisted of an iron coupon (½-inch diameter by 1-inch long), which was epoxied to the bottom of a glass bottle with a working volume of 600 mL, resulting in an iron surface area-to-water volume ratio of 0.05 inch−1. This ratio is roughly equivalent to that found in a 40-inch radius iron pipe. The iron coupon was an alloy, which consisted of 95.3% iron (Supplementary Table S3). The reactors were mixed using an orbital shaker table.
Every Monday/Wednesday/Friday, 10-mL aliquots were taken from each batch reactor to generate weekly composite samples characteristic of the influent iron concentration to each lead pipe. At the end of each week, the composite sample (30 mL) was digested using 2% nitric acid and 1% hydroxylamine by volume and the iron concentration was analyzed using ICP-MS (Thermo Scientific Thermo Electric X Series) using Standard Method 3125B (Clesceri et al., 1998). Water taken from the batch reactors was used as the influent for the corresponding lead dump-and-fill experiment described below (Phase 2b). Since 27% (160 mL) of the water was removed, water in each batch reactor was refilled after each water transfer to the lead pipes.
Phase 2: Impact of iron on lead corrosion
Phase 2 consisted of two steps, which included preconditioning of new lead pipes (Phase 2a) and exposure of the lead pipes to water containing iron particulates generated in Phase 1 (Phase 2b).
Phase 2a: Conditioning of lead pipes
Eighteen 6-inch pieces of new lead pipes were conditioned for 4 weeks by pumping water continuously through the pipes in a recirculating system with the modified synthetic water (SW+NOM) described above at a high pH (i.e., 10.3). After the pipes were conditioned, they were separated into six groups (three pHs×two levels of iron [SW+NOM+Fe]) with triplicates tested at each condition. During conditioning, the water in the reservoirs was emptied once per week and replaced with fresh water.
Phase 2b: Exposure of lead pipes to iron particulates
Water was changed for each lead pipe thrice per week (Monday/Wednesday/Friday [MWF]) using a dump-and-fill protocol over a 24-week period (Supplementary Fig. S2). As a control, water from batch reactors without any iron present was used to fill half of the lead pipes. Weekly composite samples of the entire volume of water in the lead pipes were collected and analyzed using ICP-MS. At the beginning of weeks 20 and 25, samples were collected and analyzed to determine the relative proportions of soluble and particulate lead in each condition. Soluble samples were collected by filtering a 10-mL aliquot using a 0.45-μm pore size nylon syringe filter (Whatman) and a 10-mL BD syringe. The remaining water was then analyzed for total metals concentration.
Statistical analyses of results
A Shapiro-Wilks test was used to determine if the data were normally distributed. A t-test on normalized data or a nonparametric Wilcoxon test was used to measure the difference between two groups. An analysis of variance (ANOVA) test on the log-transformed normalized data was used to determine if there was a significant difference between the means of the three iron conditions in Phase 1. A three-way ANOVA test was also conducted using the log-transformed lead measurements to compare the six different lead conditions in Phase 2 with pH, iron, and water type as factors. Post-hoc analysis was conducted using Tukey's HSD multiple comparison test. Pearson's rank correlation coefficient was used to measure the linear relationship between lead and iron. All statistical analyses were performed in R (www.r-project.org/) with significance defined as p<0.05.
Results and Discussion
After discussing results of the bench-scale testing, examining effects of chemistry on various aspects of iron and lead corrosion, field test results are analyzed in the context of the full-scale monitoring data and experiences of the Providence Water system.
Bench-scale testing
Iron corrosion
Iron release stabilized after 5 weeks. Data for the steady-state period (i.e., weeks 6–24) were averaged to compare relative differences between different treatment conditions (Fig. 2). ANOVA analysis indicated no statistical difference between the pH 8.3 and 9.7 conditions (p=0.86). However, the pH 10.3 condition had as much as 35% less iron compared with the 8.3 and 9.7 conditions (p<0.05), consistent with the expectation that higher buffering capacity produced at the higher pH will reduce iron release in low-alkalinity waters (Vik et al., 1996; Benson et al., 2012). This trend was confirmed in the triplicate iron batch reactors where the pH 10.3 condition had up to 63% less iron (p<0.05) compared with the pH 8.3 and 9.7 conditions (Supplementary Fig. S3). Additionally, the pH 10.3 condition tended to form a denser more protective scale compared with the pH 8.3 or 9.7 conditions (Fig. 3). Based on these results, it would be expected that if the pH was decreased from 10.3 to 9.7 in the Providence, RI, distribution system, there would be a significant increase in iron levels.
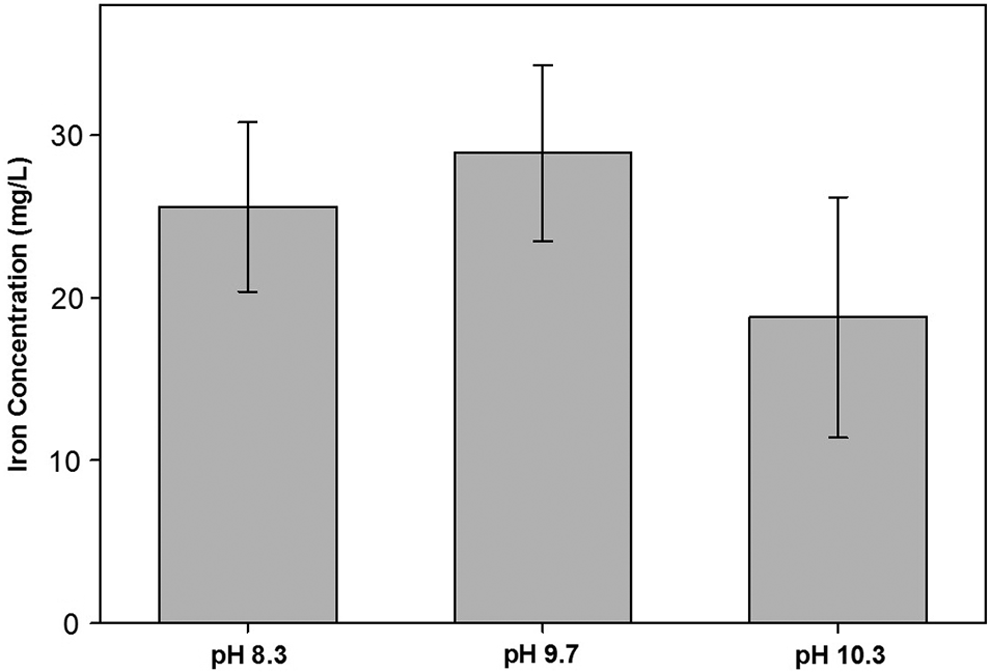
Average iron concentration after iron release stabilized (weeks 6–24). Error bars represent 95% confidence intervals.

Comparison of representative coupons at
Lead release
Stabilization of the lead pipes took 6 weeks. The data collected after the stabilization period (i.e., weeks 6–24) were averaged to compare the effect of different treatments on lead corrosion (Fig. 4). Based on the three-way ANOVA, there was a significant interaction effect between water type, pH, and the presence of iron on lead corrosion. All the conditions with iron present in the influent pipes had more than 150% more lead release than the corresponding controls without iron, which is likely due to the sorption and/or coprecipitation of lead onto the iron particles since more than 99.9% of the influent iron was particulate (Fig. 4) (p<0.001). This is analogous to detached iron particles from water mains flowing into an LSL and adsorbing lead and then releasing it at consumer taps through desorption or dissolution (Friedman et al., 2010; Camara et al., 2013). The highest average lead occurred in the pH 9.7 condition with iron, while the lowest average lead levels were observed in the pH 10.3 condition without iron. This suggests that reducing corrosion of iron mains and maintaining a pH of ∼10.3 was more effective at reducing lead release in this low-alkalinity water.

Average lead concentration after lead release stabilized (week 6 to 24). Error bars represent 95% confidence intervals. SW, synthesized water; NOM, Natural Organic Matter.
Speciation of lead
The cumulative mass of lead release from the triplicate samples was examined for soluble and particulate lead. Particulate lead species played a major role in the lead corrosion by-product release. Between 61% and 99% of the lead was determined to be particulate (Table 1). For the given water quality without iron (SW+NOM), soluble lead measurements were lowest at the pH 9.7 condition compared with pH 8.3 and 10.3 conditions. Soluble lead was 175% and 30% higher at the pH 8.3 and 10.3 conditions, respectively, compared with pH 9.7. This is consistent with theoretical predictions that the lowest lead solubility will occur at pH ∼9.8 (Schock and Lytle, 2010). However, based on these results, in the case of Providence, RI, the benefits associated with decreased solubility would be outweighed by the fact the total lead would increase at pH 9.7 (Fig. 5). Similar trends were seen for the corresponding conditions with iron where soluble lead was more than 50% lower at pH 9.7 compared with pH 10.3.
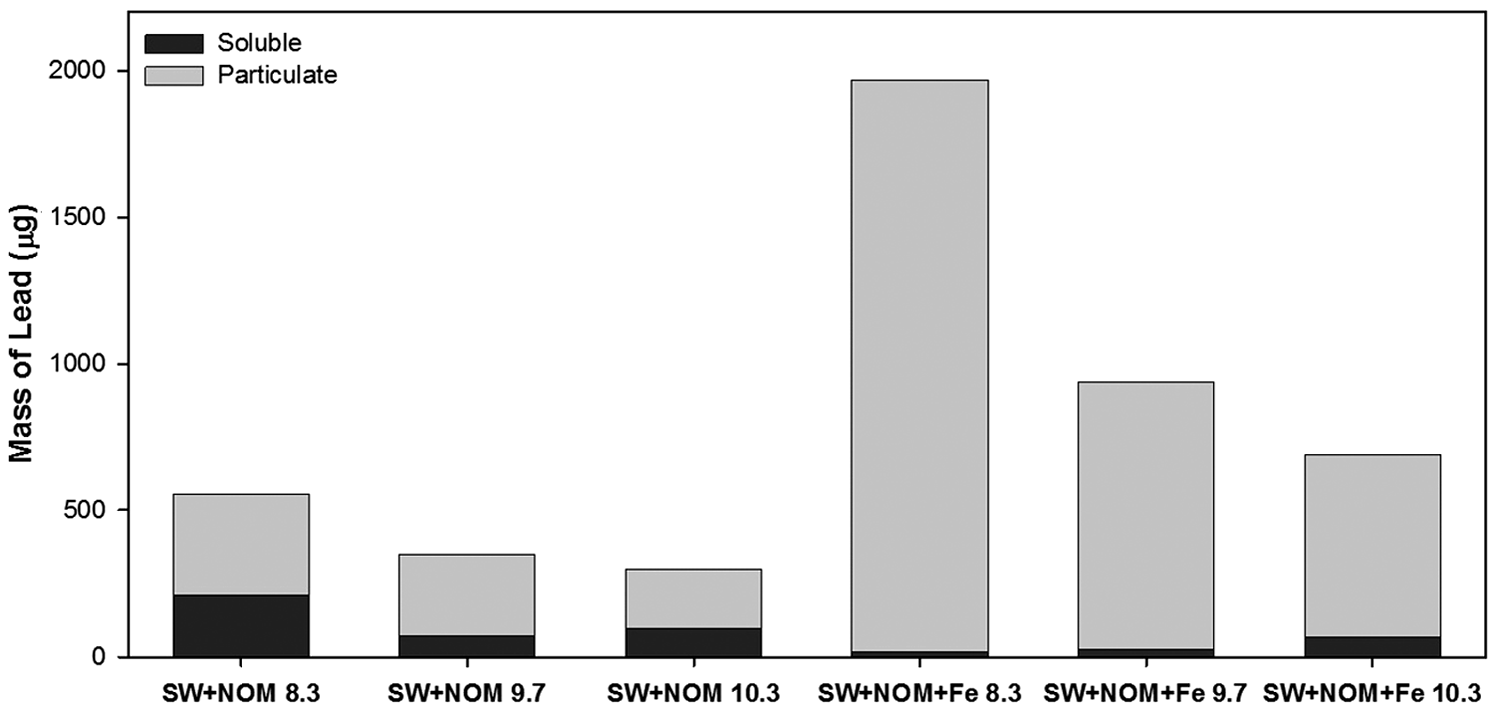
Cumulative mass of soluble and particulate lead in triplicate samples (weeks 20 and 25).
NOM, Natural Organic Matter; SW, synthesized water.
Relationship between lead and iron in bench-scale testing
Based on the Pearson's rank correlation coefficient, there was a statistically significant correlation between total iron and lead (R2=0.54, p<0.001, Fig. 6). There was also a strong relationship between particulate lead and iron (Supplementary Fig. S4, R2=0.74). This is consistent with previous studies that have demonstrated that in both natural and engineered systems lead will tend to adsorb to iron oxide particles (Erel et al., 1991; De Rosa and Williams, 1992; HDR, 2009; Deshommes et al., 2010; Friedman et al., 2010; McFadden et al., 2011; Camara and Gagnon, 2012; Camara et al., 2013). The implication is that the presence of iron reservoirs on lead pipes can increase lead release through lead-rich iron particulates.

Relationship between iron and lead.
Profile sampling
Based on results from the bench-scale test and results of distribution system monitoring by others, a panel of water quality experts set up by Providence Water recommended that the finished water pH be increased to the pre-2005 level of ∼10.3. Eight months after the implementation of this corrosion control strategy, profiling was conducted to evaluate the effectiveness of the corrosion control approach.
Iron corrosion
The iron release from consumer taps as a function of the time and flow rate was examined using profiling. Samples were collected from 12 homes in June 2011 and the three worst-case homes were resampled in August 2013. Data from the three worst-case homes were compared with each other to assess the effectiveness of the corrosion control strategy implemented by Providence Water. The cumulative iron released during low flow rate sampling decreased between 68% and 89% comparing 2013 with 2011 (Supplementary Table S4). At moderate flow, which is typical of consumer water use, iron levels were between 84% and 99% lower in 2013 than in 2011. At high flow, cumulative iron release decreased between 44% and 74%. At all sites, flushed samples (presumably representing water from the distribution system) indicated that iron levels decreased in all cases between 29% and 84% in 2013 versus 2011 (Supplementary Table S4). These results are consistent with the results from the bench-scale tests and theory, which predicted that pH 10.3 conditions would have significantly less iron than lower pH conditions. Furthermore, the field sampling results are consistent with the fact that there has been a 67% reduction in discolored water complaints between January and July 2013 (Welter, personal communication, September 23, 2013).
Lead release
Given the dramatic decrease in iron that was observed between 2011 and 2013 and the literature review conducted herein, it would have been expected that a significant decrease in lead levels would have been observed in all sample sites. However, comparing the profile collected at very low flow in 2011 and 2013, cumulative lead levels only decreased between 11% and 14% at two sites (Site B and C, respectively) and increased by 82% at Site A (Supplementary Table S4). For the profile collected at moderate flow reflecting typical consumer use, cumulative lead release was lower at Sites A and B (58% and 72%, respectively) and higher at Site C by 12%. Finally, at atypically high flow rates, lead levels were 63% lower at Site B. At the other two sites, lead levels were between 135% and 142% higher at the atypically high flow rates.
Thus, even though increasing the finished water pH from ∼9.7 to ∼10.3 resulted in a significant decrease in iron, unfortunately, the higher pH is expected to increase the amount of lead sorbed per unit of iron present (Supplementary Table S5) (Schultz et al., 1987; Stumm and Morgan, 1996). At a given site, the net result depended on whether the decrease in lead due to less iron was greater than the increased lead content per iron particle. For example, even though the ratio of particulate lead to particulate iron was 90 times higher in 2013 for the moderate flow samples at Site A, the cumulative mass of iron decreased by 99%, which resulted in a net decrease of 58% in overall lead release. On the other hand, at Site C, the ratio of particulate lead to particulate iron was seven times higher in 2013 for moderate flow samples, but iron only decreased by 86%, which resulted in a net increase of 12% in overall lead. It is currently believed that a very large reservoir of iron has accumulated on the lead pipes over the years, which might take a very long time to deplete even after iron stops accumulating. This creates a longer-term problem with lead particulate release, consistent with prior research on long-term problems associated with inorganic contaminant reservoirs in distribution systems (Reiber and Dostal, 2000; Lytle et al., 2004; Schock, 2005; Cantor, 2006; Deshommes et al., 2010; Lytle et al., 2010; Schock et al., 2014).
Speciation of lead
A filtered sample of the third and fifth liter of each profile was analyzed to characterize the relative fraction of particulate versus soluble lead. The results for all three profile conditions seem to confirm theoretical expectations (Schock and Lytle, 2010) that the increase in finished water pH by ∼0.5 pH unit could increase soluble lead (Fig. 7). It is also possible that warmer temperatures in 2013 versus 2011 could have also played a role in increased lead solubility. The average soluble lead in the 2013 low flow profiles was 9.0 versus 16.0 ppb in 2011 (p=0.39).
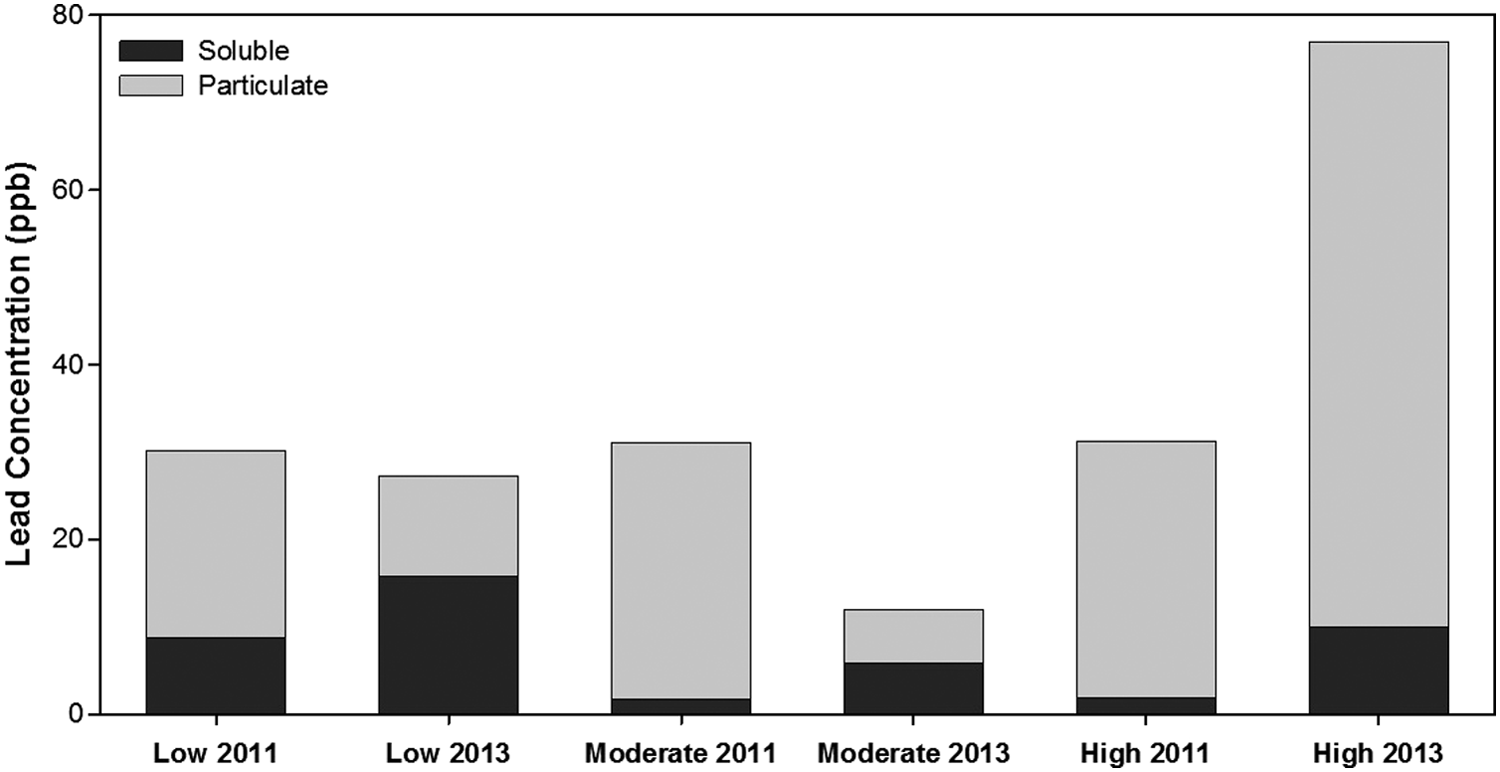
Stacked bar chart comparing the average soluble and particulate lead at low, moderate, and high flow rates for representative sample sites.
For the profile collected at moderate flow (with no prior stagnation), particulate lead decreased (p=0.04) in 2013 (6.2 ppb) versus 2011 (29.3 ppb) (Fig. 7 and Supplementary Table S6). Average soluble lead release for moderate flow profiles was three times higher in 2013 compared with 2011 (p=0.002). The net result is that for the total lead release at low and moderate flow, results in August 2013 had less lead than in June 2011, despite the fact that August 2013 had warmer temperatures, which might be expected to increase lead release. In 2013, the average soluble lead in high flow samples was 2.0 ppb compared with 10.2 ppb in 2011 (p=0.07). The average particulate lead was 66.8 ppb in 2013 versus 29.4 ppb in 2011 for samples at this atypically high flow rate (p=0.82).
Relationship between lead and iron at individual homes
A strong association between lead and iron was observed from profiling at moderate flow for Sites A and B in 2011. At Site A, there was almost a 1:1 (R2=0.97, p<0.0001) correlation between iron and lead for samples collected at moderate flow in 2011. However, in 2013, there was no longer a significant correlation between iron and lead, perhaps because iron levels had decreased dramatically (R2=0.30, p=0.40). A similar phenomenon was observed at Site B for samples collected at moderate flow (Supplementary Fig. S5). A statistically significant correlation between iron and lead was observed for high flow samples collected at Site A in 2013 (R2=0.74, p=0.01) and Site B in 2011 and 2013 (2011: R2=0.98, p<0.0001 and 2013: R2=0.91, p<0.001). Of the three homes, Site C was the only location where there was no significant relationship between lead and iron in 2011 or 2013 (i.e., all moderate and high flow R2 values <0.05), and this is the site at which improved iron corrosion control did not reduce lead release in 2013 versus 2011. Overall, these results indicate that particulate lead was very strongly associated with particulate iron in 2011 at some sites, and that this association was weakening due to the fact that both particulate iron and lead dropped in 2013.
The current study significantly advances practical knowledge and understanding of how particulate iron levels impact lead leaching in lower alkalinity waters and assist in improving LCR compliance for water utilities with similar water chemistry conditions. In several cases, there was an interplay between distribution system corrosion of the iron pipe and subsequent mobilization of lead. To the extent that iron pipe corrosion can increase lead release, reducing lead in water might require upgrades to potable water infrastructure or iron corrosion control as opposed to current approaches that focus exclusively on reducing lead solubility.
Conclusions
Bench scale
• Bench-scale tests verified that reducing the finished water pH from 10.3 to 9.7 would significantly increase lead leaching and consumer red water complaints due to iron release from cast-iron mains.
• Synthetic water containing particulate iron significantly increased lead release from lead pipes versus the same water without particulate iron.
• Soluble lead release was lower at the pH 9.7 condition compared with the pH 10.3 condition, which is consistent with theoretical predictions that the lowest lead solubility will occur at pH ∼9.8. However, benefits associated with decreased solubility can be outweighed by increased particulate lead at pH 9.7 both with and without iron.
Profile and utility sampling
• Eight months after the finished water pH was increased back to 10.3, iron levels in profile samples decreased by as much as 99%, which also corresponds to a significant decrease in consumer red water complaints.
• The profiles indicated several instances where there was a strong relationship between particulate iron and particulate lead. These analyses suggest that rehabilitating iron mains and controlling iron corrosion can be important factors contributing to lead corrosion problems.
• In moderate flow samples typical of consumer water use, there were two cases where lead release dropped in 2013 after the pH was increased, but one case where lead release increased. This suggests that in some cases, the benefits associated with corrosion control strategies can take years to realize, especially if the problems are associated with reservoirs of particulate iron on the pipe.
Footnotes
Acknowledgments
The authors thank Providence Water and Greg Welter of O'Brien and Gere. The authors would also like to thank Linda Chitayapuntagul, Brandi Clark, Navarre Bartz, Amanda Martin, Kathita Chittaladakorn, Siddhartha Roy, and Min Tang for their assistance with experimental work and field sampling. This research was funded by the Robert Wood Johnson Foundation (RWJF) under the Public Health Law Research Program Grant ID# 6839 and the National Science Foundation under grant EEC-1135328.
Author Disclosure Statement
No competing financial interests exist.
References
Supplementary Material
Please find the following supplemental material available below.
For Open Access articles published under a Creative Commons License, all supplemental material carries the same license as the article it is associated with.
For non-Open Access articles published, all supplemental material carries a non-exclusive license, and permission requests for re-use of supplemental material or any part of supplemental material shall be sent directly to the copyright owner as specified in the copyright notice associated with the article.