
Abstract
Abstract
The ability to quantify lignin is an important tool for characterizing the extent of decomposition of municipal solid waste (MSW). Traditionally, acid insoluble Klason lignin (KL) has been used to measure lignin. However, synthetic organic materials such as plastics and rubber present in MSW interfere with the traditional KL method, resulting in artificially high measurements. Another method for lignin analysis is CuO oxidation, in which lignin is oxidatively hydrolyzed into phenolic monomers that are quantified by high-performance liquid chromatography or gas chromatography–mass spectrography. The objective of this study was to evaluate the applicability of CuO oxidation to measure the lignin content of MSW. The study demonstrated that analysis of lignin monomers can be simplified by skipping the ethyl acetate extraction step and that ball milling is not necessary to optimize CuO oxidation. Neither the MSW components (e.g., plastics and metals) nor extractives affected CuO oxidation. The ratio of cellulose (Cel) plus hemicellulose (H) to KL [(Cel+H)/KL] has traditionally been used as an indicator of the extent of MSW decomposition. The use of Cel plus H to the sum of CuO oxidation products of lignin (Λ8) [(Cel+H)/Λ8] exhibited a similar trend to the traditional metric. CuO analysis provided information on the presence of hardwood, softwood, and nonwoody material in buried MSW, but is not recommended as a substitute for KL analysis.
Introduction
L
KL is the most widely used method to measure lignin in both plant tissues (Sarkanen and Ludwig, 1971; Lin and Dence, 1992) and in MSW (Barlaz, 2006). KL is operationally defined and involves removal of extractives followed by a two-stage acid digestion to hydrolyze the carbohydrates. The residue is then combusted and the volatile fraction is reported as KL (TAPPI, 1983). Recently, it has been shown that some synthetic organic materials, typically present in MSW, interfere with the KL method and these interferences result in artificially high lignin measurements (De la Cruz et al., 2013). This is because materials such as plastics and rubber are not dissolved during acid digestion and are measured as KL. In addition to acid-resistant synthetic organic materials, nonlignin acid-resistant polymers (e.g., cutin/suberin), which are present in significant amounts in nonwoody tissues, will be measured as lignin in the KL analysis. For example, nonlignin acid-resistant polymers such as cutin/suberin have been reported to represent up to 3.4 times the actual lignin content in agricultural products, yet will be measured as lignin in the KL analysis (Bunzel et al., 2011). Thus, a more lignin-specific method would be desirable to measure lignin in MSW.
There are several alternatives to measure lignin. Most of the methods were developed for the pulp and paper industry where samples of fresh tissues and pulp are relatively homogeneous, in contrast to MSW, which is a heterogeneous mixture. Lignin can be measured by isolation using mechanical and chemical processes followed by dissolution in a suitable solvent such as in milled wood lignin (Sarkanen and Ludwig, 1971; Dence, 1992). This method, however, is laborious because of the ball milling, solvent extraction, and precipitation steps, making it difficult to implement as a routine analysis for a large number of samples. Spectrophotometric methods to measure lignin include the acetyl bromide and thioglycolic acid methods (Lin and Dence, 1992), where lignin is dissolved in a suitable solvent followed by measurement of absorption at 280 nm. However, these methods may not be applicable to MSW because of interferences from chromophoric nonlignin aromatics and amino acids. The main limitation with spectrophotometric methods is that the absorptivity of the sample should be known and this parameter varies in MSW due to its heterogeneity.
CuO oxidation is an analytical method that involves cleavage of the lignin linkages, primarily β-O-4′, producing a suite of phenolic aldehydes, ketones, and carboxylic acids. In addition to monomers, oligomers are released in this process (Goñi and Hedges, 1992). CuO oxidation involves a one-electron transfer to form a phenoxy radical followed by eventual formation of quinone methide intermediates (Sarkanen and Ludwig, 1971). The lignin monomers are traditionally quantified by capillary gas chromatography–mass spectrography (GC/MS) or by high-performance liquid chromatography (HPLC) (Lin and Dence, 1992; Lobbes et al., 1999). The CuO oxidation products of different classes of lignocellulose (e.g., hardwood, softwood) are well documented (Hedges and Mann, 1979; Goñi and Hedges, 1995; Keil et al., 1998). Application of CuO oxidation of lignin has been demonstrated in the study of fluxes and sources of organic matter in natural environments (Ertel and Hedges, 1984; Lee et al., 1986; Goñi and Hedges, 1995; Hedges and Oades, 1997).
Whereas CuO oxidation allows for the detection of compounds that are unique to lignin (i.e., lignin phenols), making the method less susceptible to interferences, the monomers liberated during CuO oxidation are only a fraction of the total lignin, primarily the uncondensed fraction, which accounts for up to 35% of KL (Chen, 1992). Nevertheless, consistent degradation patterns have been reported in different classes of terrestrial plants (Hedges and Mann, 1979; Hedges and Ertel, 1982; Goñi and Hedges, 1992).
The objective of this study was to evaluate the adoption of the CuO oxidation method to quantify lignin in MSW based on the presence of phenolic monomer building blocks that are unique to lignin. Work was conducted to explore the potential interferences not typically present in the natural environment (e.g., plastics) and to evaluate the relationship between KL and lignin measured by CuO oxidation. Finally, the CuO method was applied to excavated landfill samples.
Materials and Methods
Experimental design
The objective of this study was to evaluate the adoption of CuO oxidation as a measure of lignin and for characterization of MSW decomposition. Work was conducted to (1) evaluate elimination of the ethyl acetate (or diethyl ether) liquid–liquid extraction step before HPLC analysis; (2) explore potential interferences, including plastics, metals, and extractives; (3) evaluate the effect of ball milling samples before CuO digestion; (4) evaluate the relationship between KL and the sum of CuO lignin monomers (Λ8) for different plant tissues; and (5) apply CuO oxidation to measure lignin and characterize decomposition in excavated landfill samples.
Effect of ethyl acetate extraction
Solvent extraction using diethyl ether (Hedges and Ertel, 1982) or ethyl acetate (Goñi and Montgomery, 2000) has traditionally been a part of the CuO lignin analysis to purify lignin phenols for subsequent derivatization before GC/MS analysis. With the use of an aqueous-based HPLC method, the extraction step can be omitted by directly injecting an aliquot of the acidified digestate, thus reducing analytical time and resources. Tests were conducted to determine if CuO oxidation could be simplified by skipping the ethyl acetate extraction step. Different types of samples (HW [hardwood red oak Quercus rubra)], SW [softwood spruce Picea sp.], a Raleigh grass mixture, and old newsprint [ONPa]) were analyzed with and without ethyl acetate extraction. Ethyl acetate extraction of the hydrolysate from CuO oxidation was done in two stages as described (Goñi and Montgomery, 2000). For treatment without ethyl acetate extraction, an aliquot of the acidified digestate was diluted as necessary and injected directly to the HPLC. Lignin phenol concentrations were compared with samples analyzed after ethyl acetate extraction.
Effect of MSW interferences
Tests were conducted to determine whether plastics and possible radical scavengers, typical components of MSW, interfere with CuO oxidation by releasing phenolic substances or by altering the reaction mechanism during CuO oxidation of lignin. The interference tests are listed in Supplementary Table S1. In each case, tests were conducted by adding potential interferences to old newsprint (ONPb) at double their estimated concentration in MSW (Supplementary Table S1). ONPb was selected as the base substrate because it is a representative lignocellulosic component in MSW. Differences in CuO oxidation products relative to the ONPb control would indicate interference. In addition to plastics, the effect of potential radical scavengers such as carbonates (as calcium carbonate), protein (bovine serum albumin), metals, and glass were tested. For carbonate, a mixture was formulated to contain calcium carbonate (twice the typical MSW ash content), which is present in food wastes and as fillers in some papers.
Effect of lipophilic extractives
To determine the contribution of lipophilic extractives to lignin monomers during CuO oxidation, samples of HW (red oak Q. rubra), SW (loblolly pine Pinus taeda), and grass (Bermuda grass Cynodon dactylon) were Soxhlet extracted as described previously (Lin and Dence, 1992). Sample weighing about 1 g was refluxed for 24 cycles (about 4 h) in toluene:ethanol (2:1, v/v) to remove the extractives. The CuO oxidation products of lignin in the initial and extracted material were compared.
Effect of ball milling
Four materials (HW [red oak Q. rubra], SW [loblolly pine P. taeda], Grass [Bermuda grass C. dactylon], and ONPa) were ground to pass a 60-mesh screen (0.251 mm opening) in a Wiley mill. Two grams of each material was ball milled in toluene using alumina-fortified porcelain jars charged with zirconia grinding media (6.4×6.4 mm) (Cole-Parmer) in a 0.4-L jar mill rotating at 30 rpm under N2 (Lin and Dence, 1992; Ikeda et al., 2002; Holtman et al., 2006). Optimal charging of 45–55% (v/v) was used as per the manufacturer's instructions. The ball milled sample was recovered by centrifugation at 2,850 rpm for 10 min. The toluene layer was aspirated and the residual toluene was removed by evaporation at 50°C under vacuum. The ball milling time was determined from preliminary work as the time required to completely dissolve a sample in a dimethylsulfoxide (DMSO) and N-methylimidazole (NMI) solvent system (Lu and Ralph, 2003) and ranged from 14 to 28 days depending on the sample. The CuO oxidation products of ball milled samples were compared with samples that were ground in a Wiley mill.
Sample collection and preparation
Wood samples were obtained from a local lumber yard and from the collection of Dr. Ilona Peszlen of the Department of Forest Biomaterials at NC State University (NCSU). Leaves and needles were collected from the Raulston arboretum from July to September 2011 and August to September 2012. Grass samples were collected from the NCSU Turf Farm in September 2011. Plant tissues samples were dried at 50°C, ground to pass a 60-mesh screen in a Wiley mill, and then redried at 50°C to constant weight. Samples were then stored in mason jars at room temperature until analyzed. Two samples of old newsprint (ONP) were used for the interference testing; ONPa was the Washington Post and ONPb was the News and Observer (Raleigh, NC). The pulping process that is used to make newsprint involves the mechanical, thermal, and chemical processes, which may disrupt the S2 layer and result in small amounts of lignin loss (Roberts, 1996). Compared with chemical pulping, which is used for copy paper production, a significant fraction of lignin remains in the pulp after mechanical pulping. Similarly, paper samples were dried, shredded, ground, and stored in air-tight mason jars.
Landfill samples used in this research were selected from an inventory of samples to include a range of (Cel+H)/KL (0.4–3.5), which traditionally has been used as a metric of the extent of solids decomposition (Barlaz, 2006). Excavated landfill samples were obtained from the Outerloop Kentucky (KY) landfill that receives a mixture of residential and commercial solid waste. Samples were obtained using a 0.91 m bucket auger. After reaching the surface, samples from a specified depth interval were mixed by a shovel and then grab samples were collected. These samples were obtained as part of a program to monitor solids decomposition (KY) (Abichou et al., 2013). The excavated refuse was shredded, dried to constant weight, ground, and stored as above.
Analytical methods
Alkaline CuO digestion and HPLC detection
A sample containing 2–5 mg·C equivalent was placed in a 25-mL Teflon vial (Savillex) with 0.5 g CuO powder, 0.1 g Fe(NH4)2(SO4)2·6H2O, and 5 mL of 2 M NaOH (prepared using deionized water, boiled, and cooled under N2). The vial was then sealed and locked under a N2 headspace in an anaerobic hood. The Teflon vial was placed inside a steel box before digestion in a furnace at 150°C for 3 h as a precaution given the elevated temperature that develops during digestion. After digestion, the vial was partially immersed in an ice bath to stop the reaction and allowed to cool to room temperature.
The vial was then sonicated for 15 min after which the contents were quantitatively transferred to a 50-mL centrifuge tube for centrifugation at 3,500 rpm for 10 min. The hydrolysate was decanted into a glass centrifuge tube and the remaining solids were washed with 5 mL of 2 M NaOH. The mixture was centrifuged at 3,500 rpm for another 10 min and the hydrolysate was combined with the initial hydrolysate. The hydrolysate was acidified (pH≤2) with 6 mL of 12 M HCl and then transferred quantitatively to a 100-mL volumetric flask. An aliquot of this solution was further diluted as necessary to obtain a concentration within the calibration range (0.05–25 μM for each phenolic monomer).
Samples were analyzed using a Shimadzu LC-20AT HPLC equipped with a degasser (DGU-20A5) and an SPD 20A Photodiode Array Detector (PDA). Chromatographic analyses were conducted using a gradient program at 55°C using a Phenomenex Kinetex 2.6u C18 100A column as described previously (Lobbes et al., 1999). Mobile phase A was H3PO4 (pH=2.5), mobile phase B was methanol, and mobile phase C was acetonitrile. The HPLC system was reconditioned to the initial condition after every sample by flushing with acetonitrile and then with mobile phase A. The system pressure ranged from 105 to 145 bar during analysis. After each injection, the sampler was purged with methanol/water (1:1 v/v). All HPLC samples and standard solutions were filtered (0.2 μm; Millipore Millex Teflon filter) before injection. Aqueous solutions were prepared using filtered (0.2 μm) and UV-treated deionized water.
Lignin phenols were identified by using retention times and light absorption characteristics from external standards (0.05–25 μM). The calibration curve was linear within this concentration range. The spectra of each monomer were measured in the wavelength range of 230–370 nm, which covers the maximum absorption for all lignin phenols. Integration of the peaks for each lignin phenol was done at its respective maximum wavelength using the Shimadzu LC solutions software. The 11 lignin phenols analyzed were as follows: (4-hydroxybenzoic acid [PAD]; 4-hydroxybenzaldehyde [PAL]; 4-hydroxy-3-methoxy-benzoic acid [vanillic acid, VAD]; 4-hydroxyacetophenone [PON]; 4-hydroxy-3-methoxy-benzaldehyde [vanillin, VAL]; 3,5-dimethoxy-4-hydroxy-benzoic acid [syringic acid, SAD]; 4-hydroxy-cinnamic acid [p-coumaric acid, CAD]; 3,5-dimethoxy-4-hydroxy-benzaldehyde [syringaldehyde, SAL]; 4-hydroxy-3-methoxy-acetophenone [acetovanillone, VON]; 4-hydroxy-3-methoxy cinnamic acid [ferulic acid, FAD]; 3,5-dimethoxy-4-hydroxy-acetophenone [acetosyringone, SON]). Standards were purchased from Sigma-Aldrich at the highest purity available.
Cellulose, hemicellulose, and KL
To analyze the solids for their cellulose, hemicellulose, and KL concentrations, the sample was first washed with 140 mL toluene:ethanol (2:1 v/v) to remove extractives. Samples were then subjected to a two-stage acid hydrolysis. In the first stage, the sample (0.1–0.3 g) was hydrolyzed in 3 mL of 72% (w/v) sulfuric acid for 1 h at 30°C. This was followed by a secondary hydrolysis after the addition of 83 mL of deionized water and a fucose internal standard. The secondary hydrolysis was done in an autoclave at 121°C for 1 h. Sugars (arabinose, galactose, glucose, mannose, and xylose) were analyzed by HPLC using a pulsed electrochemical detector (Petterson and Schwandt, 1991; Davis, 1998). The mass of glucose was converted to the mass of cellulose, whereas the mass of the other sugars was converted to the mass of hemicellulose by an anhydro correction. KL was measured from the solids remaining after acid hydrolysis as the weight loss on ignition at 550°C for 2 h.
Total organic carbon (TOC)
TOC was measured with a PE 2400 CHN Elemental Analyzer (Perkin-Elmer Corp.). All TOC samples were acid washed (1 M HCl) to eliminate inorganic carbon before analysis (Ryba and Burgess, 2002).
Data analysis
To test the effect of different factors (i.e., analysis method, interferences, and ball milling) on the eight lignin phenol yields, multivariate analysis of variance (MANOVA) was conducted. MANOVA is a multivariate technique to test the hypothesis that one or more independent variables or factors have an effect on a set of two or more dependent variables (Everitt, 2010). An omnibus test of hypothesis like MANOVA reduces the probability of making a Type I error that is rejecting the null hypothesis when it is in fact true. Details of the analysis as well as the underlying assumptions of MANOVA have been described (Everitt, 2010). Tests for significance were determined using the Wilks Lambda test. The MANOVA routine was implemented using R (R Core Team, 2013). When a significant difference was obtained, separate univariate analysis of variance (ANOVA) tests were conducted, in which the level of significance was divided by the number of tests conducted. All statistical comparisons were done at the α=0.05 level of significance.
Results and Discussion
The 11 lignin phenols liberated during CuO oxidation of lignin were identified and quantified in a 30-min HPLC run, which is significantly shorter than the 47–60 min previously reported (Steinberg et al., 1984; Lobbes et al., 1999) because of the use of a shorter solid core column with a smaller particle size and relatively low pressure. The p-hydroxy phenols (PAL, PON, and PAD) could have nonlignin sources, such as the amino acids tyrosine and phenylalanine (Hedges and Parker, 1976), and therefore were excluded from the sum of lignin phenols. The effects of interferences and skipping the ethyl acetate extraction are presented first. This is followed by evaluation of the relationship between KL and CuO oxidation products of lignin. Finally, the CuO method was applied to characterize lignin in excavated samples from a landfill in KY.
Effect of ethyl acetate extraction
The objective of this test was to evaluate elimination of the ethyl acetate (or diethyl ether) extraction step. The lignin phenols with and without ethyl acetate extraction for different sample types are presented in Fig. 1 and Supplementary Table S2.
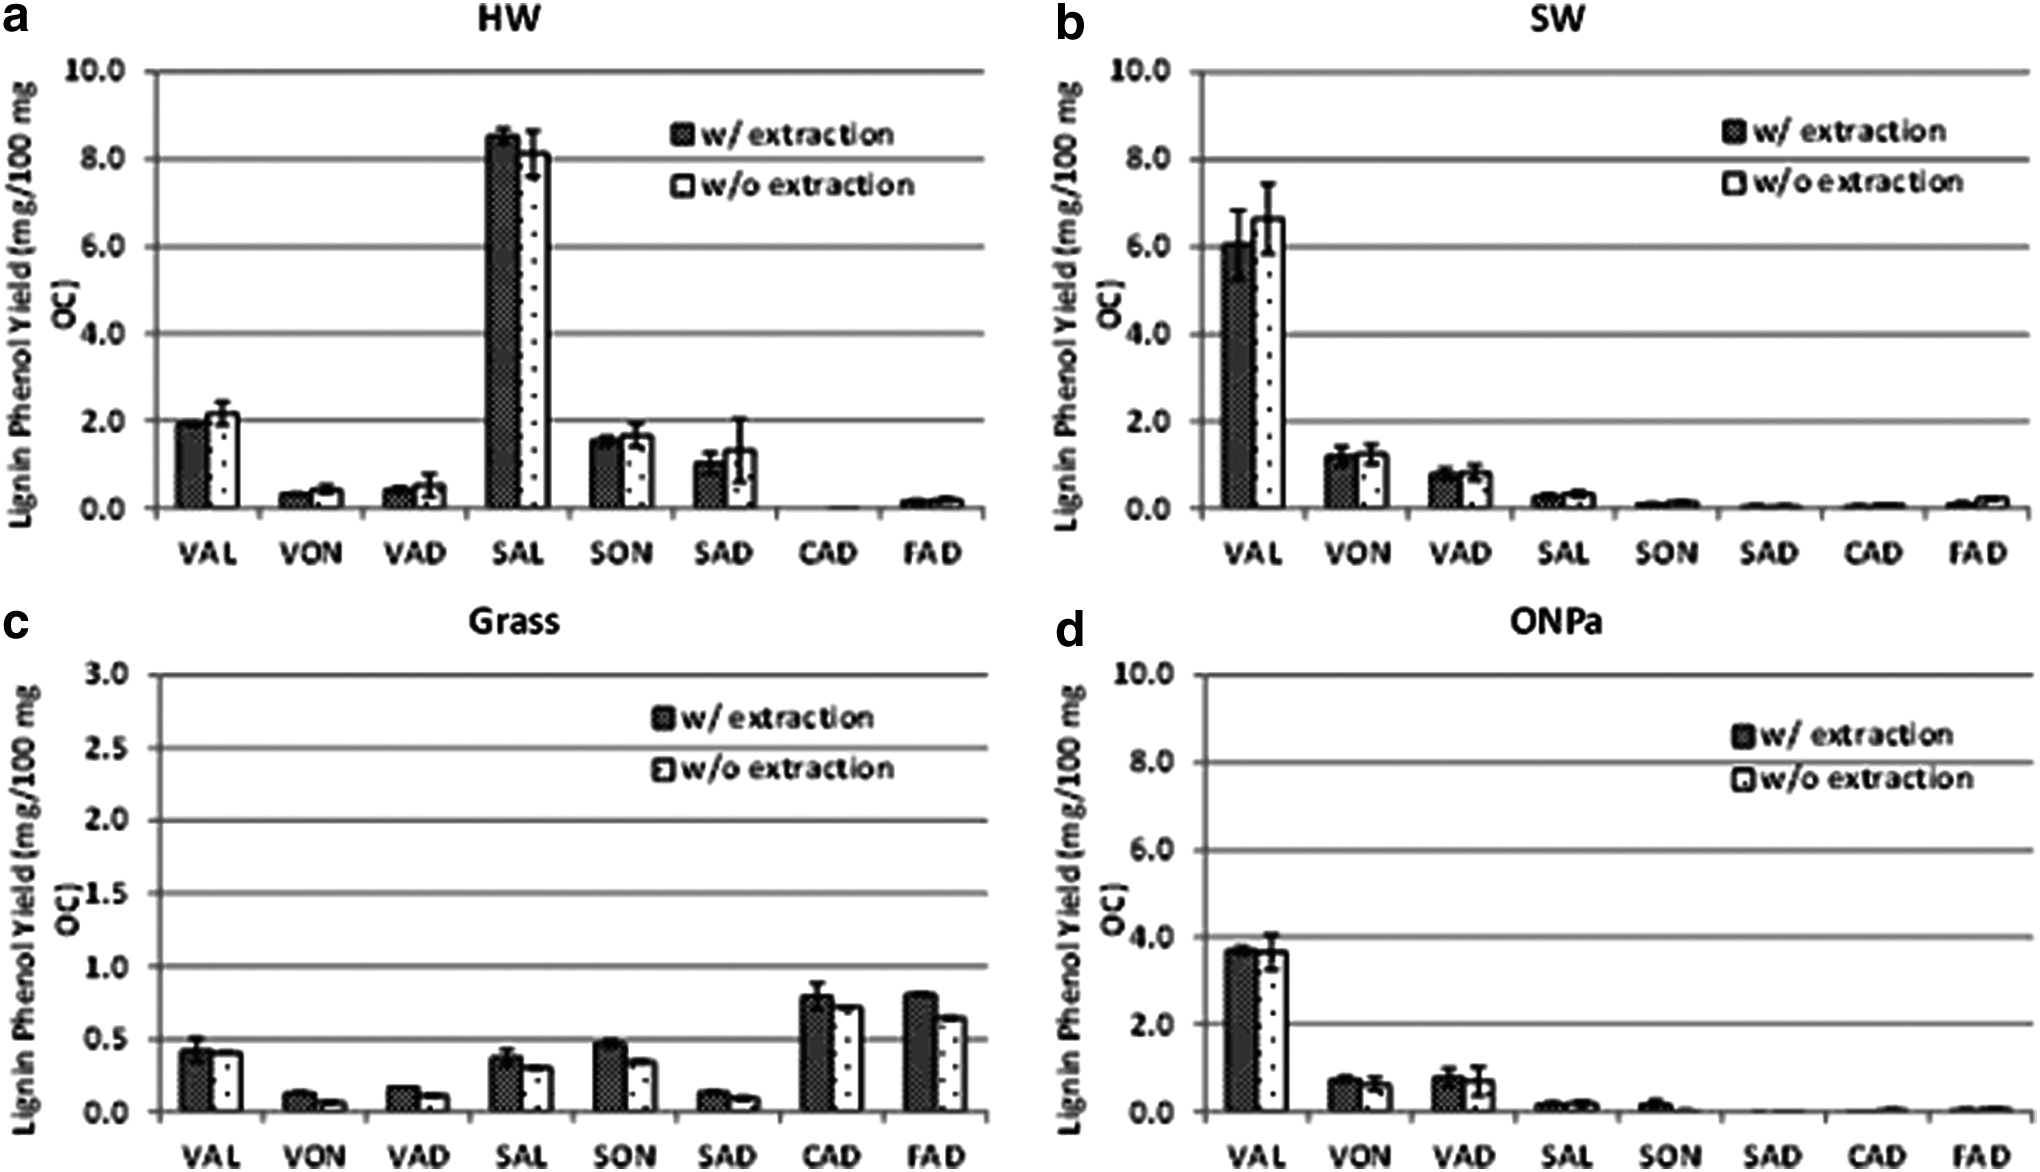
Effect of ethyl acetate extraction step on lignin phenol yields from different tissue samples.
One-factor MANOVA was used to compare the data across different sample types. Based on MANOVA test statistic (Wilks lambda), there is no significant difference (p>0.05) in any of the lignin phenol yields with and without ethyl acetate extraction. As a result, all subsequent work was conducted without ethyl acetate extraction.
As expected, the major lignin phenols in hardwood are syringyl (S) phenols SAL, SON, and SAD, typical of angiosperm tissues, whereas vanillyl (V) phenols VAL, VON, and VAD are dominant in SW, a gymnosperm. The presence of small amounts of S phenols in softwood has been documented previously, although S phenols are typically associated with HW, leaves, and grass (Bland et al., 1950; Sarkanen and Ludwig, 1971). The low cinnamyl (C) phenols CAD, FAD in HW and SW are characteristic of woody tissues. The major components of grass are S and C phenols that are characteristic of nonwoody angiosperm. The mean lignin phenols reported in this study are generally within the range reported by Hedges and Mann (1979) with differences attributed to species variation as the tissues used in this study do not exactly match. The ONP used in this test appears to have been derived from SW pulp as indicated by the low S/V ratio (0.06).
While we were able to skip ethyl acetate extraction in this study without significant loss in the quality of the chromatogram of both pure tissues and MSW, the benefit of this cleanup step for some types of samples may be necessary. For example, this step may be necessary in samples that contain significant concentrations of lipids, such as in food waste, as lipids may affect chromatogram quality. There was no loss of peak resolution after the injection of about 1,500 samples in one column although column performance was not fully evaluated.
Effect of MSW interferences
Results of tests to evaluate whether certain MSW components could interfere with CuO analysis are presented in Fig. 2 and Supplementary Table S3. Mixtures of ONPb and different MSW components that represented potential interferences to CuO lignin analysis were tested. The major lignin phenols of ONPb are SAL (1.56±0.24 mg/100 mg OC) and VAL (2.24±0.21 mg/100 mg OC) with average coefficients of variation (CV=SD/mean×100%) of 9% and 16%, respectively, across all the interference tests. The low C/V (0.02) and high S/V (0.67) of the ONP sample suggest that the pulp from which it was derived was HW or a mixture of HW and SW.
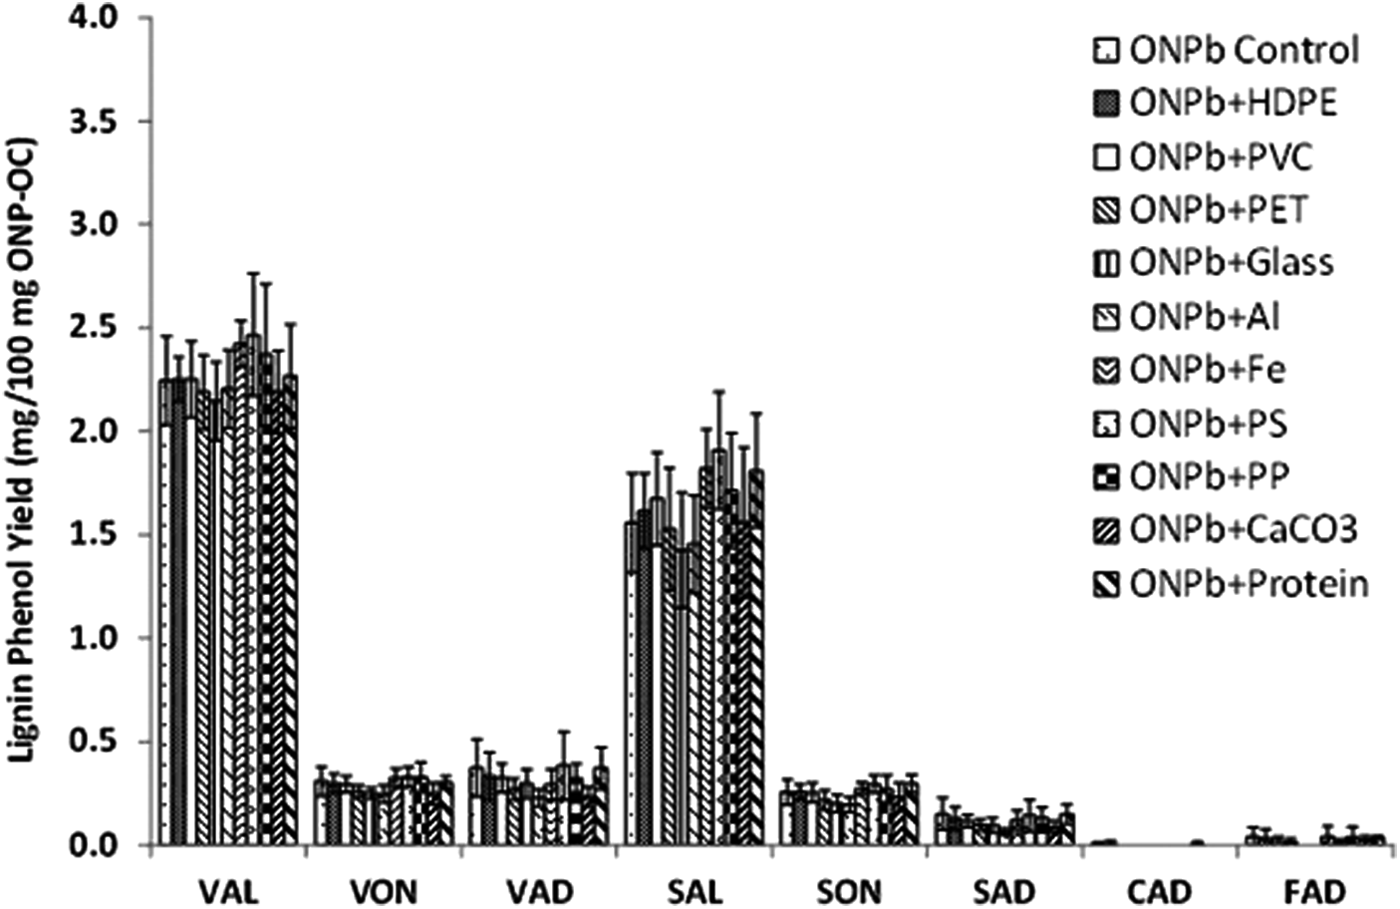
Effect of different components in municipal solid waste on CuO oxidation of ONPb at 2× the level in the U.S. EPA Waste Characterization report (U.S. Environmental Protection Agency, 2008). Error bars represent±SD. The number of replicates is presented in Supplementary Table S3. ONPb, sample of old newsprint.
One-factor MANOVA was implemented to test the significance of the potential interferences on eight lignin phenols. Based on the MANOVA test statistic (Wilks lambda), there is no significant difference in lignin phenol yields (p>0.05). This indicates that in mixtures of a test compound with potential interferences at double their level in MSW, there were no interferences.
To explore whether pure plastics and protein could release phenolic monomers, pure samples of HDPE, PVC, PET, protein, PS, and PP were subjected to the CuO procedure. In all cases, the contribution of pure individual plastics and protein to phenolic monomers attributed to lignin was insignificant. For example, the highest concentration of phenols was PON released from PET at 0.0014 mg/100 mg sample, which is equivalent to an estimated 0.005% increase in the PON in the PET plus ONP test. Moreover, the nonmethoxylated p-hydroxy phenyl groups (PAL, PON, PAD) that are expected to be released from plastics and proteins were not used as biomarkers.
The result that metals (Al and Fe) do not interfere with CuO oxidation is contrary to the results of Hernes et al. (2013) where it was shown that some fraction of lignin is irreversibly sorbed to mineral particles and cannot be measured by CuO analysis. However, there are two main differences between the tests conducted by Hernes et al. (2013) and this study. First, in Hernes et al. (2013), CuO analysis was done on the lignin that was sorbed on mineral particles. Second, the starting organic carbon (Hernes et al., 2013) was a water-soluble fraction of the lignocellulose.
While a range of materials have been tested for interference, the interactions of these materials in MSW during decomposition were not tested. Landfill chemistry changes during decomposition may impact the lignin CuO oxidation products. Nonetheless, it was shown by both spectroscopic and chemical degradation methods that in the absence of these potential interfering MSW components, lignin as well as its CuO oxidation products are essentially the same before and after decomposition (De la Cruz et al., 2014).
Effect of lipophilic extractives
In addition to lignin, lignans, fatty acids, terpenes, waxes, and other compounds collectively called extractives are present in the plant cell wall. The effect of the removal of extractives on CuO oxidation products of lignin is presented in Fig. 3 and Supplementary Table S4. One-factor MANOVA showed that there is no significant difference (p>0.05) between the lignin phenols of different samples with and without Soxhlet extraction. This confirms that a majority of the lignin fraction in plant cell walls is present in the secondary layer (Bowyer et al., 2007) and the presence of some lignin in the extractives did not affect the overall yields of lignin-derived CuO oxidation products. The lower SAL in the extracted HW is surprising, but not consistent with other observations. The total extractives in HW and SW were 8% and 17% of dry weight, respectively. Thus, the effect of extractives on CuO oxidation should be more apparent in SW, yet no effect was identified (Fig. 3).

Effect of extractives on the CuO oxidation of different classes of lignocellulose.
Effect of ball milling
The effect of ball milling on the CuO oxidation products of lignin is presented in Fig. 4 and Supplementary Table S5. Ball milling is part of a standard procedure in isolating lignin from plant tissues (Lin and Dence, 1992). Ball milling is a physical process, but the heat generation during impact could result in cleaved and/or condensed lignin structures. While it has been previously shown that ball milling results in only minor cleaved structures (Ikeda et al., 2002; Holtman et al., 2006), its effect on CuO oxidation products of lignin is unknown.
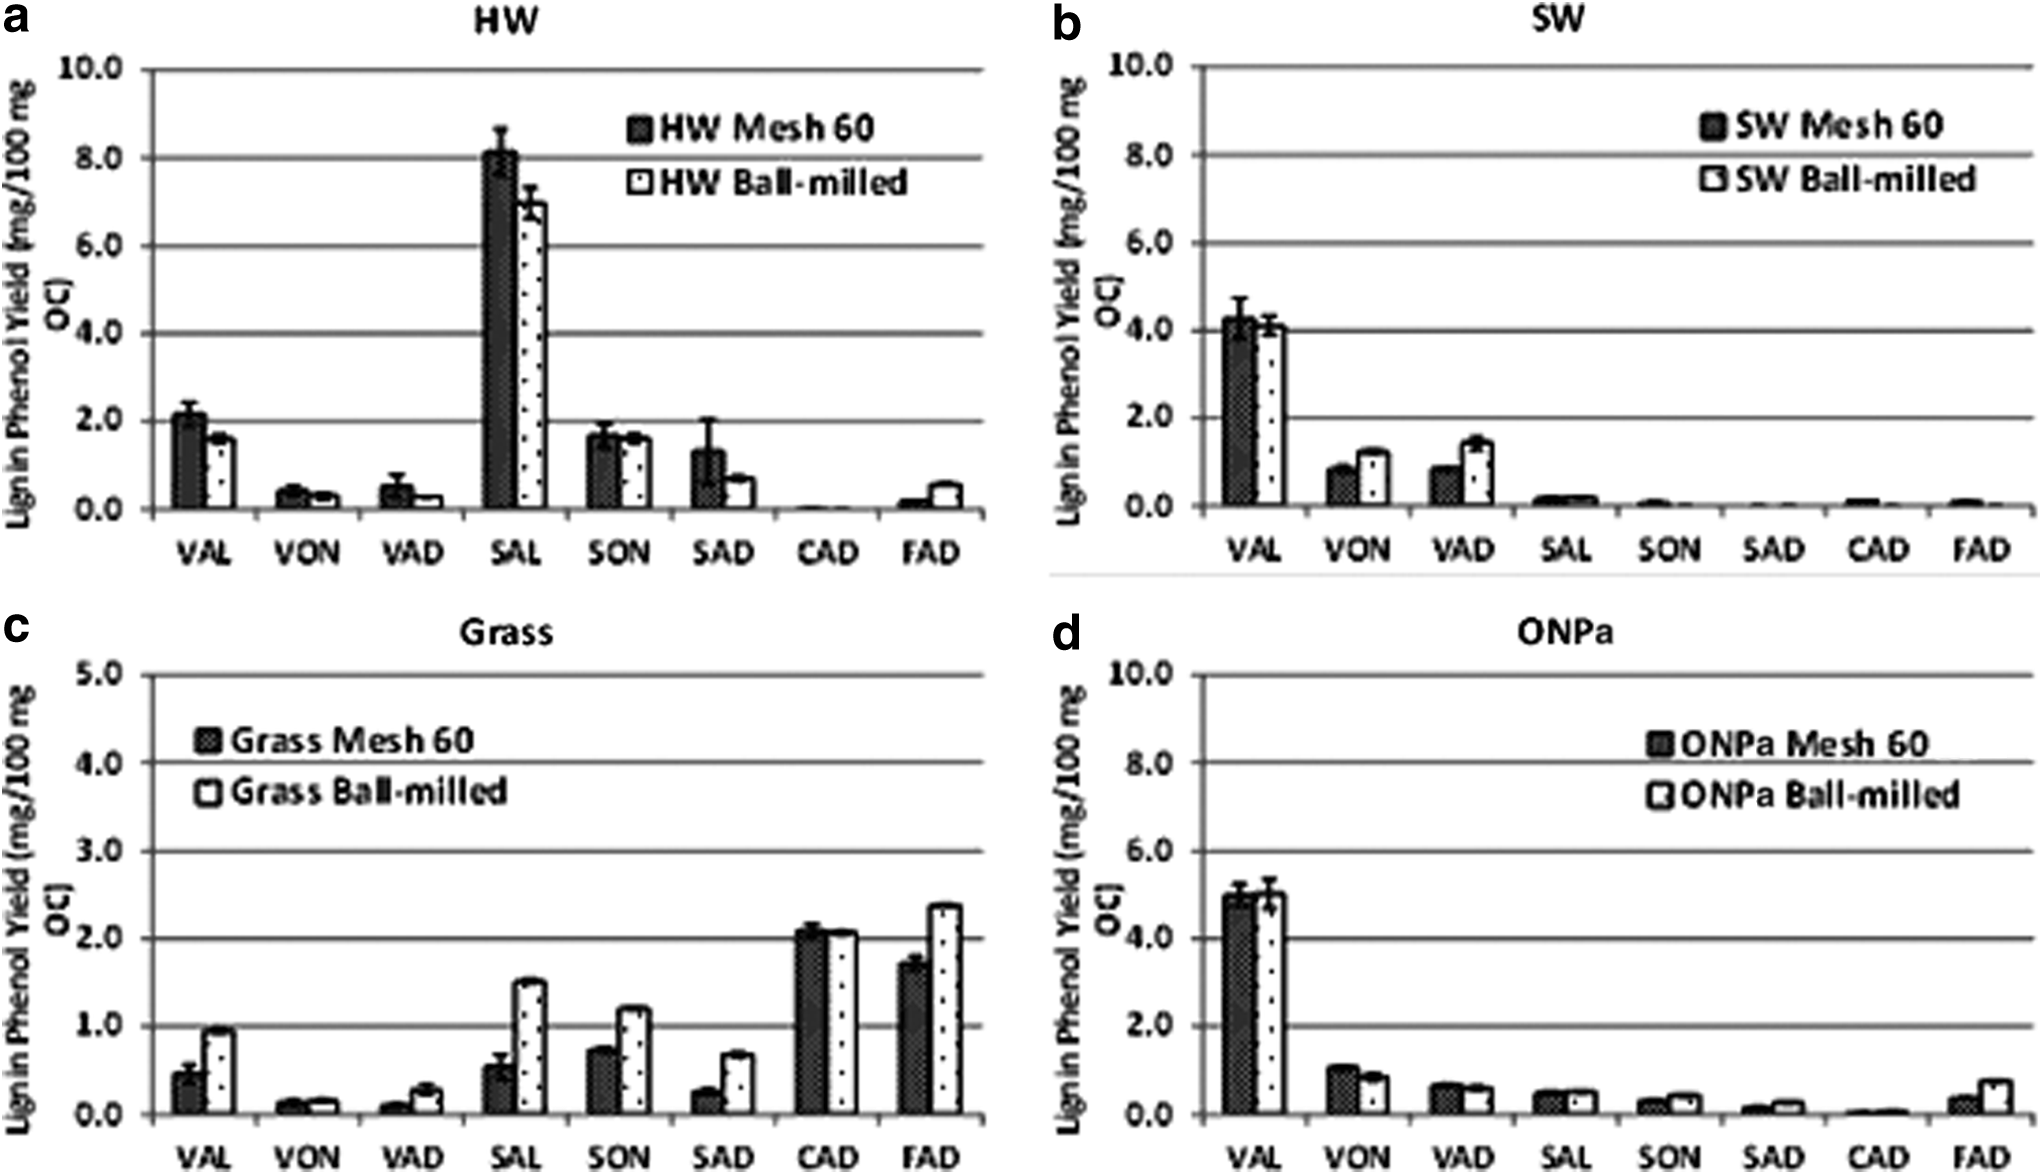
Effect of ball milling on the CuO oxidation of different types of samples of plant origin.
One-factor MANOVA showed that the CuO oxidation product concentrations after grinding to pass a 60-mesh screen are similar to concentrations in ball milled samples.
Relationship between KL and CuO oxidation products of lignin
The relationship between KL and Λ8 (Λ8=VAL+VON+VAD+SAL+SON+SAD+CAD+FAD) was evaluated by analyzing a total of 221 fresh and decomposed samples, including 93 different species of HW, SW, leaves, grass, and needles. The scatterplot matrix (Supplementary Fig. S1) and correlation matrix (Supplementary Table S6) of individual lignin phenols are presented in the standard deviation (SD). The individual S phenols (SAL, SON, SAD), V phenols (VAL, VON, VAD), and C phenols (CAD, FAD) are positively correlated with each other (r=0.84–0.94, 0.84–0.96, and 0.89, respectively). The data also showed that KL is positively correlated with V phenols, whereas negatively correlated with S and C phenols. This can be explained by the fact that lignin is generally higher in SW where Λ8 is lower. Similarly, lignin is generally lower in HW where Λ8 is higher. Based on the 42 SW and 69 HW samples analyzed in this study, the KL of SW (29.3%±5.5%) is significantly higher (p<0.05) than that of HW (23.0%±5.1%), whereas the Λ8 of SW (5.7±1.5 mg/100 mg OC) is significantly lower (p<0.05) than that of HW (10.5±2.7 mg/100 mg OC). The lower Λ8 in SW is because lignin monomers measured during CuO oxidation are primarily the uncondensed fraction. While SW generally contains more lignin, SW lignin is more condensed as a result of the availability of the five positions for branching in the guaiacyl units that dominate SW (Bland and Sternhell, 1965; Sarkanen and Ludwig, 1971; Capanema et al., 2004). This higher degree of condensation compared with HW results in the smaller amount of monomers released during CuO oxidation and hence the negative correlation between KL and Λ8 in SW.
The relationship between KL and Λ8 is weak when KL is expressed as % by weight (Supplementary Fig. S2) (r = −0.3), with more variability in KL when Λ8 is small (leaves, grass, and needles). To eliminate the effect of inorganic matter such as minerals from cover soil in landfill, lignin was normalized to organic carbon (Fig. 5). Figure 5 suggests that KL is not correlated to Λ8. There are several reasons that likely contribute to the lack of correlation. First, the CuO oxidation monomers represent only a fraction of the total lignin. The average ratio of Λ8 to KL for the 221 samples tested was 10% (SD=8.5%) with a range of 0.6% (Cornus florida leaves) to 46% (Betula papyrifera HW). Second, because of the presence of acid-resistant polymers such as cutin/suberin in nonwoody tissues (Bunzel et al., 2011), the KL of these materials is artificially high and the relationship between KL and Λ8 will differ between woody and nonwoody tissues. In fact, Soxhlet extraction (toluene/ethanol, 2:1, v/v) of a sample of each of HW, SW, and grass showed that at least ∼30% of the KL could theoretically be attributed to acid-insoluble polymers. Third, as explained above, the CuO method will more fully liberate the uncondensed monomers present in HW, thus confounding the relationship between Λ8 and KL.

Relationship between KL and Λ8. KL, Klason lignin; Λ8, sum of lignin derived phenols.
Preliminary partial least square regression (PLSR) analysis was also conducted with the individual lignin phenols as well as S, V, and C as independent variables and KL as response. The goal of PLSR is to obtain orthogonal predictors from the linear combinations of the original variables, optimizing the correlation between the response and transformed variables. PLSR analysis showed that only a maximum 35% of the variation in KL could be explained by the CuO oxidation products of lignin. Thus, prediction of KL from CuO is not reliable. Nonetheless, KL and CuO oxidation-derived lignin concentrations provide complementary information, including information on the composition of lignin sources as described below (SW, HW, etc.).
Application to excavated samples from KY landfill
Compositional variation in the lignin phenols of the excavated MSW samples from the KY landfill is presented in Fig. 6a. The majority of the lignin phenols in the MSW samples are VAL (0.91±0.38 mg/100 mg OC) and SAL (0.72±0.42 mg/100 mg OC). The very low cinnamyl phenols suggest that the lignin from the MSW samples is predominantly from woody tissues. Based on the S/V and C/V ratios, the major source of lignin in these MSW samples is hardwood tissue, with a smaller contribution from softwood tissues (Fig. 6b). The absence of nonwoody tissue (i.e., grass, leaves, and needles) may be due to the separate collection of yard waste in Louisville and/or grass decomposition.
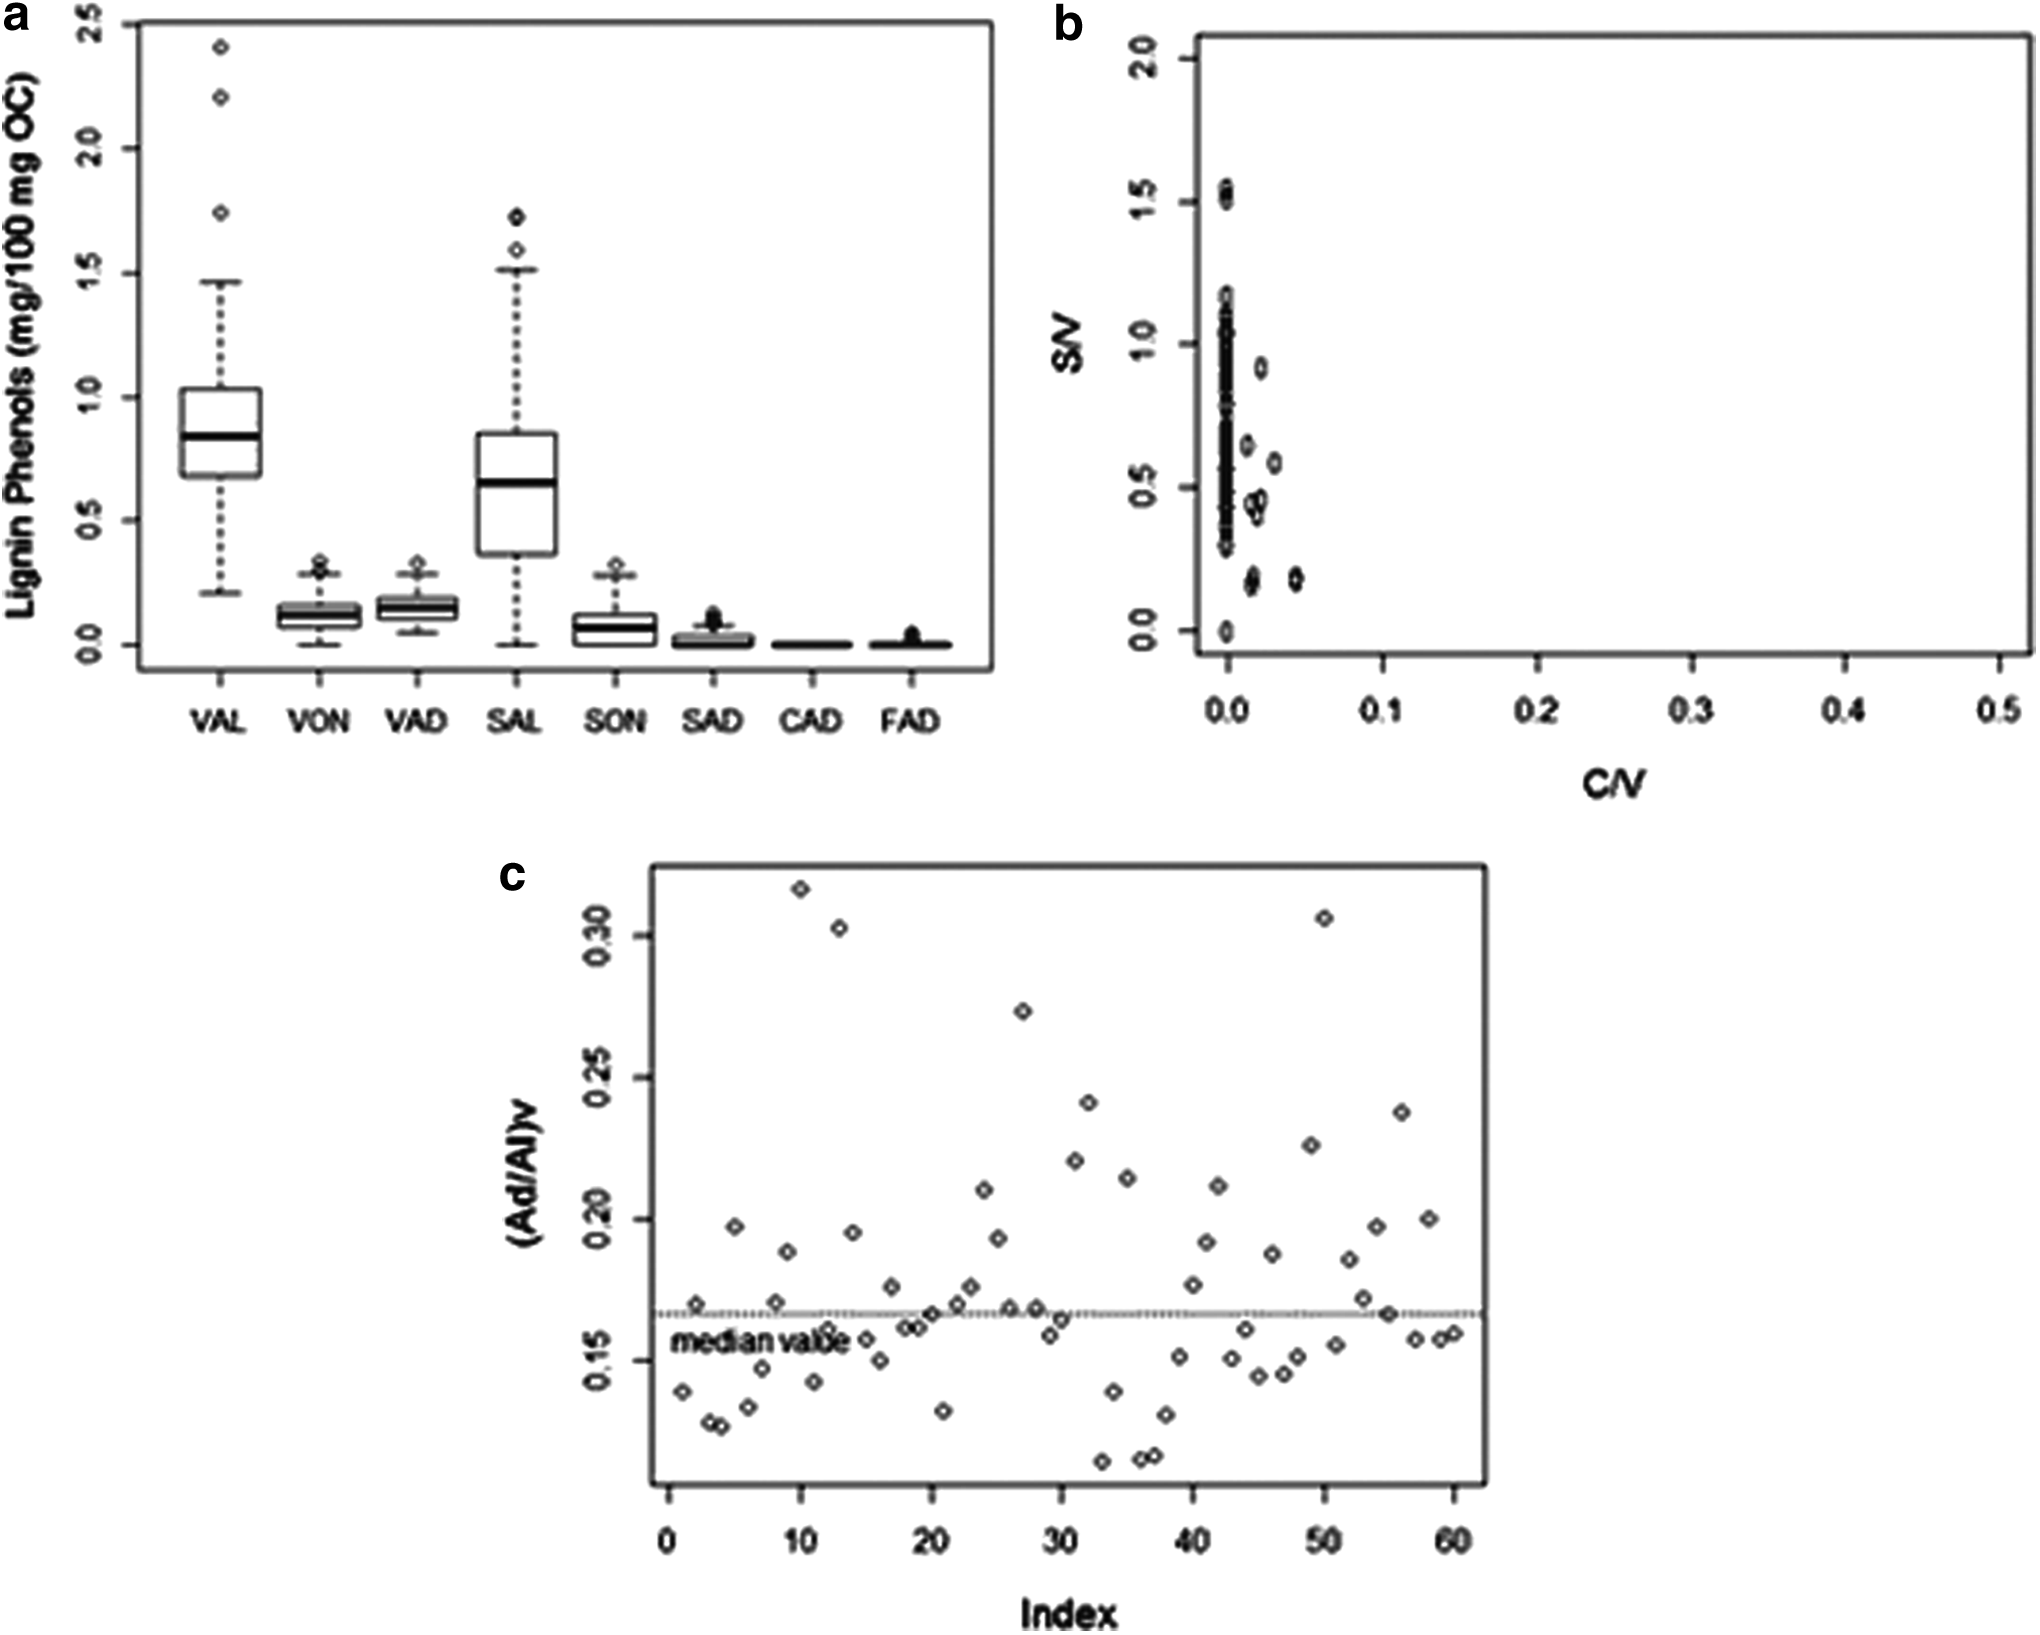
Compositional variation in the CuO lignin phenols of the landfill samples (n=30).
The (Ad/Al)V ratio has been used as an indicator of the extent of decomposition of lignin in geochemical samples (Ertel and Hedges, 1984; Hedges et al., 1988; Otto and Simpson, 2006). The (Ad/Al)V of 0.18±0.04 for the MSW samples (Fig. 6c) is within the range of previously reported values of 0.1–0.2 for fresh tissues (Thevenot et al., 2010). While three of the samples have (Ad/Al)V ratios greater than 0.3, the C/V ratios of these samples are not zero (i.e., nonwoody tissue). Nonwoody tissues have a wider range of (Ad/Al)V of 0.2–1.6 (Thevenot et al., 2010), which suggests that the higher (Ad/Al)V ratio of these select samples is due to the confounding effect of both decomposition and nonwoody tissues as the source of lignin.
The ratio of the sum of the degradable components of MSW—Cel and H—to lignin has been used as an indicator of the extent of MSW decomposition (Cel+H)/KL. This is because Cel and H are depleted relative to lignin during MSW decomposition. Thus, enrichment in lignin as indicated by a low (Cel+H)/KL is indicative of a high degree of decomposition based on the assumption that lignin is conservative in anaerobic systems (Colberg, 1988). The comparison of (Cel+H)/KL and (Cel+H)/Λ8 ratio is presented in Fig. 7. As expected (Cel+H)/KL decreases with waste age (Barlaz, 2006). Of course, waste age is an imperfect surrogate for decomposition, given the heterogeneity in both waste composition and moisture distribution in landfills. Figure 7 shows a similar trend for (Cel+H)/KL and (Cel+H)/Λ8 with waste age, suggesting that the effect of plastics as an interference with KL was not significant in these samples. Parameters (Cel+H)/KL and (Cel+H)/Λ8 were positively correlated (r=0.8) (Fig. 7b). The positive correlation between (Cel+H)/KL and (Cel+H)/Λ8 (Fig. 7b) is not consistent with the absence of a relationship between KL and Λ8, presented in Fig. 5. As shown previously, based on C/V and S/V ratios (Fig. 6b), the source of lignin in MSW samples is dominated by a few types of tissues, primarily hardwoods, having similar CuO oxidation products, which explains why KL is positively correlated with Λ8. Moreover, in the case of hardwood, the KL measurement is not biased by the presence of nonwoody tissues that contain other polymers resistant to acid hydrolysis, improving the correlation between KL and Λ8.

Relationship between
While similar conclusions can be derived from using (Cel+H)/KL and (Cel+H)/Λ8, the latter ratio is in theory more robust as Λ8 is derived from a compound-specific method as opposed to KL, which is an operationally defined bulk parameter, and may include interferences that artificially increase the denominator (KL). However, for the 30 landfill samples presented in Fig. 7a, there is no apparent advantage to the more robust Λ8-CuO as a metric of the extent of decomposition. One potential limitation of CuO oxidation is that it only measures the uncondensed fraction of lignin, which is a possible explanation for the lack of a relationship between KL and Λ8.
Summary
This study was motivated by the desire to identify an alternative to KL analysis due to interferences in MSW. However, there was little correlation between KL and Λ8 due to limitations with both analyses as applied to MSW. Λ8 from CuO oxidation preferentially includes the (uncondensed) fraction, whereas KL includes nonlignin acid-resistant polymers present in nonwoody tissue as well as acid-resistant synthetic materials not typically present in the natural environment. The most common use of the lignin concentration is for its use in the ratio of degradable (cellulose and hemicellulose) to recalcitrant (lignin) carbon. While the KL may be artificially high due to the presence of cutin and suberin, these materials are also recalcitrant in anaerobic systems, such as landfills, so the concept for the ratio is still useful (Killops and Killops, 2005).
While the study did not show an advantage to adopting CuO oxidation compared with KL for the MSW samples that were tested, both methods are subject to some limitations and the choice of methodology depends on the research objective. If the goal is to determine the total amount of lignin present, then KL can be used. However, the KL measurement will be highly biased because of the presence of nonlignin components that survive acid hydrolysis. One strategy to minimize this bias would be to manually remove plastics, rubber, and synthetic textiles from MSW samples before shredding. On the other hand, CuO oxidation is more useful for cases where the objective is to determine the relative distribution of lignin in MSW as well as lignin source characterization.
Supplementary Data
The effect of plastics and other MSW components on CuO oxidation products, as well as a summary of CuO oxidation products of different tissues, is presented in the Supplementary Data.
Footnotes
Acknowledgments
The authors would like to thank David Black of Environmental Engineering laboratory, NCSU and Jennifer Dickson Brown of Marine, Earth, and Atmospheric Science, NCSU for the help with analytical chemistry; Dr. Ilona Pezslen of the Department of Forest Biomaterials, NCSU for providing the wood samples; April Bauder of NCSU turf farm for providing the grass samples; and Drs. Krings and Weathington of Raulston Arboretum for assistance with plant tissue collection and identification. Funding for this research was provided by the National Science Foundation and Waste Management, Inc.
Author Disclosure Statement
No competing financial interests exist.
References
Supplementary Material
Please find the following supplemental material available below.
For Open Access articles published under a Creative Commons License, all supplemental material carries the same license as the article it is associated with.
For non-Open Access articles published, all supplemental material carries a non-exclusive license, and permission requests for re-use of supplemental material or any part of supplemental material shall be sent directly to the copyright owner as specified in the copyright notice associated with the article.